2026/Q3 Betsson AB (publ) interim report January – September 2026 ”Continued high customer activity and record revenue ” QUARTER JULY – SEPTEMBER 2026 THE PERIOD JANUARY – SEPTEMBER 2026 • Group revenue was EUR 326.5 (295.8) million, an increase of…
2026/Q3
Betsson AB (publ) interim report January – September 2026
”Continued high customer activity and record revenue ”
QUARTER JULY – SEPTEMBER 2026
THE PERIOD JANUARY – SEPTEMBER 2026
•
Group revenue was EUR 326.5 (295.8) million, an
increase of 10%. Organic increase of 8%.
•
Group revenue was EUR 922.1 (893.1) million, an increase of 3%.
Organic increase of 6%.
•
Casino revenue increased by 14%. Sportsbook revenue
increased by 1% and the sportsbook margin was 8.1% (8.8%).
•
EBITDA was EUR 171.8 (244.4) million, a decrease of 30%.
The EBITDA margin was 18.6% (27.4%).
•
EBITDA was EUR 63.4 (82.5) million, a decrease of 23%.
The EBITDA margin was 19.4% (27.9%).
•
Operating income (EBIT) was EUR 122.3 (199.9) million,
a decrease of 39%. The EBIT margin was 13.3% (22.4%).
•
Operating income (EBIT) was EUR 46.1 (66.9) million,
a decrease of 31%. The EBIT margin was 14.1% (22.6%).
•
Net income was EUR 84.1 (147.5) million, corresponding
to EUR 0.59 (1.04) per share.
•
Net income was EUR 28.2 (50.1) million, corresponding
to EUR 0.19 (0.34) per share.
•
Operating cash flow was EUR 173.0 (192.3) million.
•
•
Operating cash flow was EUR 54.5 (64.8) million.
•
Net debt was EUR -98.3 (-220.0) million.
The AGM approved dividend to shareholders of EUR 0.66 (0.76)
per share. Last year’s dividend included a special dividend of
EUR 0.10 per share.
•
Active B2C customers amounted to 1.9 (1.3) million.
Revenue
Earnings per share
1,200
1.40
1,000
1.20
1.00
EUR
MEUR
800
600
0.80
0.60
400
0.40
200
0.20
0.00
0
2022
2023
Q1
2024
Q2
Q3
2025
Q4
2022
2026
2023
Q1
Q2
2024
Q3
2025
Q4
2026
KEY DATA
MEUR
Q3 26
Q3 25
∆
Jan-Sep 26
Jan-Sep 25
Revenue
326.5
295.8
10%
922.1
Gross profit
181.1
189.8
-5%
523.0
Gross margin %
55.5
64.2
EBITDA
63.4
82.5
EBITDA margin %
19.4
27.9
Operating income (EBIT)
46.1
66.9
EBIT margin %
14.1
Net income
28.2
Earnings per share (EUR)
Operating cash flow
Casino revenue
Sportsbook gross turnover
Sportsbook revenue
Sportsbook margin after free bets %
Deposits
Active customers (number of)
∆
Jan-Dec 25
893.1
3%
1,197.0
571.6
-9%
755.5
56.7
64.0
63.1
-23%
171.8
244.4
-30%
313.7
18.6
27.4
26.2
-31%
122.3
199.9
-39%
253.1
22.6
13.3
22.4
21.1
50.1
-44%
84.1
147.5
-43%
182.4
0.19
0.34
-44%
0.59
1.04
-43%
1.29
54.5
64.8
-16%
173.0
192.3
-10%
215.6
253.5
223.0
14%
674.9
647.7
4%
867.5
1,365.6
1,263.2
8%
4,113.7
4,563.2
-10%
6,033.3
71.8
71.2
1%
243.2
240.9
1%
323.5
8.1
8.8
8.9
8.7
8.7
1,545.4
1,452.3
6%
4,287.4
4,529.4
-5%
6,020.9
1,874,687
1,338,494
40%
1
2026/Q3
CEO COMMENT
Continued high customer activity and record revenue
The high level of customer activity continued during the third quarter, supported by the
FIFA World Cup and the start of the major European football leagues. Customer deposits
and total gaming turnover increased, while the number of active customers rose by 40
percent to a new record.
Revenue also reached a new all-time high for a single quarter, which is particularly positive
given that the sportsbook margin was considerably lower than in the second quarter.
Instead, growth was driven by the casino product. This performance demonstrates the
strength of our diversified business model, with a broad geographical presence, several
strong brands and competitive offerings in both sports betting and casino that complement
each other.
Pontus Lindwall, President and CEO of
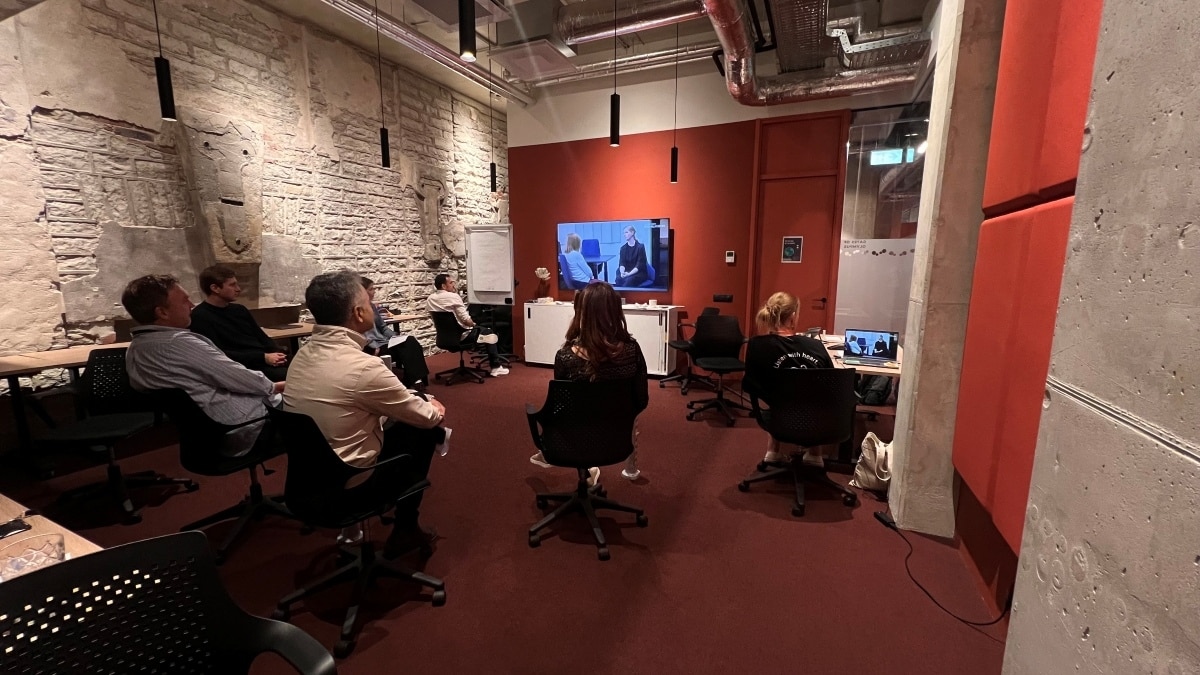
Betsson AB, visiting Betsson’s new
office in Malaga.
Founded in
1963
Betsson AB’s share
is listed on Nasdaq
Stockholm
Large Cap
Ticker: BETS B
22
Holder of local licenses
in 22 countries
Growth was driven primarily by Latin America, where the positive momentum continued
and revenue increased by more than 50 percent. Peru and Argentina once again stood out,
with high customer activity and strong revenue growth, largely due to the successful
execution of marketing activities in connection with the FIFA World Cup. Our long-term
investments in products, brands and locally adapted marketing continue to strengthen our
positions in the region.
At the beginning of August, the acquisition of Rhino Entertainment Group (Rhino) was
completed. Rhino was subsequently consolidated into the Group and made a positive
contribution to revenue and earnings during the quarter. The acquisition strengthens our
geographical and commercial diversification and provides additional opportunities to
generate profitable growth over time.
At the end of the quarter, Betsson was launched in Belgium through a rebranding from
betFIRST. The rebranding strengthens Betsson as one of the industry’s leading global brands
and reflects the Group’s ambition to drive greater consistency and scalability across the
business.
Operating income (EBIT) amounted to EUR 46 million, an increase compared with the
previous quarter. The operating margin also improved slightly, despite a considerably lower
sportsbook margin during the quarter.
At the same time, we continued to invest in our product offering and proprietary
technology. Several new features were added to the sportsbook during the period, including
additional betting opportunities during extra time in football matches, as well as team and
player pages for the biggest matches in Europe. Gates of Inter, a casino game developed
specifically for Betsson and featuring graphics based on our sponsorship of Inter Milan, was
also launched during the quarter. It is the third sponsorship-based casino game developed
exclusively for Betsson, following similar games featuring Boca Juniors and Atletico
Nacional.
Following another quarter of record revenue, improved operating income and a positive
start to October, we now look forward to an intensive end to the year. We have a full
pipeline of activities aimed at enhancing our customers’ entertainment and engagement.
With a scalable business model, attractive products and strong market positions, we are
well positioned to return to earnings growth and continue creating long-term value for our
shareholders.
Pontus Lindwall
President and CEO Betsson AB
Betsson AB (publ), interim report July-September 2026
2
2026/Q3
SIGNIFICANT EVENTS AND OUTLOOK
SIGNIFICANT EVENTS DURING THE QUARTER
Financing
In July, Betsson signed a long-term multi-currency revolving credit facility (RCF) of EUR 75
million with a leading Nordic bank. The credit facility has a term of two years with an option
to extend for an additional year. The purpose of the RCF is to create increased flexibility
regarding working capital requirements and general corporate purposes, including
acquisitions.
Acquisition
In early August, the acquisition of Rhino Entertainment Group was completed. The
acquisition includes several Rhino Group entities that collectively hold assets, licenses,
personnel and operational capabilities related to B2C activities in Ontario and the rest of
Canada. In addition to the B2C assets, Betsson acquires Rhino’s proprietary middleware and
front-end technology. This technology will strengthen Betsson’s B2B offering and is
expected to drive incremental licensing revenue within Betsson’s B2B business.
SIGNIFICANT EVENTS AFTER THE END OF THE QUARTER
No significant events have occurred after the end of the quarter.
TRADING UPDATE
This trading update is an indication of how the fourth quarter of 2026 has started, however
it is not a revenue forecast for the quarter.
The average daily revenue in the fourth quarter of 2026 up until and including 18 October
was 11.0 percent higher than the average daily revenue of the full fourth quarter of 2025.
During the start of the fourth quarter of 2026, the sportsbook margin has been significantly
lower than the average for the last eight quarters.
Adjusted for currency effects and acquisitions, the average daily revenue until 18 October
was 9.4 percent higher than the average daily revenue of the full fourth quarter of 2025.
Betsson AB (publ), interim report July-September 2026
3
2026/Q3
THE GROUP’S OPERATING ACTIVITIES
Betsson’s operational subsidiaries offer online casino, sports betting and other types of
games. In the following sections, we comment on the development of the operational
business as well as the financial development of the Group.
STRATEGIC DIRECTION FOR GROWTH
Betsson’s long-term ambition is to outgrow the market, which should be done in a profitable
and sustainable manner with local adaptations. Betsson has identified the following growth
areas: growth in existing markets, expansion into new markets and development of the B2B
offering.
Betsson sees opportunities to grow in these areas, both organically through in-house
development and through acquisitions. Betsson’s financial position provides flexibility to
supplement the existing business with new geographical markets and products.
Betsson’s strong brand name, proprietary technology platform and sportsbook enable quick
and flexible entry into new markets. With the proprietary sportsbook, new offerings with
economies of scale can be developed.
At the end of the quarter, the Group launched its flagship brand, Betsson, in Belgium. The
rebrand sees the former betFIRST operation transition to the Betsson brand, following
similar successful brand migrations across several European markets in recent years. This
strategic move marks another step in Betsson’s international expansion and underscores the
Group’s commitment to strengthening Betsson as one of the industry’s leading global
brands. Betsson Group acquired betFIRST in June 2023.
PRODUCT AND TECHNOLOGY DEVELOPMENT
Betsson’s gaming sites are largely operated on the proprietary platform Techsson, which is
a Player Account Management System (PAM) that makes up the core of the offering and user
experience. Techsson manages payments, customer information and account management
as well as the games. The proprietary platform provides flexibility and enables rapid
adaptation to new market conditions and ahead of launches in new markets. Betsson also
works continuously to meet authorities’ rising demands for data and reporting and has
developed a tool to automate a large part of these deliverables.
Adaptations and further development of Betsson’s tech platform and sportsbook are also
being made to support a B2B offering.
Within the Betsson Group, artificial intelligence (AI) has been an important innovation factor
supporting, for example, customer service and various predictive tools. More recently, AI is
being used to drive efficiencies across all operations in the Group, including marketing and
product and technology development.
Several new onboarding and payment solutions were integrated across some of the Group's
most important markets.
For the sportsbook, several enhancements were introduced, such as new betting
opportunities during extra time in football matches, as well as team and player pages for
the main matches in Europe.
During the quarter, a bespoke casino game called Gates of Inter was released, featuring
visual assets related to the sponsorship of Inter Milan. This is the third bespoke casino game
developed for Betsson based on a sponsorship, following previous similar releases featuring
Boca Juniors and Atletico Nacional.
Betsson AB (publ), interim report July-September 2026
4
2026/Q3
THIRD QUARTER DEVELOPMENTS
CUSTOMER ACTIVITY
Customer deposits in all operational subsidiaries’ gaming solutions, both B2C and B2B
(gross), were EUR 1,545.4 (1,452.3) million during the quarter, an increase of 6.4%.
Active customers in B2C increased by 40.1% during the quarter to 1,874,687 (1,338,494).
Customer deposits by quarter (B2C and B2B)
1,800
1,600
1,400
MEUR
1,200
1,000
800
600
400
200
0
Q1
Q2
Q3
Q4
Q1
Q2
2022
Q3
Q4
Q1
Q2
2023
Q3
Q4
Q1
Q2
2024
Q3
Q4
Q1
2025
Q2
Q3
2026
Active customers by quarter (B2C)
2,000
1,800
1,600
000's
1,400
1,200
1,000
800
600
400
200
0
Q1
Q2
Q3
2022
Betsson AB (publ), interim report July-September 2026
Q4
Q1
Q2
Q3
2023
Q4
Q1
Q2
Q3
2024
Q4
Q1
Q2
Q3
2025
Q4
Q1
Q2
Q3
2026
5
2026/Q3
MARKET DEVELOPMENT BY REGIONS
Betsson’s long-term ambition is to outgrow the market, both organically and through
acquisitions. This should be done in a profitable and sustainable manner with various local
adaptations. Betsson operates in locally regulated markets with local licenses, as well as in
Point of Supply (POS)-regulated markets based on a license from the Malta Gaming Authority
(MGA). POS-regulation refers to markets in which a product offering is made available based
on EU and/or international law principles, without being licensed locally in such markets.
Betsson’s direction is to focus the B2C operations on locally regulated markets, as well as
markets that have a clear path towards local regulation in the near future. In markets where
local regulation is not considered likely to be introduced in the near term, Betsson’s
ambition is to discontinue its B2C operations, which is now continuously taking place.
The regional split below serves as an indication of the end users’ residence. The reported
revenue for each region includes both gaming revenue from the B2C business as well as
license revenue for system delivery to Betsson's B2B customers.
Nordics
Revenue related to end users in the Nordics was EUR 32.7 (36.4) million, a decrease of
10.0%.
Both Sweden and Denmark reported decreased revenue in the third quarter compared with
the corresponding period last year. The decline was driven by decreased revenue across
both the sportsbook and casino product.
Western Europe
Revenue by region
Revenue related to end users in Western Europe was EUR 64.8 (56.9) million, an increase of
13.8%.
The region reported all-time high revenue in the third quarter. The increase was primarily
driven by the casino product.
4%
10%
Italy reported all-time high revenue in the third quarter, with new record levels in both
turnover and deposits. The revenue increase was driven by the casino product.
30%
36%
20%
France reported increased revenue compared to the corresponding period last year but a
decrease compared to the previous quarter. The decrease compared to the previous quarter
was mainly driven by a lower sportsbook margin. Belgium reported decreased revenue both
compared to the corresponding period last year and the previous quarter. The decrease
compared to last year was driven by a lower sportsbook margin and a lower activity in the
casino product. At the end of the quarter, a rebranding was completed in Belgium from
betFIRST to Betsson, the Group’s flagship brand.
CEECA
Nordics 10%
Latin America 36%
Western Europe 20%
CEECA 30%
ROW 4%
Revenue related to end users in Central & Eastern Europe and Central Asia (CEECA) was EUR
99.2 (119.3) million, a decrease of 16.8%.
Revenue was negatively impacted in the third quarter by lower license revenue for system
delivery to B2B customers. The decline was driven by a decrease in activity for both the
sportsbook and casino products together with a lower sportsbook margin in the quarter.
The region’s B2C segment continued to perform well. Croatia, Georgia, Lithuania, Latvia
and Estonia reported increased revenue compared with the corresponding period of last
year, driven by the casino product.
Betsson AB (publ), interim report July-September 2026
6
2026/Q3
Latin America
Revenue related to end users in Latin America was EUR 116.1 (76.5) million, an increase of
51.8%.
Latin America reported all-time high revenue in the third quarter. The year-on-year increase
was driven by strong underlying activity with strong growth in both casino and sportsbook.
The region reported new record levels across casino revenue, deposits and casino turnover.
Argentina, Peru and Colombia reported strong growth in the third quarter. The growth was
driven by solid performance across both the casino product and the sportsbook product.
ROW, Rest of the world
Revenue from the rest of the world (RoW) was EUR 13.7 (6.6) million, an increase of 106.0%.
The increased revenue in the region was driven by the acquisition of Rhino Entertainment.
The acquisition was consolidated as of August. The region’s growth in the quarter was
primarily driven by Canada.
MARKET DEVELOPMENT BY PRODUCT
Casino
Betsson’s casino product includes a wide range of suppliers and diverse content, customised
for a growing global portfolio of markets and brands. The aim is to provide relevant content
for each individual region by using off-the-shelf games, as well as the Group’s exclusive
titles.
Revenue by product
During the quarter, Betsson’s offering expanded with 478 new casino games, 40 of which
came with a period of exclusivity for the Group’s brands.
1%
Betsson has strong, regionally customized offerings in live casino on the market and
continuously invests in improvements of the customer experience to strengthen the market
position in this segment.
22%
Casino gross turnover in all of Betsson’s gaming solutions was EUR 9,481.5 (8,860.2) million,
an increase of 7.0% compared to the third quarter last year.
Casino revenue amounted to EUR 253.5 (223.0) million, an increase of 13.7%. Casino
represented 77% (75%) of Group revenue.
77%
Sportsbook
Sportsbook gross turnover across all Betsson’s gaming solutions was EUR 1,365.6 (1,263.2)
million and corresponds to an increase of 8.1% compared to the third quarter of last year.
Sportsbook 22%
Sportsbook revenue in the quarter was EUR 71.8 (71.2) million, an increase of 0.8%.
Sportsbook represented 22% (24%) of Group revenue.
Other 1%
The sportsbook margin was 8.1% (8.8%). The eight-quarter rolling average margin was 9.0%.
Casino 77%
Other products
Revenue from other products (poker, bingo and other) amounted to EUR 1.3 (1.5) million,
representing 1% (1%) of total revenue.
Betsson AB (publ), interim report July-September 2026
7
2026/Q3
FINANCIAL DEVELOPMENT
Group revenue
Group revenue was EUR 326.5 (295.8) million, an increase of 10.4%. In constant currencies
and adjusted for acquisitions (organic), revenue growth was 8.1%. The acquisition of Rhino
Entertainment was consolidated as of August.
Revenue by quarter
350
300
MEUR
250
200
150
100
50
0
Q1
Q2
Q3
2022
Q4
Q1
Q2
Q3
2023
Q4
Q1
Q2
Q3
2024
Q4
Q1
Q2
Q3
2025
Q4
Q1
Q2
Q3
2026
Revenue from locally regulated markets increased by 35% and was EUR 253.8 (188.6) million,
corresponding to 77.7% (63.8%) of total Group revenue.
License revenue for system delivery to B2B customers amounted to EUR 46.7 (76.9) million
and corresponded to 14% (26%) of Group revenue. The decreased license revenue compared
to the corresponding period last year is mainly explained by lower revenue for one of the
B2B customers in the quarter. The decrease compared to the previous quarter is mainly
driven by a lower sportsbook margin.
Expenses
Cost of services provided was EUR 145.4 (106.0) million in the quarter. The increased cost
of services is mainly due to higher gaming taxes and higher costs for payment providers.
Gross Profit (MEUR)
-5%
189.8
181.1
Gross profit was EUR 181.1 (189.8) million, corresponding to a gross profit margin of 55.5%
(64.2%).
Operating expenses were EUR 135.0 (122.9) million and split according to the description
below.
Marketing expenses (excluding affiliate- and partner commissions) were EUR 41.6 (34.4)
million and represented 15% (16%) of B2C revenue. The increased marketing expenses are
driven by increased market activities in Latin America.
Q3 2025
Q3 2026
Personnel expenses amounted to EUR 49.8 (48.5) million. The average number of full-time
employees in the Group during the quarter was 2,913 (2,801) of which 1,556 (1,476) were
based in Malta. The increase in personnel expenses comes from an increased number of
employees, annual salary revisions and continued investments in product and platform
development.
The Group had 199 (230) full-time consultants engaged by the end of the quarter, mainly
within product development. These costs are recognised under other external expenses.
Other external expenses, which primarily include sportsbook-related costs, consultants and
software licenses, were EUR 42.3 (36.3) million. The increased costs were mainly due to
increased costs for cloud technologies and software licenses. Also, the acquisition of Rhino
Entertainment contributed to the increased cost in the quarter.
Capitalised development costs were EUR 14.2 (11.1) million. Amortisation of capitalised
development costs was EUR 11.4 (8.1) million. The capitalised development costs increased
due to more initiatives in product and technology development.
Total amortisation and depreciation for the quarter was EUR 17.3 (15.7) million.
Other operating income/-expenses were EUR 1.7 (0.9) million. These operating incomes/expenses mainly consist of gains/losses from foreign currency effects and gains/losses from
divestments of assets.
Betsson AB (publ), interim report July-September 2026
8
2026/Q3
Expenses as a percentage of total revenue
90%
8.1%
80%
10.1%
70%
5.1%
60%
10.9%
9.7%
5.4%
5.7%
15.4%
14.6%
50%
17.0%
40%
11.4%
5.3%
8.2%
5.3%
13.8%
16.4%
11.6%
11.6%
15.2%
12.7%
30%
44.5%
20%
33.2%
34.1%
36.2%
35.8%
Q3 2022
Q3 2023
Q3 2024
Q3 2025
Personnel expenses
Depr & Amort
10%
0%
Cost of services
EBIT (MEUR)
Marketing expenses
Q3 2026
Other
Operating income and net income
Operating income (EBIT) decreased by 31.1% to EUR 46.1 (66.9) million. The EBIT margin
was 14.1% (22.6%). Organically, EBIT decreased by 33.0% to EUR 44.8 million.
-31%
Operating income (EBIT) by quarter
80
66.9
25%
70
20%
60
MEUR
46.1
50
15%
40
10%
30
20
Q3 2025
Q3 2026
5%
10
0
0%
Q1
Q2
Q3
2022
Q4
Q1
Q2
Q3
Q4
Q1
2023
Q2
Q3
2024
Operating Income (EBIT)
Q4
Q1
Q2
Q3
2025
Q4
Q1
Q2
Q3
2026
EBIT margin
Net financial items were EUR -5.2 (-2.5) million. The net financial items mainly consist of
interest expenses and currency fluctuations. The higher cost compared to the corresponding
period last year is driven by unrealized foreign-exchange losses on intercompany loans.
Net income was EUR 28.2 (50.1) million and earnings per share were EUR 0.19 (0.34).
The reported corporate tax for the third quarter was EUR -12.7 (-14.2) million,
corresponding to 31.1% (22.3%) of income before taxes. The effective tax rate may fluctuate
between quarters depending on the tax base in the countries where Betsson has subsidiaries.
For example, corporate taxes in certain countries are based on dividend distribution which
may result in a difference between the effective and statutory tax rate.
Earnings for the nine-month period
Operating income (EBIT) for the first nine months of 2026 amounted to EUR 122.3 (199.9)
million. Net income amounted to EUR 84.1 (147.5) million, corresponding to EUR 0.59 (1.04)
per share.
Betsson AB (publ), interim report July-September 2026
9
2026/Q3
Financial position
Cash and cash equivalents amounted to EUR 284.7 (394.2) million at the end of the period.
Customer balances and reserves for accumulated jackpots were EUR 48.5 (54.1) million.
Gaming regulations require the Group to reserve a certain share of cash to cover customer
balances and accumulated jackpots. Current receivables related to payment service
providers for unsettled customer deposits were EUR 53.5 (44.9) million. The Group’s net
financial debt amounted to EUR -98.3 (-220.0) million at the end of the period.
Cash flow
Cash flow from operating activities during the third quarter was EUR 54.5 (64.8) million
including a positive impact of EUR 4.3 (-15.6) million from a decrease in working capital.
The positive effect on working capital is mainly driven by decreased payment provider
balances. Cash flow from investing activities was EUR -74.6 (12.4) million and is mainly
driven by the acquisition of Rhino Entertainment and investments in own product and
technology development. Cash flow from financing activities was EUR -4.4 (-7.8) million,
primarily driven by dividend paid to shareholders with non-controlling interest and lease
payments.
External financing
The external financing at the end of the period consisted of bonds amounting to EUR 173.8
million. The outstanding bonds have a tenor of three years and a floating interest rate of 3
months EURIBOR plus 325 basis points for the bonds in series 2024/2027 and a tenor of four
years with a floating interest rate of 3 months EURIBOR plus 275 basis points for the bonds
in series 2025/2029. In July, Betsson signed a long-term multi-currency revolving credit
facility (RCF) of EUR 75 million. The credit facility was undrawn at the end of the quarter.
External financing
Amount
Coupon rate
Maturity date
Bond 2024/2027 (MEUR)
99.6
EURIBOR 3M + 3.25%
Sep, 2027
Bond 2025/2029 (MEUR)
74.2
EURIBOR 3M + 2.75%
Dec, 2029
Equity
Equity in the Group was EUR 857.2 (877.0) million at the end of the period, corresponding
to EUR 6.45 (6.43) per share.
RISKS
The risk areas that Betsson has identified as most significant and which can significantly
affect the Group's operations, earnings and position are strategic risks, operational risks,
compliance risks and financial risks. These risk areas are described in more detail in the
latest annual report.
REGULATORY UPDATE
Betsson has gaming licenses in 22 countries and is thus affected by gaming laws that vary
significantly between different jurisdictions. Below is a short regulatory update regarding
changes on markets that are relevant to the Group.
European Union
Discussions continue regarding a proposed EU-wide levy on online gambling operators as a
potential new source of EU budget revenue under the 2028-2034 Multiannual Financial
Framework. The European Commission has estimated that a 3 percent levy on the online
gambling sector could generate approximately €1.9 billion annually. However, the proposal
remains at an early legislative stage and would require unanimous approval by all EU
Member States. Several industry stakeholders, including the European Gaming and Betting
Association (EGBA), have opposed the measure, and Malta has publicly indicated it may veto
any such proposal. Accordingly, the likelihood and final structure of any EU-wide gambling
levy remain uncertain.
Western Europe
Belgium adopted a new Royal Decree governing betting activities through newsagents,
effective from 14 September 2026. The decree reinstates a regulatory framework for
newsagents offering betting as an ancillary activity and imposes various restrictions.
Betsson AB (publ), interim report July-September 2026
10
2026/Q3
The Group’s subsidiary Zecure Gaming Ltd resolved to exit the German market and in August
the regulator GGL confirmed that the license had expired on 3 July 2026.
Central and Eastern Europe and Central Asia (CEECA)
In Lithuania, parliamentary proposals to increase gambling taxes remain under
consideration but have not progressed. A legislative proposal would increase the gambling
tax rate from 22 percent to 30 percent and raise various licence fees. However, the Ministry
of Finance has recommended that the government reject the measures, citing the
significant regulatory and fiscal burden already imposed on operators through recent
reforms.
Latin America
In Argentina, on 8 September 2026, Buenos Aires Province confirmed the enforcement of a
2 percent tax on winnings from online instant-win games, applicable to the province’s
licensed online gambling operators. The measure took immediate effect, with revenues
earmarked for social programmes, including initiatives addressing problem gambling. The
measure is currently under administrative appeal, and operators have requested an
extension of the implementation deadline.
On 25 September 2026, Brazilian President Luiz Inácio Lula da Silva issued an immediate
ban on all online gambling, including online casino and sports betting. Operators were
required to cease accepting deposits immediately and wind down operations, although the
measure remains subject to congressional approval within 120 days to remain in force.
Meanwhile parallel constitutional challenges before the Federal Supreme Court seek to
suspend the measure and preserve existing licences. A timely judicial intervention therefore
remains critical, as all existing authorisations are scheduled to expire on 25 October 2026
unless the measure is suspended or otherwise modified before that date. The Group’s local
subsidiary has suspended new customer registrations and deposits, and has ceased all
advertising, marketing and sponsorship activities. At the reporting date, significant
uncertainty remains regarding the long-term viability of Brazil’s recently launched
regulated online gambling market.
Chile’s online gambling bill remains under parliamentary consideration, with no licensing
framework yet in force. Meanwhile, enforcement against unlicensed operators has
intensified: following court orders, telecom regulator Subtel has continued blocking access
to unauthorised gambling websites. Separately, the tax authority has introduced a digital
VAT of 19 percent registration regime for foreign online gambling operators. 39 operators,
including Betsson, had registered for VAT purposes, while enforcement measures, including
withholding obligations on payment providers for non-registered operators, were
implemented. This creates an unusual interim situation in which offshore operators may be
subject to Chilean VAT obligations while remaining exposed to website-blocking measures
pending enactment of a dedicated licensing regime.
SUSTAINABILITY
Sustainability is an integrated part of Betsson's business strategy and a prerequisite for
generating shareholder value and at the same time taking long-term responsibility for
customers, employees, and the communities in which the Group operates. The Group is a
participant in the UN Global Compact, is a Nasdaq ESG transparency partner, and was
awarded the Malta Gaming Authority (MGA) ESG Seal for the second consecutive year, in
recognition of the Group’s commitment to transparency and responsible business practices
aligned with the MGA ESG Code of Good Practice. Betsson's sustainability framework
establishes five focus areas: responsible gaming, ethics and business compliance, employee
impact, social impact and climate impact. For more details on Betsson’s ESG efforts, see
the 2025 annual report, including the CSRD-compliant sustainability statement, which is
available on the Company's website https://www.betssonab.com
Betsson AB (publ), interim report July-September 2026
11
2026/Q3
Responsible gaming
88.5%
Share of active customers with
activated tools for responsible
gaming
Betsson's ambition is to be a role model in the industry and to create conditions for players
to maintain a healthy relationship to gaming. Betsson continuously works to support
customers in staying in control of their gaming and to identify and assist customers at risk
of developing gaming-related problems. Betsson offers a wide range of responsible gaming
tools, as well as access to well-trained and professional customer service 24 hours a day,
seven days a week. Betsson's customer service is regularly assessed by independent
evaluators for quality and service standards, and Betsson has received numerous awards in
recognition of its efforts in the field of responsible gaming and customer service.
During the quarter, Betsson’s operations underwent external assessments and review
activities. These reviews serve to ensure that the player protection measures remain aligned
with evolving industry standards and regulatory expectations.
During the quarter, the operations in Belgium were migrated to the Group’s proprietary
technology platform. A more unified platform supports the consistent implementation of
Responsible Gaming tools, controls and governance processes across markets.
23 747
Customers analysed for
potentially risky gaming
All Betsson customers receive information about responsible gambling and the tools
available to them. In Q3, 88.5 (85.3) percent of active customers had some form of
responsible gaming tool activated. This measurement includes any of the available tools
such as reality checks, self-assessment tests, deposit and time limits etc. In the quarter,
24.8 (34.2) percent of active customers used deposit limits. These numbers vary between
markets and depend on the geographic customer mix during the quarter since the usage of
control tools can be different between markets depending on local regulations and customer
preferences.
Betsson uses a number of automated systems and manual controls to monitor customers,
among other things, through the Company’s proprietary responsible gaming prediction tool.
If a customer exhibits potentially risky behaviour according to certain established
parameters, an individual assessment is made, based on the customer’s profile and gaming
activity. 23,747 (16,810) customers were manually analysed during the quarter. Betsson
then uses a wide spectrum of follow-up actions, for example by providing the player with
more information about safer gaming or asking the customer to respond to a set of
questions, encouraging the customer to set deposit limits or to take a timeout. Betsson can
also exclude customers from continued gaming. During the quarter, 2.7 (2.8) percent of
customers self-excluded for a period longer than six months.
Ethics and business compliance
Betsson’s way of conducting business should support a strong corporate reputation in the
industry. Betsson holds gaming licenses in many different jurisdictions with significantly
varied laws and regulations. To ensure long-term sustainable operations and profitability,
compliance with laws, regulations and ethical standards in these jurisdictions is crucial.
Betsson publishes summaries of key policies on the Betsson AB website:
https://www.betssonab.com/governance/corporate-policies
During the quarter, Betsson strengthened its whistleblowing framework through a review of
local procedures, reporting channels and governance controls. The work reinforced
confidentiality, protection against retaliation, investigation processes and escalation
procedures, supporting a culture where employees and stakeholders can raise concerns with
integrity and confidence.
During the quarter, an independent review of Betsson's Anti-Corruption Framework,
supported by EY, progressed. The review assesses the design and effectiveness of controls
intended to prevent, detect and address bribery and corruption, supporting the Group's
continued focus on ethical business conduct.
Betsson has also implemented a new internally developed solution to support jurisdictional
risk assessments. The tool strengthens the efficiency and consistency of geographic risk
analysis and supports the application of appropriate controls relating to customer risk,
sanctions and country-specific risks.
During the quarter, Betsson launched an enhanced Group-wide compliance risk assessment
process. The solution provides a more consistent and traceable view of compliance risks
across jurisdictions by bringing together regulatory, financial crime, audit and incident
information to support risk-informed decision-making.
Betsson AB (publ), interim report July-September 2026
12
2026/Q3
During the quarter, Betsson continued to strengthen its information security framework
through enhanced governance, security awareness initiatives and employee training.
Activities included targeted awareness campaigns, phishing simulations and face-to-face
training sessions aimed at increasing employees’ ability to identify and respond to cyber
threats. The Group also achieved a 97.6 percent maturity rating in an external assessment
performed by BDO against ISO 27001 control requirements, reflecting continued
improvement in its information security capabilities.
Employee Impact
Betsson’s ambition is to be the employer of choice – the first choice for current as well as
potential new employees. Attracting and retaining talent with the right skills and mindset,
as well as developing and training staff, are key components of Betsson’s winning concept
and the reason why Talented People is the first pillar in the Group’s business strategy.
During the quarter, Betsson launched an AI-powered HR assistant that provides Malta
employees with easier access to HR information, policies and support. The initiative aims
to enhance the employee experience by improving access to information and streamlining
routine HR enquiries. Following evaluation of the initial rollout, Betsson may expand the
solution to additional markets.
During the quarter, Betsson opened a new technology hub in Málaga, Spain. The new office
expands opportunities for attracting and retaining talent while providing employees with a
modern and collaborative work environment. The investment supports Betsson's continued
growth and strengthens its ability to attract technology professionals from across Europe.
In September, Betsson employees participated in Malta Pride 2026, including companyorganised events and the Pride March in Valletta. The initiative reflects Betsson's
commitment to fostering an inclusive workplace where employees are encouraged to be
themselves and can feel respected, valued and supported regardless of background or
identity.
Social Impact
Betsson strives to have a positive impact on society. The Group’s social impact framework
has three focus areas: sports, diversity, and environment. At the same time, Betsson adapts
its efforts to respond to global events and has provided continuous humanitarian support to
Ukraine since 2022.
During the quarter, the Betsson Foundation was launched, a registered public benefit
foundation that consolidates the Group’s charitable, community and sports-related
initiatives under one organisation. The Foundation will coordinate and develop social impact
activities across Betsson’s markets, supporting long-term partnerships and strengthening
the effectiveness and reach of community engagement initiatives.
Read more about the Foundation:
launches-betsson-foundation/
110%
Betsson compensates for
emissions and adds an
additional 10% on top
https://betssongroup.com/news/betsson-group-
Following the earthquake in Colombia in August, Betsson provided immediate support
through a donation to ABACO, a local organisation providing food, drinking water and other
emergency assistance on the ground. Betsson also joined the relief initiative coordinated
by Fecoljuegos, the Colombian gambling industry association, demonstrating solidarity with
victims, their families and local communities in Colombia.
Read
more
about
Betsson’s
sustainability/community/
commitment
https://betssongroup.com/esg-
Climate Impact
Betsson operates in an industry with relatively low CO2 emissions but nevertheless has a
responsibility to help counteract climate change. As Betsson’s business is mainly conducted
online, a large part of the climate impact comes from employees’ business travel and
electricity use in customers’ gaming units.
Betsson has set Science-Based Targets (SBT) for reducing greenhouse gases by at least 55
percent for Scope 1 and 2 and by at least 15 percent for Scope 3 by 2030. Betsson offsets
its emissions, including estimated emissions by customers’ gaming units when playing on
Betsson brands, by purchasing reduction units in verified projects.
Betsson AB (publ), interim report July-September 2026
13
2026/Q3
Betsson holds ISO 14001 and ISO 50001 certifications for the Group's Italian operations,
which cover the Malta offices, which is the Group's largest operating unit. The values
underpinning these certifications are well embedded throughout the organisation, and the
Group continuously works to improve its performance in both environmental and energy
related areas.
OTHER INFORMATION
EMPLOYEES
At the end of the quarter, the Group employed 2,925 (2,906) employees representing around
70 different nationalities. In addition, 199 (230) full-time consultants were engaged, mainly
in product development.
Betsson’s corporate values - One Betsson, Passion and Fair Play - set the tone for how
employees should treat each other, customers, suppliers and other stakeholders, and for
how employees should approach their work and assignments. Betsson's ambition is to be the
best workplace in the industry. Diversity and equal opportunities are key elements and are
included as a natural part of an innovative corporate culture. Skilled and engaged
employees are a prerequisite to achieving the vision of providing the best customer
experience in the industry.
The Group has, over time, retained people in leading positions, enabling consistent delivery
according to its long-term strategy. To further inspire and support employees, leadership
programmes, career development and other initiatives are offered and promoted to them.
OWNERSHIP STRUCTURE AND SHARES OUTSTANDING
The Company’s Series B shares are listed on Nasdaq Stockholm Large Cap list (BETS B). At
the end of the period, the Company had 37,813 (39,051) shareholders.
The total number of shares and votes in Betsson amounts to 139,635,838 and 274,941,838
respectively, divided into 15,034,000 A-shares with ten votes each, 121,854,405 B-shares
with one vote each and 2,747,433 C-shares with one vote each. The C-shares may not be
represented at general meetings of shareholders. Betsson’s treasury shares amounted to
2,747,433 C-shares and 1,583,123 B-shares at the end of the period.
PARENT COMPANY
The Parent Company Betsson AB’s (publ) business consists of investing in and administering
shareholdings in companies, which, through partners or by themselves, offer games and
sports betting to end users online. The Company provides and sells internal services related
to financing, communication, accounting, and administration to certain Group companies.
Revenue in the Parent Company for the third quarter was EUR 0.9 (0.8) million, and net
income was EUR -34.5 (-6.9) million.
Cash and cash equivalents in the Parent Company amounted to EUR 28.6 (85.2) million.
ANNUAL GENERAL MEETING 2027
Betsson AB’s Annual General Meeting (AGM) 2027 will be held on Tuesday, 4 May 2027, in
Stockholm. For more information, please visit https://www.betssonab.com/en/generalmeetings
NOMINATION COMMITTEE
The Nomination Committee of Betsson AB currently consists of the following members:
•
Jenny Rosberg, appointed by Hamberg Förvaltning AB
•
Michael Knutsson, appointed by Knutsson Holdings AB
•
Ingela Kling, appointed by the Kling family
Stockholm, 22 October 2026
Pontus Lindwall
President and CEO
Betsson AB (publ), interim report July-September 2026
14
2026/Q3
AUDITOR’S REPORT
To the Board of Betsson AB (publ) reg. no. 556090-4251.
INTRODUCTION
We have conducted a limited review of the condensed interim financial information (interim
report) for Betsson AB (Publ) per 30 September 2026, and the nine-month period ending on
that date. The board of directors and the managing director are responsible for preparing
and presenting this interim report in accordance with IAS 34 and the Swedish Annual
Accounts Act. Our responsibility is to express a conclusion on this interim report based on
our limited review.
THE FOCUS AND SCOPE OF THE LIMITED REVIEW
We have conducted our limited review in accordance with the International Standard on
Review Engagements ISRE 2410, "Review of Interim Financial Information Performed by the
Independent Auditor of the Entity." A limited review consists of making inquiries, primarily
of persons responsible for financial and accounting matters, performing analytical
procedures, and other review procedures. A limited review has a different focus and a
significantly smaller scope compared to the focus and scope of an audit conducted in
accordance with ISA and generally accepted auditing standards. The review procedures
taken in a limited review do not enable us to obtain the assurance that we would become
aware of all significant matters that might have been identified in an audit. Therefore, the
conclusion expressed based on a limited review does not have the assurance that a
conclusion expressed based on an audit has.
CONCLUSION
Based on our limited review, nothing has come to our attention that causes us to believe
that the interim report is not, in all material respects, prepared for the group in accordance
with IAS 34 and the Annual Accounts Act and for the parent company in accordance with
the Annual Accounts Act.
Stockholm, 22 October 2026
Öhrlings PricewaterhouseCoopers AB
Aleksander Lyckow
Authorized Public Accountant
Betsson AB (publ), interim report July-September 2026
15
2026/Q3
CONSOLIDATED INCOME STATEMENT
MEUR
Q3 26
Q3 25
Jan-Sep 26
Jan-Sep 25
Jan-Dec 25
Revenue
326.5
295.8
922.1
893.1
1,197.0
Cost of services provided
-145.4
-106.0
-399.1
-321.5
-441.5
Gross profit
181.1
189.8
523.0
571.6
755.5
Marketing expenses
-41.6
-34.4
-120.9
-108.3
-147.1
Personnel expenses
-49.8
-48.5
-146.3
-138.8
-190.7
Other external expenses
-42.3
-36.3
-122.9
-109.3
-147.0
Capitalised development costs
14.2
11.1
38.9
30.1
41.6
Amortisation and depreciation
-17.3
-15.7
-49.5
-44.5
-60.5
1.7
0.9
-0.0
-0.8
1.3
Operating expenses
-135.0
-122.9
-400.7
-371.7
-502.3
Operating income
46.1
66.9
122.3
199.9
253.1
Other operating income/expenses
Financial income and expenses
-5.2
-2.5
-7.0
-10.0
-17.6
Income before tax
40.9
64.4
115.3
189.9
235.5
Tax
-12.7
-14.2
-31.2
-42.4
-53.1
Net income
28.2
50.1
84.1
147.5
182.4
26.3
47.6
79.9
144.7
177.4
1.9
2.5
4.1
2.8
5.1
Net income attributable to:
Equity holders of the Parent Company
Non-controlling interests
CONSOLIDATED STATEMENT OF COMPREHENSIVE INCOME
MEUR
Q3 26
Q3 25
Jan-Sep 26
Jan-Sep 25
Jan-Dec 25
Net income
28.2
50.1
84.1
147.5
182.4
Other comprehensive income
Revenue/expenses recognised directly in equity:
Exchange differences in translating foreign operations
-0.5
-0.8
1.5
-14.5
-18.3
Other comprehensive income of the period
-0.5
-0.8
1.5
-14.5
-18.3
Total comprehensive income for the period
27.7
49.3
85.6
133.0
164.1
Equity holders of the Parent Company
26.4
46.5
81.6
130.2
159.0
Non-controlling interests
1.3
2.8
4.0
2.8
5.1
Total comprehensive income attributable to:
Betsson AB (publ), interim report July-September 2026
16
2026/Q3
CONSOLIDATED BALANCE SHEET
MEUR
30 Sep 26
30 Sep 25
31 Dec 25
814.2
736.7
744.9
Assets
Intangible fixed assets
Property, plant and equipment
8.8
7.7
7.9
Right-of-use assets
27.9
11.3
15.5
Financial assets
42.4
20.3
14.3
Deferred tax receivables
17.1
15.8
9.1
Total non-current assets
910.5
791.9
791.7
Current receivables
210.4
276.4
213.7
Cash and cash equivalents
284.7
394.2
322.7
Total current assets
495.1
670.6
536.4
1,405.6
1,462.5
1,328.0
857.2
877.0
894.0
Total assets
Equity and liabilities
Equity
Deferred tax liabilities
12.8
14.3
10.9
Bond
74.2
99.1
173.2
Lease liabilities
23.7
5.7
11.0
110.7
119.1
195.1
Bond
99.6
71.0
Lease liabilities
4.2
4.6
4.3
Total non-current liabilities
Other current liabilities
Total current liabilities
Total equity and liabilities
Betsson AB (publ), interim report July-September 2026
333.9
390.7
234.5
437.7
466.3
238.8
1,405.6
1,462.5
1,328.0
17
2026/Q3
CONSOLIDATED CASH FLOW STATEMENT
MEUR
Q3 26
Q3 25
Jan-Sep 26
Jan-Sep 25
Jan-Dec 25
Income before tax
40.9
64.4
115.3
189.9
235.5
Adjustments for non-cash items
16.5
20.1
50.6
54.0
76.4
Taxes paid
Cash flow from operating activities before changes in
working capital
Changes in working capital
-7.2
-4.1
-35.4
-35.2
-50.4
50.2
80.4
130.5
208.7
261.5
4.3
-15.6
42.4
-16.4
-45.9
Cash flow from operating activities
54.5
64.8
173.0
192.3
215.6
Investments in intangibles/tangibles
-15.8
-12.4
-44.5
-36.8
-64.6
Acquisition of shares in subsidiaries
-58.8
24.8
-58.9
21.0
21.0
Acquisition of shares in associates
-5.1
-5.1
Paid earnout
-3.4
-3.4
-74.6
12.4
-103.4
-24.3
-52.1
Repurchase of own shares
-27.5
-12.5
Bond issue
74.2
Bond redemption
-3.6
-76.7
Cash flow from investing activities
External loans
-20.0
Lease payments
-1.6
-2.1
-6.5
-6.2
-8.3
Loan Associates
-0.3
-0.6
-1.9
-1.0
-2.2
-44.5
-59.3
-104.8
-0.4
Dividend
Warrant premiums received
-2.2
-2.2
Dividend paid to non-controlling interests
-2.5
-2.9
-7.3
-4.9
-7.4
Cash flow from financing activities
-4.4
-7.8
-107.7
-77.2
-138.1
Changes to cash and cash equivalents
-24.6
69.4
-38.1
90.8
25.4
Cash and cash equivalents at beginning of period
310.0
327.0
322.7
308.5
308.5
Exchange differences
-0.6
-2.3
0.2
-5.0
-11.2
284.7
394.2
284.7
394.2
322.7
30 Sep 26
30 Sep 25
31 Dec 25
905.6
869.1
869.1
Cash and cash equivalents at end of period
CHANGES IN GROUP EQUITY
MEUR
Equity opening balance attributable to the Equity holders of the Parent Company
Total comprehensive income attributable to Equity holders of the parent company
81.6
130.2
159.0
Total change excluding owner transactions
81.6
130.2
159.0
Dividend
-88.9
-104.8
-104.8
Repurchase of own shares
-27.5
-12.5
1.3
0.3
3.0
Share-based program
Reclassification of minorities
-9.0
-8.3
872.1
885.8
905.6
Equity holders of the Parent Company
872.1
885.8
905.6
Non-controlling interests
-14.9
-8.8
-11.5
Total equity at end of period
857.2
877.0
894.0
Equity at end of period attributable to the Equity holders of the Parent Company
Equity attributable to:
Betsson AB (publ), interim report July-September 2026
18
2026/Q3
PARENT COMPANY, INCOME STATEMENT
MEUR
Q3 26
Q3 25
Jan-Sep 26
Jan-Sep 25
Jan-Dec 25
Revenue
0.9
0.8
2.2
2.2
3.2
Operating expenses
-2.6
-5.0
-8.4
-11.1
-16.7
Operating income
-1.6
-4.2
-6.3
-8.9
-13.5
Financial income and expenses
-32.9
-2.8
-37.0
-8.4
160.7
Income before tax
-34.5
-6.9
-43.2
-17.3
147.2
Income tax
-7.0
-12.1
Net income
-34.5
-6.9
-43.2
-24.2
135.1
30 Sep 26
30 Sep 25
31 Dec 25
PARENT COMPANY, BALANCE SHEET
MEUR
Assets
Property, plant and equipment
0.1
0.1
0.1
Financial assets
708.4
596.8
598.4
Total non-current assets
708.5
596.9
598.6
Current receivables
253.8
294.7
418.0
Cash and cash equivalents
28.6
85.2
89.0
Total current assets
282.5
380.0
507.1
Total assets
991.0
976.9
1,105.6
34.6
34.6
34.6
Equity and liabilities
Restricted equity
Unrestricted equity
685.9
694.6
844.3
Total equity
720.5
729.2
878.9
Bond
74.2
99.1
173.2
Total non-current liabilities
74.2
99.1
173.2
Bond
Other current liabilities
99.6
96.8
71.0
77.6
53.5
Total current liabilities
196.3
148.6
53.5
Total equity and liabilities
991.0
976.9
1,105.6
Betsson AB (publ), interim report July-September 2026
19
2026/Q3
QUARTERLY DATA
CONSOLIDATED INCOME STATEMENT, IN SUMMARY
MEUR
2026
2026
2026
2025
2025
2025
2025
2024
Q3
Q2
Q1
Q4
Q3
Q2
Q1
Q4
Revenue
326.5
310.2
285.3
303.9
295.8
303.7
293.7
306.8
Cost of services provided
-145.4
-132.7
-121.0
-120.0
-106.0
-109.8
-105.8
-106.5
Gross profit
181.1
177.5
164.4
183.9
189.8
193.9
187.9
200.3
Marketing expenses
-41.6
-41.4
-37.8
-38.7
-34.4
-37.4
-36.5
-41.6
Personnel expenses
-49.8
-49.7
-46.8
-51.9
-48.5
-46.6
-43.7
-45.0
Other external expenses
-42.3
-40.1
-40.5
-37.6
-36.3
-35.3
-37.7
-38.1
Capitalised development costs
14.2
12.5
12.2
11.6
11.1
10.2
8.8
8.1
Amortisation and depreciation
-17.3
-16.3
-15.9
-16.1
-15.7
-15.1
-13.7
-16.2
1.7
-0.3
-1.4
2.1
0.9
-0.8
-1.0
2.7
Operating expenses
-135.0
-135.3
-130.3
-130.6
-122.9
-124.9
-123.9
-130.0
Operating income
46.1
42.2
34.0
53.2
66.9
69.0
64.0
70.2
Other operating income/expenses
Financial items, net
-5.2
-0.8
-1.0
-7.6
-2.5
-5.3
-2.2
-4.8
Income before tax
40.9
41.4
33.1
45.6
64.4
63.7
61.8
65.4
Tax
-12.7
-11.0
-7.5
-10.7
-14.2
-14.6
-13.4
-12.3
Net income
28.2
30.4
25.5
35.0
50.1
49.2
48.4
53.1
CONSOLIDATED BALANCE SHEET, IN SUMMARY
2026
2026
2026
2025
2025
2025
2025
2024
Q3
Q2
Q1
Q4
Q3
Q2
Q1
Q4
Non-current assets
910.5
828.3
801.2
791.7
791.9
797.2
797.4
788.5
Current assets
495.1
525.5
551.3
536.4
670.6
598.9
634.2
578.8
Total assets
1,405.6
1,353.7
1,352.5
1,328.0
1,462.5
1,396.1
1,431.6
1,367.2
Equity
857.2
830.6
899.0
894.0
877.0
836.2
901.9
857.7
Provisions and non-current liabilities
110.7
203.1
200.9
195.1
119.1
191.3
193.5
191.8
Current liabilities
437.7
320.0
252.6
238.8
466.3
368.6
336.2
317.7
1,405.6
1,353.7
1,352.5
1,328.0
1,462.5
1,396.1
1,431.6
1,367.2
MEUR
Total equity and liabilities
CONSOLIDATED CASH FLOW STATEMENT, IN SUMMARY
MEUR
2026
2026
2026
2025
2025
2025
2025
2024
Q3
Q2
Q1
Q4
Q3
Q2
Q1
Q4
Operating cash flow
54.5
60.4
58.1
23.1
64.8
41.1
86.4
84.6
Cash flow from investing activities
-74.6
-14.2
-14.6
-27.8
12.4
-13.9
-22.9
-24.5
-4.4
-77.9
-25.3
-60.9
-7.8
-65.6
-3.8
-89.6
-24.6
-31.7
18.1
-65.6
69.4
-38.3
59.7
-29.5
Cash flow from financing activities
Total cash flow
Betsson AB (publ), interim report July-September 2026
20
2026/Q3
KEY RATIOS
2026
2026
2026
2025
2025
2025
2025
2024
Q3
Q2
Q1
Q4
Q3
Q2
Q1
Q4
Gross Margin (% of revenue)
55.5
57.2
57.6
60.5
64.2
63.9
64.0
65.3
EBITDA-margin (% of revenue)
19.4
18.8
17.5
22.8
27.9
27.7
26.5
28.2
EBIT-margin (% of revenue)
14.1
13.6
11.9
17.5
22.6
22.7
21.8
22.9
Profit margin (% of revenue)
12.5
13.4
11.6
15.0
21.8
21.0
21.0
21.3
Marketing expenses (% of revenue)
12.7
13.4
13.3
12.7
11.6
12.3
12.4
13.5
Earnings per share (EUR)
0.19
0.22
0.18
0.24
0.34
0.36
0.35
0.38
Diluted earnings per share (EUR)
0.19
0.21
0.18
0.24
0.34
0.35
0.34
0.37
Equity per share (EUR)
6.45
6.24
6.73
6.44
6.43
6.16
6.64
6.32
Executed dividend/redemption per share (EUR)
0.00
0.33
0.00
0.32
0.00
0.43
0.00
0.32
Equity/assets ratio (%)
61
61
66
67
60
60
63
63
Return on equity (%, 12 months)
13
16
17
20
23
22
21
22
Return on total capital (%, 12 months)
12
14
16
19
19
19
19
20
Key financial ratios
Return on capital employed (%, 12 months)
17
19
21
24
26
27
26
26
Net debt (MEUR)
-98
-128
-165
-158
-220
-152
-178
-140
Net debt / EBITDA (Multiple, 12 months)
-0.4
-0.5
-0.6
-0.5
-0.7
-0.5
-0.6
-0.4
92.55
91.82
102.89
146.00
166.45
176.57
154.40
137.95
The share
Average share price (SEK)
Share price at end of period (SEK)
95.35
84.70
100.20
147.70
155.30
199.90
155.54
143.60
Highest share price (SEK)
100.50
106.90
147.90
160.00
203.80
200.80
169.82
147.62
Lowest share price (SEK)
83.55
81.00
88.40
137.90
151.10
137.20
138.60
123.40
Number of shareholders at end of period
37,813
38,930
39,574
39,884
39,051
34,574
31,993
29,963
Number of shares outstanding at end of period
(million)
135.3
135.3
135.5
137.7
137.9
137.9
137.9
137.9
Total number of shares at end of period
(million)
139.6
139.6
142.7
142.7
142.7
142.7
142.7
142.7
Average number of employees
2,913
2,899
2,841
2,927
2,801
2,838
2,725
2,513
Number of employees at end of period
2,925
2,927
2,928
2,899
2,906
2,800
2,769
2,660
2026
2026
2026
2025
2025
2025
2025
2024
Q3
Q2
Q1
Q4
Q3
Q2
Q1
Q4
Personnel
CUSTOMERS
Active customers (000's)
Customer deposits, all gaming solutions (MEUR)
1,875
1,825
1,521
1,410
1,338
1,384
1,371
1,348
1,545.4
1,382.5
1,359.6
1,491.5
1,452.3
1,488.9
1,588.2
1,582.7
2026
2026
2026
2025
2025
2025
2025
2024
Q3
Q2
Q1
Q4
Q3
Q2
Q1
Q4
9,481.5
8,264.2
7,979.8
9,024.2
8,860.2
9,047.9
9,635.9
9,748.6
253.5
217.6
203.8
219.8
223.0
212.4
212.3
213.9
CASINO DATA
MEUR
Gross turnover, all gaming solutions
Revenue
Betsson AB (publ), interim report July-September 2026
21
2026/Q3
SPORTSBOOK DATA
2026
2026
2026
2025
2025
2025
2025
2024
Q3
Q2
Q1
Q4
Q3
Q2
Q1
Q4
Gross turnover, all gaming solutions (MEUR)
1,365.6
1,292.0
1,456.1
1,470.1
1,263.2
1,467.9
1,832.1
1,714.1
of which gross turnover live betting (MEUR)
759.8
712.8
834.7
964.6
626.9
855.9
1,062.4
1,035.5
Sportbook margin after free bets (%)
8.1
10.5
8.4
8.8
8.8
9.5
8.0
9.8
Revenue (MEUR)
71.8
91.3
80.2
82.7
71.2
90.0
79.7
91.3
2026
2026
2026
2025
2025
2025
2025
2024
Q3
Q2
Q1
Q4
Q3
Q2
Q1
Q4
Casino
253.5
217.6
203.8
219.8
223.0
212.4
212.3
213.9
Sportsbook
71.8
91.3
80.2
82.7
71.2
90.0
79.7
91.3
REVENUE BY PRODUCT
MEUR
Revenue
Other products
1.3
1.2
1.4
1.4
1.5
1.3
1.6
1.6
326.5
310.2
285.3
303.9
295.8
303.7
293.7
306.8
2026
2026
2026
2025
2025
2025
2025
2024
Q3
Q2
Q1
Q4
Q3
Q2
Q1
Q4
Casino
77
70
71
72
75
70
72
69
Sportsbook
22
29
28
27
24
29
27
30
Other products
1
1
1
1
1
1
1
1
2026
2026
2026
2025
2025
2025
2025
2024
Q3
Q2
Q1
Q4
Q3
Q2
Q1
Q4
Casino
16
7
-7
-1
5
0
-1
2
Sportsbook
Total
Share of total revenue (%)
Growth, compared with previous quarter (%)
-21
14
-3
16
-21
13
-13
34
Other products
4
-10
-4
-7
19
-21
1
-17
Total
5
9
-6
3
-3
3
-4
10
2026
2026
2026
2025
2025
2025
2025
2024
Q3
Q2
Q1
Q4
Q3
Q2
Q1
Q4
14
2
-4
3
6
11
18
17
Growth, compared with same period previous
year (%)
Casino
Sportsbook
1
1
1
-9
4
15
22
36
Other products
-16
-4
-16
-12
-21
-33
-25
-23
Total
10
2
-3
-1
6
12
18
22
2026
2026
2026
2025
2025
2025
2025
2024
Q3
Q2
Q1
Q4
Q3
Q2
Q1
Q4
Nordics
24.8
19.9
20.9
23.4
26.0
23.8
26.3
26.9
Latin America
84.9
72.6
63.2
60.2
56.6
51.4
52.2
51.1
Western Europe
54.3
49.9
47.9
48.4
45.7
45.1
41.6
39.0
Central & Eastern Europe and Central Asia
78.9
74.4
70.2
86.0
90.5
89.1
89.8
94.3
RoW
10.6
1.0
1.5
1.8
4.1
2.9
2.4
2.6
Total
253.5
217.6
203.8
219.8
223.0
212.4
212.3
213.9
REVENUE BY REGION
MEUR
Casino
Betsson AB (publ), interim report July-September 2026
22
2026/Q3
MEUR
2026
2026
2026
2025
2025
2025
2025
2024
Q3
Q2
Q1
Q4
Q3
Q2
Q1
Q4
Sportsbook
Nordics
7.6
7.9
10.2
9.9
9.8
9.7
11.0
12.6
Latin America
31.2
39.4
29.6
24.1
19.8
33.2
22.3
27.0
Western Europe
10.3
14.2
13.2
12.3
11.1
14.1
13.9
13.5
Central & Eastern Europe and Central Asia
19.6
25.5
24.7
33.7
28.0
28.4
31.7
37.1
RoW
3.1
4.2
2.4
2.8
2.5
4.6
0.8
1.1
Total
71.8
91.3
80.2
82.7
71.2
90.0
79.7
91.3
2026
2026
2026
2025
2025
2025
2025
2024
Q3
Q2
Q1
Q4
Q3
Q2
Q1
Q4
MEUR
Total, for all products, per region
Nordics
32.7
28.1
31.4
33.6
36.4
33.9
37.8
40.0
Latin America
116.1
112.1
93.0
84.3
76.5
84.7
74.5
78.2
Western Europe
64.8
64.2
61.3
60.8
56.9
59.3
55.6
52.7
Central & Eastern Europe and Central Asia
99.2
100.6
95.7
120.4
119.3
118.2
122.3
132.2
RoW
13.7
5.3
3.9
4.7
6.6
7.6
3.4
3.7
Total
326.5
310.2
285.3
303.9
295.8
303.7
293.7
306.8
2026
2026
2026
2025
2025
2025
2025
2024
Q3
Q2
Q1
Q4
Q3
Q2
Q1
Q4
Nordics
10
9
11
11
12
11
13
13
Latin America
36
36
33
28
26
28
25
26
Western Europe
20
21
21
20
19
20
19
17
Central & Eastern Europe and Central Asia
30
32
34
40
41
39
42
43
RoW
4
2
1
1
2
2
1
1
2026
2026
2026
2025
2025
2025
2025
2024
Q3
Q2
Q1
Q4
Q3
Q2
Q1
Q4
Nordics
17
-11
-6
-8
7
-11
-5
-12
Latin America
4
21
10
10
-10
14
-5
13
Western Europe
1
5
1
7
-4
7
6
18
Share per region (%)
Growth, compared with previous quarter (%)
Central & Eastern Europe and Central Asia
-1
5
-21
1
1
-3
-8
14
RoW
160
33
-15
-30
-13
127
-9
-16
2026
2026
2026
2025
2025
2025
2025
2024
Q3
Q2
Q1
Q4
Q3
Q2
Q1
Q4
Growth, compared with same period previous
year (%)
Nordics
-10
-17
-17
-16
-20
-28
-19
-14
Latin America
52
32
25
8
10
35
71
47
Western Europe
14
8
10
16
27
36
28
26
Central & Eastern Europe and Central Asia
-17
-15
-22
-9
3
4
11
24
RoW
106
-31
18
27
52
94
-15
0
Betsson AB (publ), interim report July-September 2026
23
2026/Q3
SPECIFICATION OF COST OF SERVICES PROVIDED
2026
2026
2026
2025
2025
2025
2025
2024
Q3
Q2
Q1
Q4
Q3
Q2
Q1
Q4
Licence fees
28.5
25.4
24.9
26.4
25.3
25.2
25.7
24.1
Betting duties
69.4
60.8
53.4
53.1
41.4
46.3
45.2
43.4
Affiliates and partners commission
13.1
12.8
11.9
12.6
12.1
11.9
9.5
12.9
Other cost of services provided
34.5
33.6
30.8
28.0
27.1
26.3
25.4
26.1
145.4
132.7
121.0
120.0
106.0
109.8
105.8
106.5
MEUR
Total
SPECIFICATION OF AMORTISATION AND DEPRECIATION
2026
2026
2026
2025
2025
2025
2025
2024
MEUR
Q3
Q2
Q1
Q4
Q3
Q2
Q1
Q4
Depreciation property, plant, and equipment
1.0
1.0
0.9
0.9
1.1
1.0
1.0
-0.2
Depreciation right-of-use assets
2.0
1.9
1.7
2.0
1.9
1.9
1.7
2.5
Amortisation intangible fixed assets
(whereof amortisation of capitalised
development costs)
Total
14.3
13.4
13.4
13.1
12.7
12.2
11.0
13.9
11.4
9.9
10.1
10.3
8.1
6.8
7.6
7.2
17.3
16.3
15.9
16.1
15.7
15.1
13.7
16.2
2026
2026
2026
2025
2025
2025
2025
2024
Q3
Q2
Q1
Q4
Q3
Q2
Q1
Q4
Reported revenues
326.5
310.2
285.3
303.9
295.8
303.7
293.7
306.8
- Revenue from acquisitions
-12.8
-2.0
-3.1
-4.1
-4.1
-1.2
ORGANIC CALCULATION
6.0
12.0
20.9
21.0
18.9
15.2
7.5
68.4
Organic revenues
319.7
322.2
306.2
322.9
311.6
314.7
297.1
374.0
Organic growth (YoY)
8%
6%
4%
5%
11%
16%
20%
48%
Reported growth (YoY)
10%
2%
-3%
-1%
6%
12%
18%
22%
Reported operating income (EBIT)
46.1
42.2
34.0
53.2
66.9
69.0
64.0
70.2
-3.8
1.0
1.9
0.6
1.0
0.5
2.6
3.7
5.6
3.7
5.3
4.0
1.5
13.6
Organic operating income
44.8
45.8
39.7
57.9
74.0
73.6
66.5
84.3
Organic growth (YoY)
-33%
-34%
-38%
-17%
15%
15%
15%
48%
Reported growth (YoY)
-31%
-39%
-47%
-24%
4%
8%
11%
23%
Betsson AB (publ), interim report July-September 2026
24
2026/Q3
OTHER NOTES
CURRENCY EXCHANGE RATES
The exchange rates below have a direct effect on the figures in the report.
Income Statement (average rate during the period July - September)
2026
2025
SEK/EUR
0.0921
0.0900
2.3%
GEL/EUR
0.3218
0.3265
-1.4%
ARS/EUR
0.0006
0.0008
-24.2%
PEN/EUR
0.2529
0.2472
2.3%
2026-09-30
2025-09-30
∆
SEK/EUR
0.0883
0.0904
-2.4%
GEL/EUR
0.3384
0.3151
7.4%
∆
Balance Sheet (closing rate)
TRANSACTIONS WITH RELATED PARTIES
No significant transactions took place between Betsson and related parties that affected
Betsson’s financial position and performance in the period. The extent and nature of
transactions with related parties in the period are consistent with previous year’s
transactions with related parties, as described in the latest annual report.
ACCOUNTING POLICIES
Betsson complies with IFRS standards and interpretations (IFRIC) as adopted by the EU. This
Report has been prepared in accordance with IAS 34, Interim Financial Reporting. The
Parent Company’s financial statements have been prepared in accordance with RFR 2.
The accounting policies applied are consistent with those presented in the Annual Report
for 2025. Detailed information about the Group’s accounting and valuation principles can
be found in the Annual Report for 2025 (Note 2), which is available on www.betssonab.com
or at the Company’s head office.
Betsson AB (publ), interim report July-September 2026
25
2026/Q3
ACQUISITIONS 2026
On 12 March 2026, Betsson announced the acquisition of Rhino Entertainment. The
completion of the acquisition was announced on 3 August 2026. The acquisition includes
several Rhino Group entities that collectively hold assets, licenses, personnel and
operational capabilities related to B2C activities in Ontario and the rest of Canada. In
addition to the B2C assets, Betsson acquires Rhino’s proprietary front-end and middleware
technology. This technology will strengthen Betsson’s B2B offering and is expected to drive
incremental licensing revenue within Betsson’s B2B business.
The preliminary purchase price for the acquisition of Rhino Entertainment amounts to EUR
73.1 million on a cash and debt-free basis, payable in cash.
The table below summarises the preliminary purchase price, and fair value of recognised
assets and liabilities. Current receivables and liabilities do not involve any derivatives, and
their fair values are equivalent to their reported values.
MEUR
Purchase price
Reported amount of identifiable acquired assets
and assumed liabilities:
Customer relationships
Purchase price allocation
73.1
6.2
Trademarks
5.6
Technology assets
11.8
Current receivables
2.6
Deferred tax liability
3.8
Current liabilities
3.6
Cash and cash equivalents
6.5
Total identifiable net assets
25.3
Goodwill
47.8
The purchase price allocation should be considered
preliminary.
Cash flow effect of acquisition:
Paid purchase price
65.3
Acquired liquid funds
6.5
Cash flow, net effect
58.8
Betsson AB (publ), interim report July-September 2026
26
2026/Q3
DEFINITIONS OF ALTERNATIVE PERFORMANCE MEASURES
This financial report refers to key figures that Betsson and others use in the evaluation of
Betsson. These so-called Alternative Performance Measures (APMs) are not defined in IFRS.
The measures provide management and investors with important information to analyse
trends in the Company's and Group's business operations. These APMs are intended to
supplement, not replace, financial measures presented in accordance with IFRS.
Active customers: Number of customers who have played on any of Betsson’s gaming sites
in the past three months, without any deposit requirement.
All gaming solutions: Under this term, KPIs attributable to Betsson are consolidated with
KPIs attributable to B2B partners.
Average equity: Equity in the beginning of the period plus equity at the end of the period,
divided by two.
Average capital employed: Total assets less non-interest-bearing debts at beginning and
end of quarter, divided by two.
Average number of employees: Number of employees expressed as full-time equivalent,
FTE (full year’s work).
Average number of shares outstanding: Weighted average number of shares outstanding
during the period.
B2B: Business-to-Business
Betting duties: Includes consumption tax attributable to local licenses to operate gaming.
Fixed fees for gaming licenses are not included.
Deposits: Customers’ deposits to gaming accounts.
Dividend per share: Actual/proposed dividend. Includes share redemption programmes.
Earnings per share after dilution: Net income, attributable to owners of the Parent
Company, divided by the weighted average number of shares outstanding adjusted for
additional number of shares from incentive programmes with dilutive effect.
Earnings per share: Net income attributable to owners of the Parent Company, in relation
to the average number of shares outstanding.
EBITDA: Income before financial items, taxes, depreciation and amortisation.
EBITDA margin: EBITDA as a percentage of revenue.
Equity per share: Equity, attributable to owners of the Parent Company, in relation to the
number of shares outstanding at the end of the period.
Equity/assets ratio: Equity at the end of the period as a percentage of the balance sheet
total at the end of the period.
Gross profit: Revenue less commission to partners and affiliates, betting duties, licensing
fees to games suppliers, payments to payment suppliers.
Net debt: Financial liabilities (bond, bank loans and leasing debts) plus customer balances
less Cash and cash equivalents and 90% of receivables from payment providers.
Number of employees: Number of employees on last month’s payroll.
Number of shareholders: Number of direct shareholders and shareholders listed through a
nominee shareholder registered in the shareholder register kept by Euroclear Sweden AB.
Number of shares: The total number of A, B and C shares at the end of the period, excluding
redemption shares.
Number of shares outstanding: Total number of shares (excluding treasury shares and
redemption shares) at the end of the period.
Organic: Excluding effects from currency fluctuations, in relation to the comparable period,
and contribution from acquired entities over the past 12 months
Betsson AB (publ), interim report July-September 2026
27
2026/Q3
Operating income (EBIT): Income before financial items and taxes.
Operating margin (EBIT): Operating income as a percentage of revenue.
Operational expenses: Expenses for marketing, personnel, other external expenses,
amortisation and depreciation, capitalised development costs and other operating
income/expenses.
Profit margin: Income before taxes as a percentage of revenue.
Return on equity: Income after tax in relation to average equity.
Return on total capital: Income after financial items plus financial expenses, in relation to
average total capital.
Return on total capital employed: Income after financial items plus financial expenses, in
relation to average capital employed.
Revenue: Revenue from gaming business is reported after payment/payout of players’
winnings, less deductions for jackpot contributions, loyalty programmes and bonuses and
other operating income. License fees from B2B partners consist of invoiced revenue for
providing technical platforms for external gaming operators.
Betsson AB (publ), interim report July-September 2026
28
2026/Q3
FINANCIAL CALENDAR
Q4 2026
Q1 2027
Q2 2027
Q3 2027
Q4 2027
4 February 2027
27 April 2027
16 July 2027
26 October 2027
4 February 2028
PRESENTATION OF THE REPORT
At 09:00 CEST on 22 October 2026, Betsson invites analysts, investors and media to
participate in the presentation of the report for the third quarter of 2026. The report will
be presented by CEO Pontus Lindwall and CFO Martin Öhman. The presentation will be held
in English, followed by a Q&A session. Participants are welcome to join via the webcast or
telephone conference.
Link to participate in the webcast:
https://events.inderes.com/betsson/q3-reprt-2026
Written questions can be asked via the webcast.
Link to ask questions verbally via the teleconference:
https://events.inderes.com/betsson/q3-reprt-2026/dial-in