Skip to main content Affirming AAK’s leadership in responsible coconut sourcing AAK has become the first company to achieve Gold status in the Sustainable Coconut Charter’s Assurance System Supply Chain Standard audit. This affirms AAK’s leadership…
Skip to main content

Affirming AAK’s leadership in responsible coconut sourcing
AAK has become the first company to achieve Gold status in the Sustainable Coconut Charter’s Assurance System Supply Chain Standard audit. This affirms AAK’s leadership in responsible coconut sourcing and delivers verifiable confidence to customers and partners across the supply chain.
AAK scored 95.65% in the audit, the highest tier in a four-level rating framework that benchmarks how thoroughly a company embeds sustainability across its entire coconut supply chain. We also covered Chain of Custody (CoC) module verification to ensure the integrity and traceability of coconut products within AAK’s supply chain. The result reflects both AAK’s fully segregated and mass balance coconut supply chains.
What is the Sustainable Coconut Charter Assurance System?
The Sustainable Coconut Charter Assurance System is an annual, company-level audit. It assesses how well an organization’s coconut supply chain aligns with the principles of the Sustainable Coconut Charter, which is the industry’s global benchmark for responsible coconut sourcing.
The audit evaluates performance across four core areas:
-
Governance and transparency — policies, commitments, and internal management structures
-
Supply chain traceability — supplier mapping, chain-of-custody controls, and traceability to farm level
-
Risk assessment and implementation — due diligence, social and environmental risk management, and supplier engagement
-
Reporting and assurance — public disclosure, grievance mechanisms, and verified sustainability claims
Companies are scored against defined criteria and recognized at one of four levels: Basic, Bronze, Silver, or Gold. AAK took the initiative to undergo the audit and is the first company to achieve the Gold level.
AAK’s approach to sustainable coconut sourcing
As a founding member of the Sustainable Coconut Partnership
(SCP) since 2020, AAK has a long-standing commitment to responsible coconut sourcing.
Together with SCP — whose Steering Committee includes Barry Callebaut, Nestlé, P&G, and Unilever — AAK focuses on three strategic priorities aligned with the Sustainable Coconut Charter:
-
Improving smallholder farmer incomes and yields by providing free coconut seedlings for replanting and fertilizers
-
Enhancing supply chain traceability to increase transparency
-
Preventing deforestation and mitigating climate change through sustainable practices and ecosystem conservation
In practice, this includes comprehensive supply chain risk assessments, sourcing from primate-friendly supply chains, and collaboration with satellite intelligence specialist Satelligence to support deforestation monitoring and coconut tree-age mapping.
What this means for AAK customers
For food, beverage, and personal care companies sourcing coconut with AAK, Gold status provides concrete, independently assessed evidence of supply chain quality. It means:
-
Verified traceability — an audited view of sourcing origins and risks, giving customers greater transparency
-
Audited due diligence — comprehensive risk management that reduces exposure to supply chain disruptions
-
Support for CSRD and sustainability reporting — credible, verifiable documentation that can serve as evidence of responsible sourcing in customers’ own compliance processes
-
Confidence in continuous improvement — the annual audit framework ensures AAK’s sustainability performance is actively monitored and continuously advanced
“We are proud to be part of a network that puts farmer livelihoods, traceability, and environmental sustainability at the core of its mission.”
— Seng Bee Ng, Multi-Oils Manager – Coconut Lead, AAK
About the Sustainable Coconut Charter and Partnership
The Sustainable Coconut Charter is the global industry benchmark for coconut sustainability, developed through multi-stakeholder consultations with over 100 organizations. It focuses on three impact areas: improving smallholder farmer incomes, enhancing supply chain traceability, and preventing deforestation and climate change.
The Sustainable Coconut Partnership is the global platform for coconut sustainability, uniting buyers, processors, and producers to improve farmer livelihoods, protect the natural environment, and build climate resilience. Its Steering Committee includes AAK, Barry Callebaut, Nestlé, P&G, and Unilever.
Read more about AAK's coconut sourcing
[
\
\
AAK partners up for a more sustainable coconut industry
Together with industry peers in the coconut industry, AAK partners up in the new Satelligence network, to unitedly tackle challenges in the upstream supply chain and create a long-lasting impact for a more sustainable coconut industry.](https://www.aak.com/news-and-media/news/AAK_partners_up_for_a_more_sustainable_coconut_industry/)
[
\
\
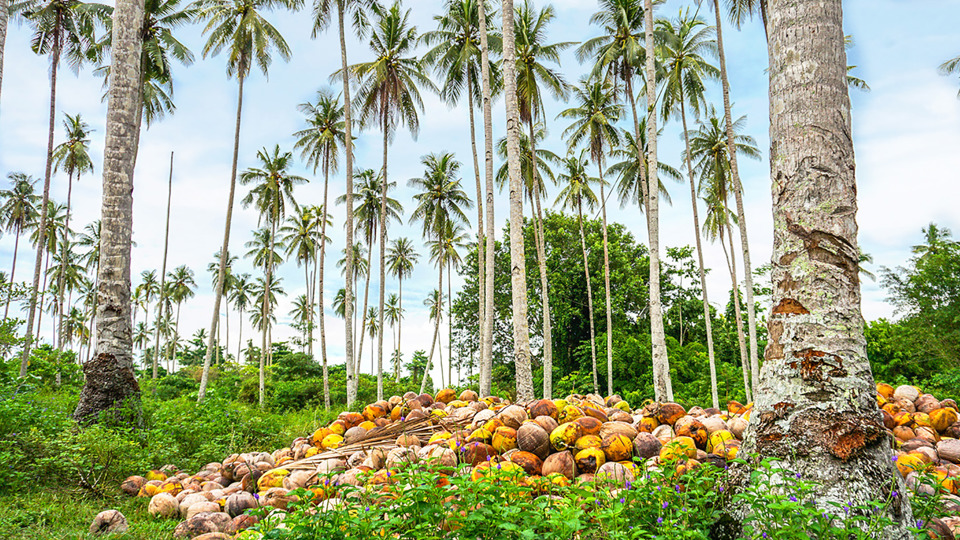
AAK signs first global Sustainable Coconut Charter
AAK has signed the coconut industry’s first global Sustainable Coconut Charter, which aims to improve farmer livelihoods, lessen the carbon footprint of coconuts and boost supply to meet rising global demand.](https://www.aak.com/news-and-media/news/aak-signs-first-global-sustainable-coconut-charter/)