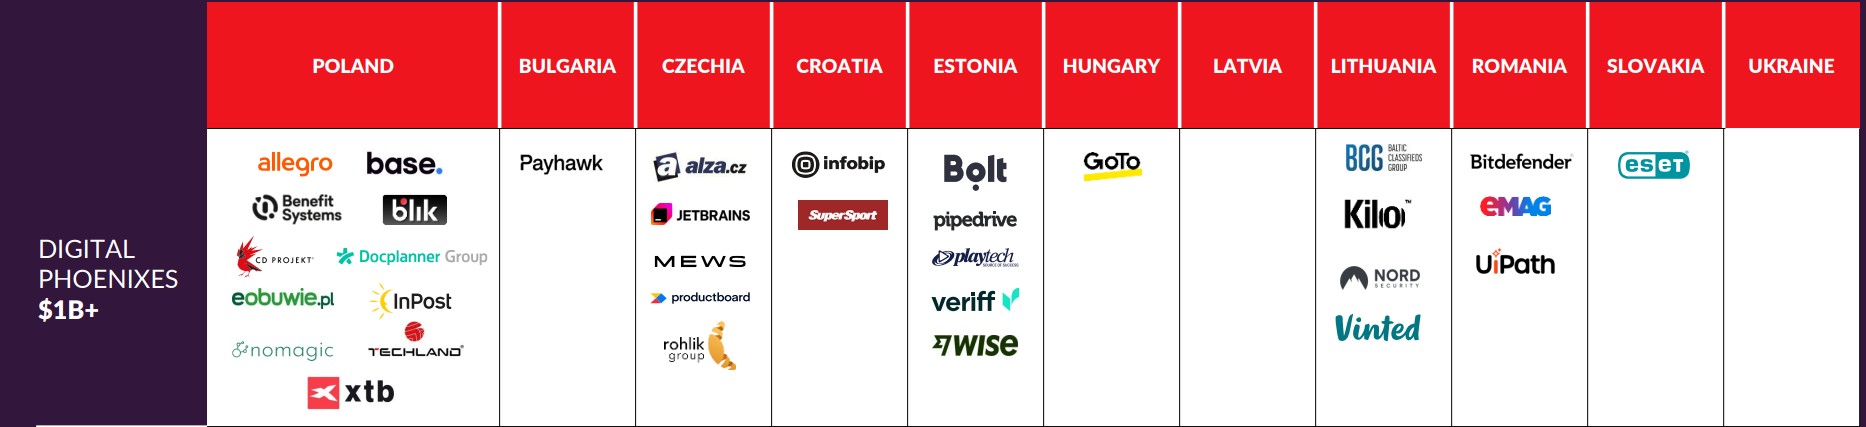
XTB is a Polish fintech brokerage firm providing online investment, trading, and savings services to retail and institutional clients. The company offers a wide range of financial instruments, including stocks, ETFs, and contracts for difference (CFDs) on currencies, commodities, indices, and cryptocurrencies, as well as investment plans and fractional shares. XTB operates through its proprietary xStation platform and mobile application, serving customers across Europe, the Americas, and Asia. The group includes subsidiaries such as XTB International Limited, XTB Limited, and X Open Hub, which provides services to institutional clients. Formerly known as X-Trade Brokers, the company has been listed on the Warsaw Stock Exchange since 2016 and is regulated by authorities including the Polish KNF, the UK FCA, and the Belize FSC.

Summarised from the company's own disclosures, fiscal year ended Dec 2025

Industry Capital Markets Homepage xtb.com
Sector Financial Services IR page ir.xtb.com
Tags
online brokerage, cfds, etfs, stocks, cryptocurrency trading, investment plans, fractional shares, fintech, retail investing, institutional services, xStation, XTB App, XTB International Limited, XTB Limited, XTB Sucursal, X Open Hub, X Financial Solutions
Press page —

Metrics

Valuation  
Market cap zł 18.811B
Market cap (USD) $ 4.694B
P/E 14.91
PEG —
P/BV 7.35
P/S 8.77
P/OCF 30.62
P/FCF 31.75
Dividend yield 3.4%
Turnover / mcap —
Returns  
ROE 32.2%
ROI 32.2%
ROIC 34.5%
Profit margin 30.0%
Growth  
Revenue growing Yes
Profits growing No
Revenue up 3y Yes
Revenue up 5y No
Earnings growth 3y (net profit CAGR) -5.6%
Quality  
Profitable Yes
Margin expanding No
Buying back stock No
Diluting (TTM) No
Debt/Equity —
Podcast bulls (TTM) Sign up
Podcast bears (TTM) Sign up
Podcast sentiment (TTM) Sign up
Podcast sentiment % (TTM) Sign up
News sentiment (TTM) 15
Quality score 16.7%
Insiders  
Buys, 1w Sign up
Buys, 1m Sign up
Buys, 1y Sign up
Sells, 1w Sign up
Sells, 1m Sign up
Sells, 1y Sign up

Sign up to see this company's insider trades

Figure FY 2025 FY 2024 FY 2023 FY 2022 FY 2021 FY 2020 FY 2019 FY 2018 FY 2017 FY 2016 FY 2015
Revenue 2.146B 1.873B 1.588B 1.444B 625.595M 797.75M 239.304M 288.301M 273.767M 250.576M 282.542M
Net profit 644.199M 856.856M 791.173M 766.096M 237.83M 402.087M 57.701M 101.471M 92.973M 77.707M 119.035M
Free cash flow 592.468M 808.984M 464.791M 1.136B 191.204M 464.782M 57.388M — — — —

Filed figures

Figure Dec 2018 Dec 2019 Dec 2020 Dec 2021 Dec 2022 Dec 2023 Dec 2024 Dec 2025
Balance sheet detail
Lease liabilities (PLN) — 10.8M 8.65M 7.44M 30.5M 29.6M 33.9M 25.9M
Cash and deposits (PLN) 468M 484M 542M 2.38B 3.16B 3.68B 5.37B 7.86B
Intangible assets (PLN) — 572,000 639,000 585,000 1.44M 1.17M 2.01M 1.4M
Cash flow detail
Operating cash flow (PLN) — 60.6M 469M 199M 1.15B 479M 828M 614M
Purchases of property, plant and equipment (PLN) — -3.2M -4.35M -7.81M -12.6M -14.5M -19.3M -21.9M
Purchases of intangible assets (PLN) — -99,000 -324,000 -210,000 -1.12M -106,000 -1.38M -15,000
Change in receivables (cash effect) (PLN) — -1.47M -6.84M -13.3M -15.1M 10.3M -23.6M -52.7M
Dividends paid (cash effect) (PLN) — -20M -28.2M -210M -176M -570M -590M -641M
Share buybacks (cash effect) (PLN) — — — — — 0.00 -7.75M -7.38M
Interest paid (cash effect) (PLN) — -397,000 -306,000 -314,000 -841,000 -2.67M -1.05M -1.29M
Income taxes paid (cash effect) (PLN) — -4.03M -92.2M -48M -134M -146M -202M -139M
Operating cash flow before change in receivables (PLN) — 62.1M 476M 212M 1.16B 469M 852M 667M
Free cash flow (OCF - PPE - intangibles) (PLN) — 57.3M 464M 191M 1.14B 465M 808M 592M
Income detail
Total comprehensive income (PLN) — 55.5M 426M 237M 767M 785M 859M 636M
Comprehensive income to owners (PLN) — 55.5M 426M 237M 767M 785M 860M 636M
Reported Mar 10, 2021 Mar 10, 2021 Mar 10, 2021 Mar 9, 2022 Mar 23, 2023 Mar 21, 2025 Mar 21, 2025 Mar 20, 2026

Sign up to see institutional holdings

Sign Up

Podcast Mentions

Sign up to see podcast mentions and sentiment

Sign Up

Recording: Online results conference – preliminary data for the third quarter of 2026

The online results conference dedicated to discussing XTB’s preliminary financial and operational results for the third quarter of 2026 was held on October 29, 2026, at 4:00 p.m. (CET).

New note

Save Delete Close

The recording of the conference is available to watch below or directly on XTB’s YouTube channel


Should you have any questions, please contact: [email protected]

XTB S.A.logo

Newsletter

Copyright © 2026
All rights reserved

Search results

Our website uses only essential cookies that are necessary for its proper functioning. In accordance with applicable law, the use of these types of cookies does not require user consent. More information about how they work is available in our Privacy Policy .Ok

XTB’s preliminary Q3 2026 results: over 1 million new clients added to date and all-time-high client assets in its best operational year

New note

Save Delete Close

  • Thanks to expanding product offerings and a strong global brand, XTB welcomed over 335 thousand new users (+51.4% year-over-year), bringing the total investor base to nearly 3.14 million (+64.8% year-over-year).

  • Active clients hit a new record of more than 1.56 million, jumping 70.3% compared to last year.

  • Client assets reached EUR 12.7 billion by the end of Q3 2026, led by stocks (EUR 5.8 billion) and ETFs (EUR 5.3 billion).

  • XTB’s estimated results beat analysts’ expectations, with consolidated net profit rising 295.2% year-over-year to EUR 49.3 million and operating revenues climbing to EUR 143.8 million

The preliminary Q3 2026 results confirm XTB’s best operational year to date as it continues building Europe’s leading investment app. Through targeted marketing and sports sponsorships, XTB expanded its user base, driving strong revenue growth despite lower market volatility from July to September.

The past quarter proved that our strategy is effective not only in periods of heightened financial market volatility. Recent months were characterized by significantly greater calm than the first half of 2026, and despite this, we were able to achieve financial results that beat analysts' expectations. I believe that as we further expand our product offering, we will be able to deliver even better results. In recent months, our app gained new functionalities and products that allow us to set standards in the European investment market,

Omar Arnaout CEO of XTB

Unstoppable client growth momentum

So far this year, XTB welcomed almost 1.04 million new clients, growing the total client base to nearly 3.14 million (+64.8% year-over-year). That means in every single quarter of 2026, XTB easily surpassed management’s target of adding 250 to 290 thousand clients per quarter. On top of that, active clients reached an all-time high of over 1.56 million, up 70.3% year-over-year.

XTB’s active client base leans distinctly young, with strong engagement among working professionals and people just starting their careers. Investors aged 25-34 and 35-44 make up the majority at 60.2% total, with 25-34 year-olds remaining the largest group at 33.7%. Meanwhile, the 18-24 age bracket saw the fastest growth, rising from 16.9% to 19.0% (+2.1 p.p.). Altogether, investors under 35 now account for more than half of the active client base (52.7% in 2026 vs. 52.3% in 2025).

More than 84% of new clients begin by investing in ETFs and stocks

XTB is making rapid progress in its evolution into a comprehensive multi-asset investment platform. This strategic shift is reflected in client behavior: 84.4% of new users now start with trading stocks, ETFs, or personalized Investment Plans, while reliance on traditional CFD products continues to decline. Year to date, XTB clients executed over 70 million stock, ETF, and Investment Plan transactions, doubling the volume from Q1-Q3 last year.

Demand for long-term wealth building remains robust across European markets. Key drivers include Poland (over 225,000 IKE and 65,000 IKZE accounts), France (over 19,400 PEA accounts) and the UK (over 11,700 ISA and Cash ISA accounts). Expanding this portfolio further, XTB launched tax-advantaged TBSZ accounts in Hungary at the end of Q3 2026.

This shift toward long-term equity investing directly accelerated client asset growth, pushing total client holdings past EUR 12.7 billion by the end of Q3. Stocks accounted for over EUR 5.8 billion, while ETFs represented nearly EUR 5.3 billion, together making up more than 86% of all client assets held at XTB.

Record profitability 

In Q3 2026, XTB generated EUR 49.3 million in consolidated net profit, representing an increase of over 295.2% compared to the same period of the previous year. In total, during the first three quarters of this year, the XTB Group’s consolidated net profit exceeded EUR 289.9 million. For comparison, in the corresponding period of 2025, it amounted to EUR 109.4 million.

Particularly noteworthy is the growing importance of other financial instruments, including shares and ETFs, in XTB’s revenue structure. In Q3 2026 alone, they generated over EUR 143.8 million in revenue, representing an increase of over 63.3% year-over-year. In total, during the first three quarters of this year, revenues from this category reached EUR 633.1 million, recording an increase of 74.5% compared to the corresponding period of the previous year.

XTB S.A.logo

Newsletter

Copyright © 2026
All rights reserved

Search results

Our website uses only essential cookies that are necessary for its proper functioning. In accordance with applicable law, the use of these types of cookies does not require user consent. More information about how they work is available in our Privacy Policy .Ok

Prompts

XTB SPÓŁKA AKCYJNA (ticker XTB), listed in Poland.

ETFs Holding XTB SPÓŁKA AKCYJNA

ETF Weight in ETF Shares Market value As of
EYLD 1.97% 424,392 $ 16.895M Jul 31, 2026
OAEM 1.79% 47,701 $ 2.357M Aug 31, 2026
OAIM 1.38% 108,753 $ 5.375M Aug 31, 2026
GVAL 1.06% 155,595 $ 6.194M Jul 31, 2026
AVSE 0.09% 5,643 $ 196.676K Nov 16, 2026
AVEE 0.07% 2,554 $ 89.015K Nov 16, 2026
AVES 0.06% 25,339 $ 883.144K Nov 16, 2026
AVXC 0.06% 6,857 $ 238.988K Nov 16, 2026
DFSE 0.06% 9,675 $ 338.681K Nov 12, 2026
AVEM 0.05% 366,969 $ 12.79M Nov 16, 2026
DFEM 0.04% 89,839 $ 3.145M Nov 12, 2026
DEXC 0.03% 2,524 $ 88.355K Nov 12, 2026
DFAE 0.03% 72,988 $ 2.555M Nov 12, 2026
DEHP 0.01% 1,667 $ 58.355K Nov 12, 2026
DFAX 0.01% 39,313 $ 1.376M Nov 12, 2026