Decyzja Rady Dyrektorów o wypłacie zaliczki na poczet dywidendy za 2026 rok.
Bull 3
Bear 0
Capital return
|
ASBIS is a value-added distributor, OEM, and solutions provider for IT, IoT, and AI products. The company operates across Central and Eastern Europe, the Commonwealth of Independent States, and the Middle East and Africa regions. Its business segments include value-added distribution for business and retail, premium and luxury retail, data center and enterprise infrastructure, and corporate venture investments. ASBIS develops and sells its own technology brands, including AENO for smart home appliances, Canyon for accessories and wearables, Lorgar for gaming solutions, and Prestigio Solutions for business and education technology. The company also provides trade-in solutions to extend IT lifecycles and offers automation and robotics services. Founded in 1990, ASBIS completed an IPO on the Warsaw Stock Exchange in 2007. It serves over 24,000 B2B customers with a portfolio of more than 100,000 SKUs, maintaining partnerships with major technology vendors. Summarised from the company's own disclosures, fiscal year ended Dec 2025 |
Industry Electronics & Computer Distribution | Homepage asbis.com |
| Sector Technology | IR page investor.asbis.com | |
|
Tags
value-added distribution, it hardware, iot products, ai infrastructure, data center solutions, smart home appliances, gaming peripherals, enterprise servers, networking equipment, b2b distribution, premium retail, robotics, AENO, Canyon, Lorgar, Prestigio Solutions, LORGAR Platform
|
Press page — |
Metrics
| Valuation | |
|---|---|
| Market cap | zł 6.565B |
| Market cap (USD) | $ 1.645B |
| P/E | 29.31 |
| PEG | — |
| P/BV | 5.26 |
| P/S | 0.46 |
| P/OCF | 11.48 |
| P/FCF | 13.11 |
| Dividend yield | — |
| Turnover / mcap | — |
| Returns | |
|---|---|
| ROE | 18.9% |
| ROI | 15.7% |
| ROIC | 22.7% |
| Profit margin | 1.6% |
| Growth | |
|---|---|
| Revenue growing | Yes |
| Profits growing | Yes |
| Revenue up 3y | No |
| Revenue up 5y | No |
| Earnings growth 3y (net profit CAGR) | -7.2% |
| Quality | |
|---|---|
| Profitable | Yes |
| Margin expanding | No |
| Buying back stock | No |
| Diluting (TTM) | — |
| Debt/Equity | 13.4% |
| Podcast bulls (TTM) | Sign up |
| Podcast bears (TTM) | Sign up |
| Podcast sentiment (TTM) | Sign up |
| Podcast sentiment % (TTM) | Sign up |
| News sentiment (TTM) | 68 |
| Quality score | 18.8% |
| Insiders | |
|---|---|
| Buys, 1w | Sign up |
| Buys, 1m | Sign up |
| Buys, 1y | Sign up |
| Sells, 1w | Sign up |
| Sells, 1m | Sign up |
| Sells, 1y | Sign up |
Sign up to see this company's insider trades
Filed figures
Lines the statements and their notes report beside the headline figures, read from the filings' XBRL as filed (no restatement applied), with figures computed from one filing's own lines. Cash-flow lines carry their cash direction: an outflow is negative. Each period links to its filing; a figure's period, report date and tag are in its tooltip.
| Figure | Dec 2020 | Dec 2021 | Dec 2022 | Dec 2023 | Dec 2024 | Dec 2025 |
|---|---|---|---|---|---|---|
| Balance sheet detail | ||||||
| Trade receivables (USD) | 296M | 352M | 329M | 346M | 397M | 529M |
| ↳ YoY growth | +19.1% | -6.6% | +5.2% | +14.7% | +33.2% | |
| ↳ 5y CAGR | +12.3% | |||||
| Borrowings, current (USD) | 161M | 179M | 205M | 197M | 222M | 245M |
| Borrowings, non-current (USD) | 5.73M | 5.11M | 9.18M | 14.7M | 26.1M | 45.4M |
| Cash and deposits (USD) | 159M | 185M | 135M | 144M | 155M | 258M |
| Intangible assets (USD) | 2.42M | 1.9M | 1.08M | 1.7M | 2.84M | 4.43M |
| Net debt (borrowings + leases - cash) (USD) | 7.79M | -809,000 | 79.9M | 68.1M | 93.4M | 32.5M |
| Cash flow detail | ||||||
| Operating cash flow (USD) | 42.2M | 41.4M | -56M | 45.4M | 26.7M | 155M |
| Purchases of property, plant and equipment (USD) | -3.61M | -13.3M | -11.1M | -16.4M | -17.2M | -19.2M |
| Purchases of intangible assets (USD) | -808,000 | -694,000 | -400,000 | -1.3M | -1.67M | -1.1M |
| Change in receivables (cash effect) (USD) | -84.1M | -56.8M | 22.3M | -36.3M | -52M | -133M |
| Change in inventories (cash effect) (USD) | -12.9M | -46.4M | -193M | 81.1M | -102M | -31.1M |
| Change in payables (cash effect) (USD) | 14.7M | 50.3M | 31.7M | -47.8M | 160M | 140M |
| Dividends paid (cash effect) (USD) | -9.68M | -22.2M | -16.6M | -25M | -27.7M | -27.8M |
| Share buybacks (cash effect) (USD) | -36,000 | — | -996,000 | — | — | — |
| Interest paid (cash effect) (USD) | -3.95M | -5.66M | -10.9M | -15.7M | -13.2M | -14.9M |
| Income taxes paid (cash effect) (USD) | -4.75M | -18.4M | -16.4M | -10.8M | -12M | -13.1M |
| Operating cash flow before change in receivables (USD) | 126M | 98.1M | -78.4M | 81.7M | 78.7M | 288M |
| Free cash flow (OCF - PPE - intangibles) (USD) | 37.8M | 27.4M | -67.6M | 27.7M | 7.83M | 135M |
| Income detail | ||||||
| Total comprehensive income (USD) | 37.1M | 75.4M | 72.1M | 61.1M | 44.8M | 68.5M |
| Comprehensive income to owners (USD) | 37.1M | 75.3M | 72.1M | 61.2M | 45.1M | 68.8M |
| Reported | Mar 31, 2022 | Mar 31, 2022 | Mar 30, 2023 | Mar 28, 2024 | Mar 28, 2025 | Mar 26, 2026 |
Sign up to see institutional holdings
Sign UpPodcast Mentions
Sign up to see podcast mentions and sentiment
Sign UpCurrent reports filed through ESPI/EBI, newest first, titles as filed in Polish, managers' transactions, shareholding notifications and other routine reports included. The link opens the report on GPW. Press releases from the company's own website, newest first.
Informacja o szacunkowych miesięcznych skonsolidowanych przychodach za wrzesień 2026 r.
Bull 3
Bear 0
Results
Current report No 24/2026
Bull 3
Bear 0
Results
Information on monthly estimated consolidated revenues of September 2026.

Date: 2026-10-20
Time of disclosure: 08:19 CET
Title: Information on monthly estimated consolidated revenues of September 2026.
Legal Basis: Art. 17 ust.1 MAR – inside information
Message: The Board of Directors of ASBISc Enterprises Plc following its decision on publication of information about estimated monthly consolidated revenues, as announced in current report no 4/2017, hereby informs that:
estimated consolidated revenues for September 2026 amounted to approx. USD 1,052 million and were approx. 216% higher as compared to revenues for September 2025 (USD 332 million).
The above data is based on the best possible estimation prepared by the Board and may differ slightly from final data.
Disclaimer: The information contained in each press release posted on this site was factually accurate on the date it was issued. While these press releases and other materials remain on the Company's website, the Company assumes no duty to update the information to reflect subsequent developments. Consequently, readers of the press releases and other materials should not rely upon the information as current or accurate after their issuance dates.

© 1995 — 2024 ASBISc Enterprises Plc.
This website uses "cookies" to give you the best, most relevant experience. Most computers have their browsers set to automatically accept the use of cookies. Therefore, by using this website and not changing your browser settings, you are deemed to indicate your consent to our use of these cookies and other technologies and accept the terms of ASBISC Enterprises PLC Cookies Policy. If you do not consent the use of cookies on this website, please either be sure to block or disable them changing your browser settings (explained here ) or stop using the website. If you decide to block cookies, you may experience reduced functionality or be prevented from using the website completely.

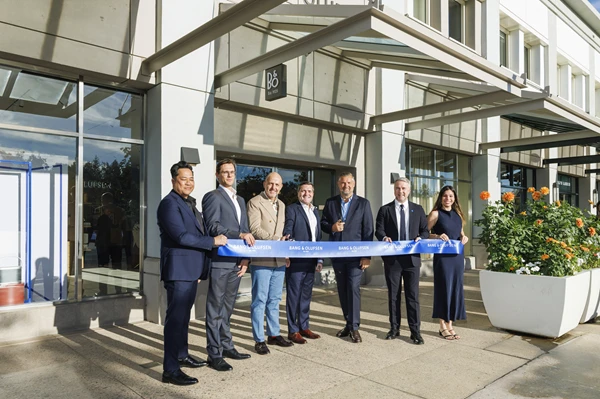


 Before joining ASBIS, Mr. Teär held the position of Chief Executive Officer of Bang & Olufsen, a position he held from 2019 to January 2026. During his tenure, he led a successful corporate turnaround and spearheaded the company’s strategic transformation into a globally recognized luxury technology and lifestyle brand. Prior to Bang & Olufsen, Mr. Teär held senior executive positions at Logitech, BlackBerry, and Sony Ericsson. He began his career at Ericsson, where he spent 18 years in a series of progressively senior leadership roles, culminating in appointments as Regional President for Southeast Asia, Central Europe, and Central America.
Prompts
Click prompts to add them under the company line, click again to take one out, then copy the result into your AI chat. Shared by Asian Century Stocks and Uncovered Thai Stocks. Thank you.
ASBISC ENTERPRISES PLC (ticker ASB), listed in Poland.
Copied
ETFs Holding ASBISC ENTERPRISES PLC
Exchange-traded funds whose newest published daily portfolio holds one of the company's listings, largest weight first.
| ETF | Weight in ETF | Shares | Market value | As of |
|---|---|---|---|---|
| AVEE | 0.09% | 2,907 | $ 113.478K | Nov 16, 2026 |
| DEXC | 0.05% | 2,862 | $ 120.575K | Nov 12, 2026 |
| DFSE | 0.04% | 5,566 | $ 234.493K | Nov 12, 2026 |
| DFEM | 0.02% | 46,462 | $ 1.957M | Nov 12, 2026 |
| AVES | 0.02% | 7,375 | $ 287.891K | Nov 16, 2026 |
| DFAE | 0.01% | 29,612 | $ 1.248M | Nov 12, 2026 |
| AVEM | 0.01% | 97,547 | $ 3.808M | Nov 16, 2026 |
| AVXC | 0.01% | 682 | $ 26.623K | Nov 16, 2026 |
| DFAX | 0.01% | 27,109 | $ 1.142M | Nov 12, 2026 |