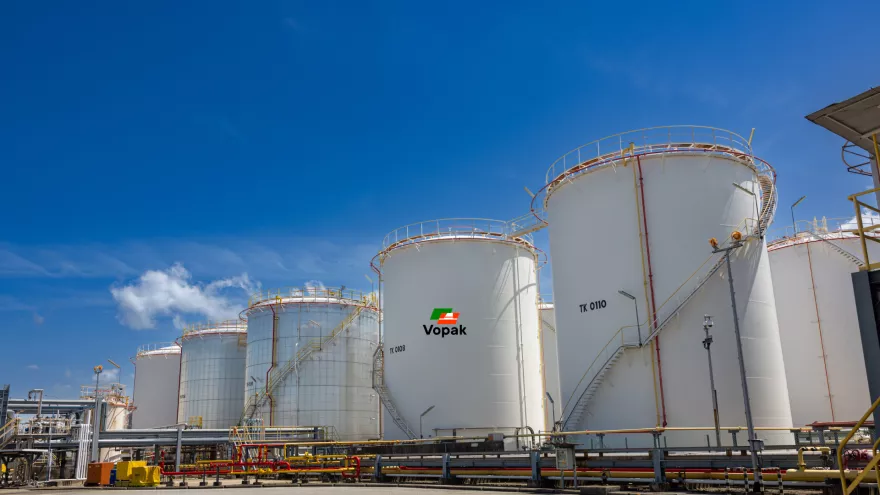
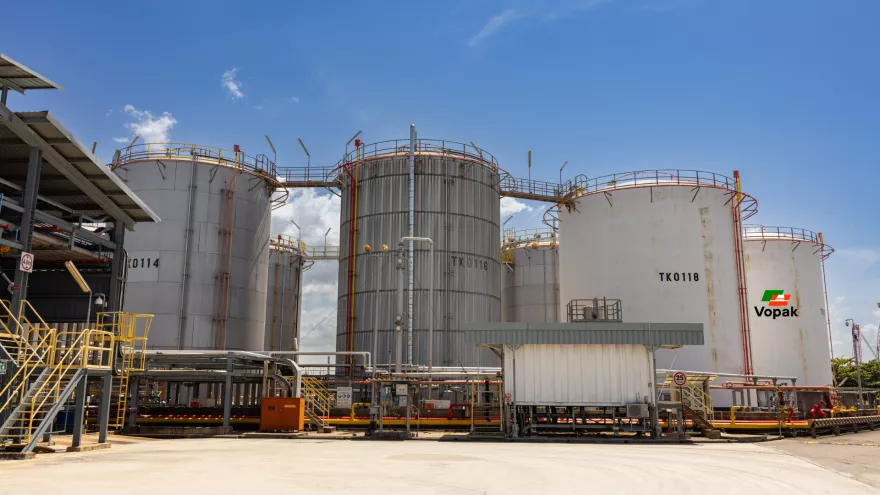
Koninklijke Vopak N.V. is a tank storage company providing infrastructure solutions for the storage of new energies, feedstocks, gas, industrial, chemical, and oil products. The company operates terminals at ports globally, serving customers in the energy, chemical, and industrial sectors. Vopak manages a portfolio of storage assets and offers services related to the energy transition, including infrastructure for new energy sources. The company has a history spanning over four centuries and operates on a global scale, facilitating the flow of essential products within supply chains.

Summarised from the company's own disclosures, fiscal year ended Dec 2024

Industry Oil & Gas Midstream Homepage vopak.com
Sector Energy IR page vopak.com/investors
Tags
tank storage, liquid storage, gas storage, chemical storage, oil storage, energy transition infrastructure, port terminals, feedstock storage, Vopak WeConnect
Press page vopak.com/newsroom/news

Metrics

Valuation  
Market cap € 2.975B
Market cap (USD) $ 3.288B
P/E 4.93
PEG —
P/BV 0.88
P/S 2.50
P/OCF 3.31
P/FCF —
Dividend yield —
Turnover / mcap —
Returns  
ROE 19.0%
ROI 11.6%
ROIC 13.8%
Profit margin 48.5%
Growth  
Revenue growing No
Profits growing Yes
Revenue up 3y No
Revenue up 5y No
Earnings growth 3y (net profit CAGR) —
Quality  
Profitable Yes
Margin expanding Yes
Buying back stock Yes
Diluting (TTM) —
Debt/Equity 60.0%
Podcast bulls (TTM) Sign up
Podcast bears (TTM) Sign up
Podcast sentiment (TTM) Sign up
Podcast sentiment % (TTM) Sign up
News sentiment (TTM) 8
Quality score 56.3%
Insiders  
Buys, 1w Sign up
Buys, 1m Sign up
Buys, 1y Sign up
Sells, 1w Sign up
Sells, 1m Sign up
Sells, 1y Sign up

Sign up to see this company's insider trades

Figure FY 2025 FY 2024 FY 2023 FY 2022 FY 2021 FY 2020 FY 2019 FY 2018 FY 2017 FY 2016 FY 2015 FY 2014 FY 2013 FY 2012 FY 2011 FY 2010 FY 2009
Revenue 1.299B 1.316B 1.426B 1.367B 1.228B 1.19B 1.253B 1.286B 1.306B 1.347B 1.386B 1.323B 1.295B 1.326B 1.172B 1.106B 1.001B
Net profit 630M 419.8M 488.8M -137.8M 243.2M 330.5M 603.8M 290.5M 275.2M 579.6M 326.7M 295.6M 360.9M 369.5M 435.6M 300.8M 276.5M

Figure FY 2025 FY 2024 FY 2023 FY 2022 FY 2021 FY 2020 FY 2019 FY 2018 FY 2017 FY 2016 FY 2015 FY 2014 FY 2013 FY 2012 FY 2011 FY 2010 FY 2009
Share price — — — 25.76 — — — — — 41.86 — — — — — — —
P/OCF — — — 3.92 — — — — — — — — — — — — —

Filed figures

Figure Dec 2019 Dec 2020 Dec 2021 Dec 2022 Dec 2023 Dec 2024 Dec 2025
Balance sheet detail
Trade receivables (EUR) 296M 276M 260M 319M 353M 344M 284M
↳ YoY growth -6.8% -6.0% +22.7% +10.7% -2.5% -17.3%
↳ 5y CAGR +3.0% +0.6%
Borrowings, current (EUR) — — — — — 279M 62.4M
Borrowings, non-current (EUR) — — — — — 1.72B 2.03B
Lease liabilities (EUR) 565M 699M 711M 725M 640M 651M 615M
Cash and deposits (EUR) 94.5M 68.3M 73.4M 33.8M 197M 94.2M 99.5M
Right-of-use assets (EUR) 503M 632M 640M 649M 575M 576M 534M
Net debt (borrowings + leases - cash) (EUR) — — — — — 2.56B 2.61B
Cash flow detail
Operating cash flow (EUR) 647M 774M 682M 825M 866M 909M 900M
Purchases of intangible assets (EUR) -29.5M -38.3M -25.4M -17.9M -17.5M -20.8M -18.7M
Dividends paid (cash effect) (EUR) -141M -146M -151M -157M -163M -184M -185M
Share buybacks (cash effect) (EUR) -2.6M -108M -2.9M 0.00 -10.5M -308M -102M
Income taxes paid (cash effect) (EUR) -71.2M -54.9M -65M -55.9M -85.3M -55.1M -80.8M
Income detail
Total comprehensive income (EUR) 622M 198M 412M -5.2M 430M 408M 469M
Comprehensive income to owners (EUR) 585M 180M 375M -43M 404M 361M 452M
Reported May 18, 2021 May 18, 2021 Mar 16, 2022 Feb 21, 2023 Jun 11, 2024 Mar 10, 2026 Mar 10, 2026

Sign up to see institutional holdings

Sign Up

Podcast Mentions

Sign up to see podcast mentions and sentiment

Sign Up

You are here

Vopak Terminals Australia welcomes the New South Wales (NSW) Government’s endorsement of its proposed aviation fuel infrastructure expansion project in Port Botany. Included as a key project to strengthen the state’s fuel security and resilience1, the expansion reinforces Vopak’s commitment to providing robust, future-ready energy infrastructure.

Aligned with the government's fuel security goals, the expansion capacity of approximately 120,000 cbm will strengthen supply chain resilience to help protect consumers and businesses. Adding new storage tanks and pipeline connections to this independent infrastructure increases fuel storage capacity even more, while supporting sustainable aviation fuels (SAF) to drive the sector’s decarbonisation.

Through the Investment Delivery Authority’s (IDA) endorsement, the NSW Government will provide practical, non-financial support to remove delivery barriers, improve coordination across government and accelerate project delivery1. 

“We are proud to receive the endorsement from the NSW Government. As the energy needs of New South Wales continue to evolve, it is critical that we invest in secure, reliable, and adaptable infrastructure. By expanding as an independent, open-access facility, this project will not only address fuel security issues, but boost market competition to the benefit of Australian consumers. Furthermore, with the capability to store SAF, we are laying vital groundwork for the country’s energy transition,” said Mats de Groot, Managing Director, Vopak Terminals Australia. 

The project is subject to Final Investment Decision (FID) and regulatory planning conditions and approvals. For more information on the NSW Government's announcement, please visit the [1] official ministerial release https://www.nsw.gov.au/ministerial-releases/five-projects-endorsed-stre…

About the Vopak Terminals Australia 

Incorporated in 1994, Vopak Terminals Australia is a leading independent fuel import and distribution infrastructure provider, delivering vital storage and logistics solutions to support Australia's energy security and supply chains. Operating major import and distribution facilities at Port Botany, Sydney, and East Arm Berrimah, Darwin, Vopak provides safe, reliable, and open-access infrastructure for a full spectrum of clean petroleum products. Vopak Terminals Australia is part of Royal Vopak, the world’s leading independent tank storage infrastructure company with a global network of terminals and over 400 years of history. For more information about Vopak terminal in Sydney, please visit https://www.vopak.com/terminals/vopak-terminal-sydney-site-b

Note: Vopak does not own, trade, or market the liquid products stored within its facilities, ensuring completely neutral, open access for multiple market participants. 

About Royal Vopak

Royal Vopak helps the world flow forward. At ports around the world, we provide storage and infrastructure solutions for vital products that enrich everyday life. These products include liquids and gases that provide energy for homes and businesses, chemicals for manufacturing products, and edible oils for cooking as well as electrical energy. For all of these, our worldwide network of terminals supports the global flow of supply and demand. For more than 400 years, Royal Vopak has been at the forefront of fundamental transformations. With a focus on safety, reliability, and efficiency, we create new connections and opportunities that drive progress. Now more than ever, our talented people are applying this mindset to support the energy transition. Together with our partners and customers, we are accelerating the development of infrastructure solutions for hydrogen, ammonia, CO₂, battery energy storage systems, and low-carbon fuels & feedstocks – paving the way to a more sustainable future. Vopak is listed on the Euronext Amsterdam and is headquartered in Rotterdam, the Netherlands. For more information, please visit www.vopak.com .

Press Information 

Vopak Press: Alexis Oh - Regional Communications Manager (Asia & Middle East)- [email protected]

Vopak Press:Marta Tomczak - Global Corporate  Communication Manager - [email protected] 

Vopak Analysts and Investors: Fatjona Topciu [email protected]

Commercial & Partnership Information

Noor Sneep

[email protected]

Fact Sheet - Vopak’s Sydney terminal in Port Botany

Vopak’s Sydney terminal in Port Botany is a large-scale independent petroleum import and distribution terminal for the full spectrum of clean petroleum products and bitumen.  It offers optimal ship discharge and truck loading facilities servicing the greater Sydney Metropolitan area, Australia’s largest market and regional New South Wales. It has strategic jet fuel pipeline connection to Sydney Airport and Metropolitan pipelines for gasoline and diesel.

Facts

Tank types

Coated Steel, Mild steel

Tank size

From 2,000 to 26,400 cbm

Access

Pipeline, Truck, Vessel

Berths for vessels

2

Products

Petroleum products, Biodiesel, Ethanol, Bitumen

Services

Blending, Additive injecting, Connection to Sydney, Fully automated truck loading, Metropolitan pipeline

Certification

ISCC+, ISCC EU, ISCC-Corsia

Terminal type 

Import-Export-Distribution

Footer menu

Career

Who we are

Energy Transition

Terminals

Sustainability

Investors

Newsroom

Governance

Brand shape

© 2026 Royal Vopak

You are here

The Netherlands, 30 July 2026

Vopak reports strong first half 2026 results, increases FY 2026 outlook and announces EUR 0.72 interim dividend 

Key highlights

Improve

  • Net profit -including exceptional items- Q2 2026 of EUR 101 million and EPS of EUR 0.89
  • Proportional operating free cash flow in HY1 2026 of EUR 444 million leading to a proportional operating free cash flow per share of EUR 3.88
  • Increased 2026 outlook range for proportional EBITDA to EUR 1,180 - 1,220 million and proportional operating free cash flow to around EUR 820 million
  • Announced interim dividend of EUR 0.72, increasing the frequency of dividend payments to semi-annual
  • First tranche of EUR 100 million, part of the multi-year share buyback program, is progressing well with 45% completed up to 24 July 2026

Grow

  • The deployment of capital towards gas and industrial infrastructure is progressing well, in total EUR 1.7 billion growth commitments have been taken of which EUR 1.1 billion is currently under construction. The majority of projects currently under construction are expected to be commissioned by year-end 2027 
  • A conditional final investment decision has been taken to secure the continuation of EemsEnergyTerminal for the period 2028–2036

Accelerate

  • The deployment of capital towards energy transition infrastructure is progressing, in total around EUR 650 million growth commitments have been taken of which around EUR 575 million is currently under construction
  • Investment decision has been taken on two utility-scale battery energy storage projects in the Netherlands, allocating a total of EUR 371 million to BESS in Q2 2026
Q2 2026 Q1 2026 Q2 2025 In EUR millions HY1 2026 HY1 2025
IFRS Measures -including exceptional items-
343.9 333.2 322.6 Revenues 677.1 651.5
101.3 85.1 218.8 Net profit / (loss) attributable to holders of ordinary shares 186.4 318.6
0.89 0.74 1.89 Earnings per ordinary share (in EUR) 1.63 2.74
271.0 195.6 189.9 Cash flows from operating activities (gross) 466.6 495.8
- 86.1 -88.8 -159.1 Cash flows from investing activities (including derivatives) - 174.9 -296.6
Alternative performance measures -excluding exceptional items- 1
489.9 479.1 493.7 Proportional revenues 969.0 982.1
305.7 294.6 315.4 Proportional group operating profit / (loss) before depreciation and amortization (EBITDA) 600.3 615.3
219.8 224.4 222.9 Proportional operating free cash flow 444.2 450.5
101.3 92.1 117.1 Net profit / (loss) attributable to holders of ordinary shares 193.4 214.9
0.89 0.80 1.01 Earnings per ordinary share (in EUR) 1.69 1.85
Business KPIs
35.7 35.6 35.8 Storage capacity end of period (in million cbm) 35.7 35.8
20.5 20.5 20.4 Proportional storage capacity end of period (in million cbm) 20.5 20.4
91% 91% 91% Subsidiary occupancy rate 91% 91%
91% 91% 91% Proportional occupancy rate 91% 92%
Financial KPIs 1
16.1% 16.6% 17.0% Proportional operating cash return 16.4% 16.9%
15.3% 15.5% 15.2% Proportional operating cash return (12 months rolling basis) 15.3% 15.2%
2,834.5 2,675.1 2,735.8 Net interest-bearing debt 2,834.5 2,735.8
2.47 2.50 2.54 Total net debt : EBITDA 2.47 2.54
1.92 1.96 1.93 Proportional operating free cash flow per share (in EUR) 3.88 3.88
2.87 2.60 2.65 Proportional leverage 2.87 2.65
Sustainability performance 2
Total Injury Rate (TIR), per 200,000 hours worked 0.27 0.22
Lost-time Injury Rate (LTIR), per 200,000 hours worked 0.12 0.12
Process Safety Event Rate (PSER), per 200,000 hours worked 0.14 0.09
Total GHG emissions - Scope 1 & 2 (metric tons) 79.1 92.8
Percentage women in senior management positions 23.7% 22.4%

**CEO message
**We continued to deliver strong performance driven by a healthy demand for our service, despite volatility in global energy and manufacturing markets. The diversification of our portfolio, across geographies and products, has again proven to be a structural strength, enabling us to meet our customers' evolving needs for energy security, affordability and sustainability. During the first six months of the year, we continued to execute our growth strategy, addressing the growing global need for critical energy storage infrastructure. In the Netherlands, we have taken a conditional final investment decision for the continuation of EemsEnergyTerminal. In addition, the construction of LNG and LPG capacity in the Netherlands, India and Canada is progressing well. The acquisition of Green Energy Storage (GES) and the subsequent FIDs for the Oosterhout (200 MW/800 MWh) and Veendam (150 MW/600 MWh) projects in the Netherlands mark a significant strategic step in the development of large-scale battery energy storage systems. Since 2022, we have now committed around EUR 2.3 billion to growth projects. The strong momentum in executing our growth strategy gives us the confidence to achieve our ambition of investing EUR 4 billion by 2030. On the back of strong operational performance and the anticipated contributions from our growth projects, we are raising the outlook for FY 2026. In addition, we announced the first interim dividend of EUR 0.72 per share, increasing the frequency of dividend payments to semi-annual.

**
Financial Highlights for HY1 2026**
IFRS Measures -including exceptional items- 

  • Revenues of EUR 677 million in HY1 2026 (HY1 2025: EUR 652 million) were supported by healthy demand for storage infrastructure services across geographies and markets, underpinned by a continued strong occupancy rate of 91%. Excluding negative currency translation effects of EUR 10 million, revenues increased by 6%, driven by growth project contribution and existing business growth. Supported by long-term contracts, gas and industrial terminals delivered a stable performance and achieved higher throughputs year-to-date. Oil and Chemical terminals also saw strong activity, driven by high infrastructure demand across energy and manufacturing markets as well as commissioning of new capacity.
  • Operating expenses consisting of personnel and other expenses decreased to EUR 321 million in HY1 2026 (HY1 2025: EUR 329 million), mainly driven by lower insurance expenses resulting from less claims in HY1 2026. An exceptional loss on the divestment of Hindustan Aegis LPG (HALPG) of EUR 7 million is reported under operating expenses.
  • Cash flows from operating activities decreased to EUR 467 million in HY1 2026, down from EUR 496 million in HY1 2025, largely driven by lower realized value adjustments on derivative financial instruments. Excluding the impact of derivatives, underlying cash flow from operations improved year-on-year.
  • Cash flow from investing activities for the first half of the year amounted to EUR 175 million (HY1 2025: EUR 297 million) driven by decreased capital expenditures, the repayment of around EUR 45 million shareholder loans by AVTL and EemsEnergyTerminal and the proceeds from divestment of HALPG of EUR 31 million.
  • Consolidated operating capex decreased to EUR 92 million in HY1 2026 (HY1 2025: EUR 101 million). 
  • Consolidated growth capex spent in HY1 2026 was EUR 170 million (HY1 2025: EUR 189 million). 
  • Net profit attributable to holders of ordinary shares was EUR 186 million in HY1 2026 compared to EUR 319 million in HY1 2025. This decrease is largely driven by a dilution gain of EUR 111 million, as a result of the listing of our AVTL joint venture, a commercial resolution gain of EUR 22 million in 2025 and a divestment loss of EUR 7 million in Q1 2026 of HALPG.
  • Earnings Per Share (EPS) for HY1 2026 was EUR 1.63 compared to EUR 2.74 in HY1 2025, reflecting lower net profit, partially offset by a reduced number of shares driven by our share buyback programs.

Alternative performance measures -excluding exceptional items-3
**
Financial KPIs**

  • Proportional revenues were EUR 969 million in HY1 2026 compared to EUR 982 million in HY1 2025, reflecting a resilient portfolio performance. The decrease was largely driven by a positive one-off item related to a commercial resolution of EUR 22 million reported in Q2 2025. Excluding this one-off effect, negative currency translation effects of EUR 24 million and divestment impact of EUR 5 million, proportional revenues increased by 4% year-on-year.

  • Proportional EBITDA in HY1 2026 was at EUR 600 million (HY1 2025: EUR 615 million). The decrease was driven by a positive one-off item related to a commercial resolution of EUR 22 million reported in Q2 2025. Excluding this one-off effect, negative currency translation effects and divestment impact, proportional EBITDA increased by 5% year-on-year.

  • Proportional EBITDA margin increased to 58.9% (HY1 2025: 58.7%) driven by our resilient portfolio and supported by lower proportional operating expenses. 

  • Proportional operating capex was stable in HY1 2026 at EUR 109 million compared to EUR 113 million in HY1 2025. 

  • Proportional operating free cash flow in HY1 2026 was EUR 444 million (HY1 2025: EUR 451 million) resulting in an EBITDA-to-cash conversion of ~74% (HY1 2025: ~73%). EBITDA-to-cash conversion over the last 12 months was ~70%.

  • Proportional operating free cash flow per share remained stable at EUR 3.88 per share (HY1 2025: EUR 3.88), reflecting strong cash flow generation and benefits of the share buyback programs in 2025 and 2026, which were offset by negative currency translation effects and divestments. 

  • Proportional operating cash return (12 months rolling basis) in HY1 2026 was 15.3% compared to 15.2% in HY1 2025, reflecting continued strong cash generation and broadly stable average capital employed.

  • Proportional operating cash return in HY1 2026 was 16.4% (HY1 2025: 16.9%). 

Capital allocation

  • Proportional leverage at the end of Q2 2026 was at 2.87x (Q1 2026: 2.60x) driven by increased investments in growth projects. Proportional leverage is in line with our ambition to stay within the range of 2.5x-3.0x. The impact of assets under construction was around 0.70x at Q2 2026.
  • Total net debt : EBITDA ratio was 2.47x at the end of Q2 2026 (Q1 2026: 2.50x).
  • Vopak will pay its first interim dividend of EUR 72 cent per share on 24 September 2026, increasing the frequency of dividend payments to semi-annual. This is in line with our progressive dividend policy, under which we intend to grow the dividend per share by 5% or more per year.
  • Proportional growth capex in HY1 2026 was EUR 216 million (HY1 2025: EUR 299 million) reflecting key growth investments in our joint ventures in Canada, the Netherlands, India and the United States. 
  • The first tranche of our EUR 500 million multi-year share buyback program, announced on 25 February 2026, is progressing well. Since its start, 45% of the first EUR 100 million tranche has been completed by 24 July 2026. For progress on our share buyback program please visit our website .

Business KPIs

  • Proportional occupancy rate in Q2 2026 was stable at 91% (Q1 2026: 91%) reflecting a continued strong demand for infrastructure services. 

Exceptional itemsin HY1 2026 consisted of divestment loss of EUR 7 million following the sale of HALPG to AVTL, mainly due to INR currency devaluation losses incurred since Vopak acquired the terminal in May 2022.

Prompts

Koninklijke Vopak N.V. (ticker VPK), listed in Netherlands.

ETFs Holding Koninklijke Vopak N.V.

ETF Weight in ETF Shares Market value As of
BILD 1.74% 2,471 $ 128.858K Jun 30, 2026
DISV 0.22% 182,905 $ 11.133M Nov 12, 2026
DFIS 0.11% 108,380 $ 6.597M Nov 12, 2026
AVDS 0.08% 4,898 $ 295.91K Nov 16, 2026
AVDE 0.07% 229,846 $ 13.886M Nov 16, 2026
AVDV 0.05% 167,950 $ 10.147M Nov 16, 2026
DXIV 0.04% 1,682 $ 102.376K Nov 12, 2026
DFIC 0.04% 97,170 $ 5.914M Nov 12, 2026
DFSI 0.03% 5,639 $ 343.221K Nov 12, 2026
DFAX 0.03% 51,890 $ 3.158M Nov 12, 2026
DFAI 0.01% 44,042 $ 2.681M Nov 12, 2026