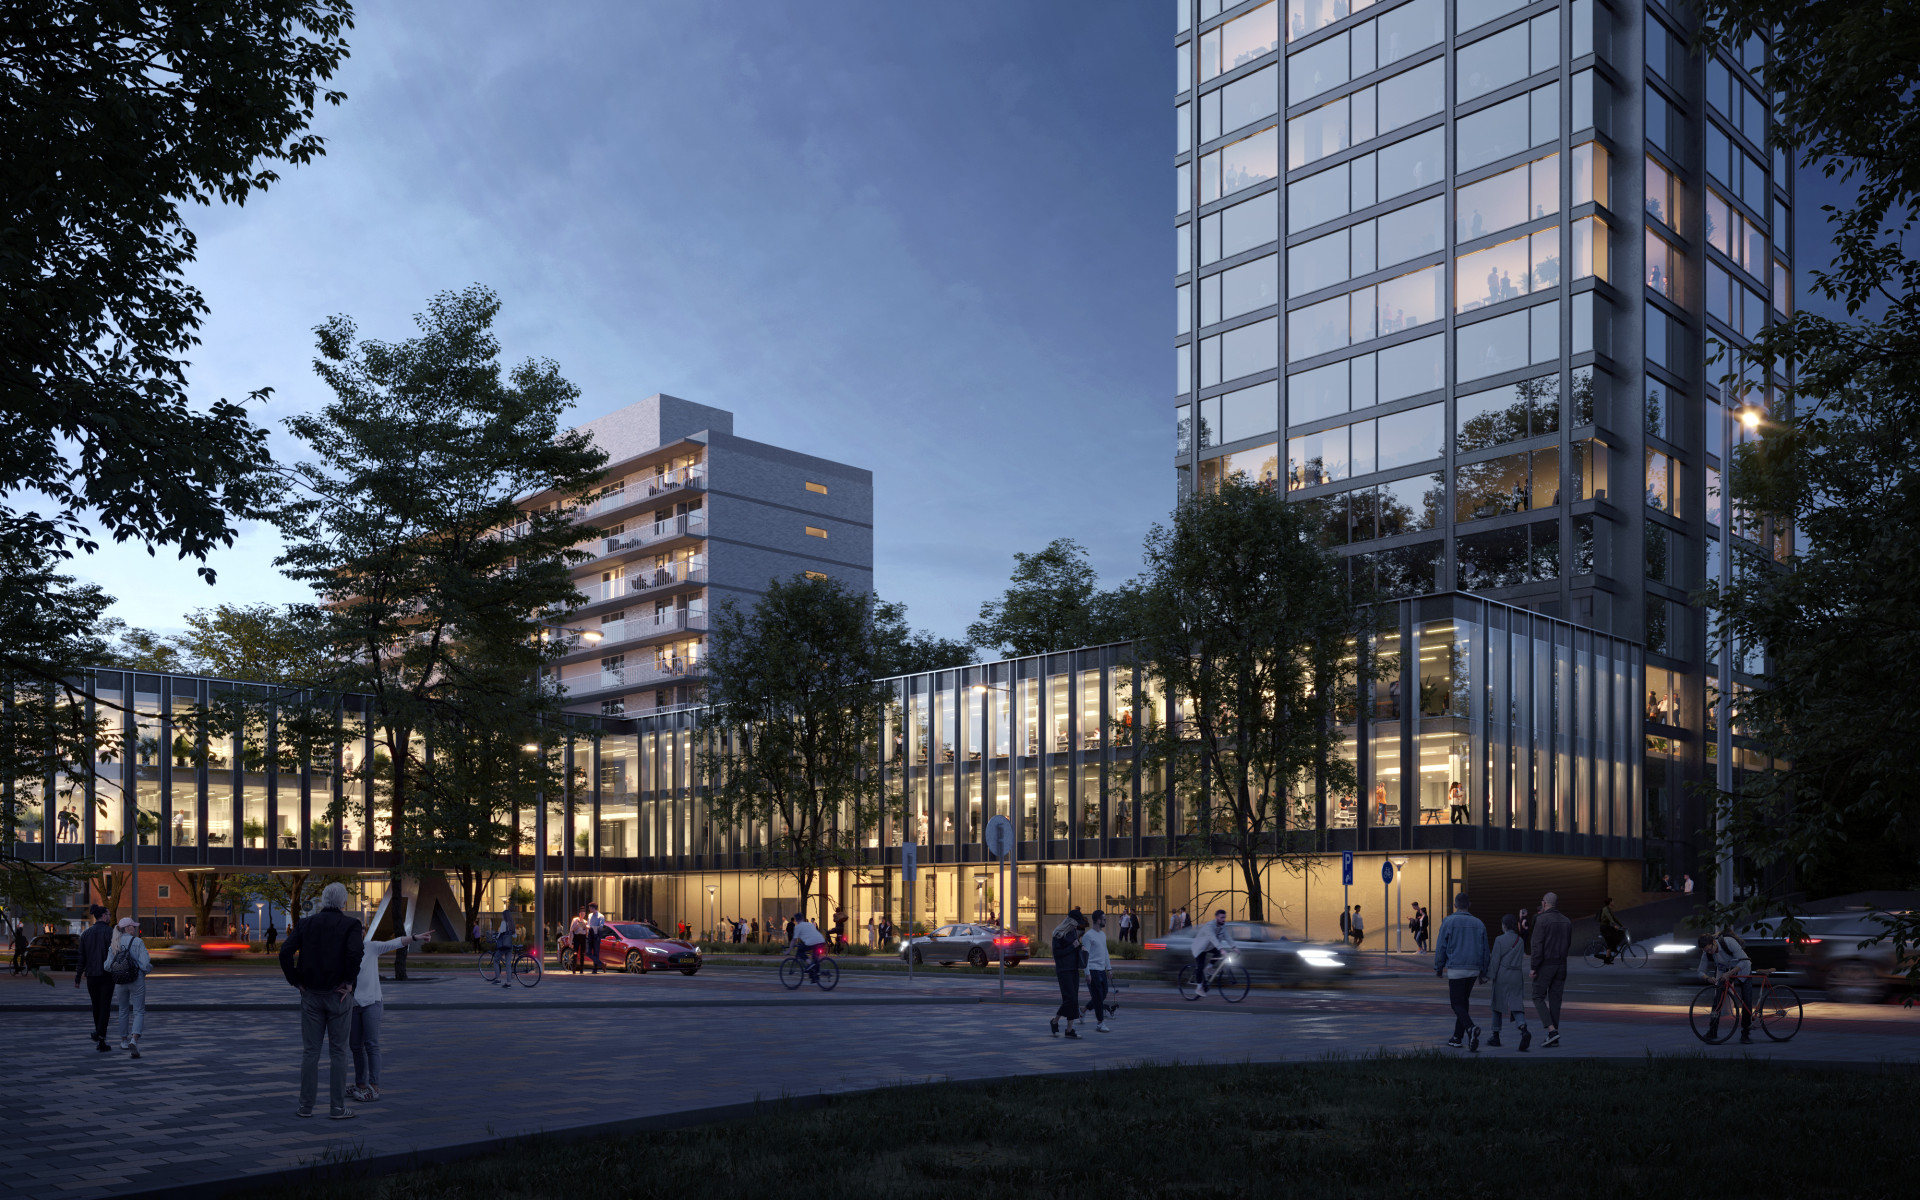
NSI N.V. is a Dutch real estate company primarily focused on office properties. The company operates a portfolio of office assets with a primary focus on Amsterdam, while also selectively investing in other major cities in the Netherlands. In addition to its core office business, NSI invests in Life Science real estate and pursues opportunities for residential redevelopment within its existing portfolio. The company provides a range of office spaces, from single desks to fully tailored corporate locations, emphasizing amenities and sustainability. NSI operates an in-house flex operator named HNK, which serves as an incubator for new services across the portfolio. The company targets customers seeking productive and sustainable work environments, leveraging local market knowledge to match tenants with suitable spaces. NSI is listed on Euronext Amsterdam.

Summarised from the company's own disclosures, fiscal year ended Dec 2024

Industry REIT - Office Homepage nsi.nl
Sector Real Estate IR page nsi.nl/ir
Tags
office real estate, life science real estate, residential redevelopment, flex office, sustainable real estate, asset management, HNK, HNK Amsterdam Houthavens, Atlanta, Bentinck Huis, Noon, HNK Rotterdam Alexander
Press page —

Metrics

Valuation  
Market cap € 335.931M
Market cap (USD) $ 375.067M
P/E -34.31
PEG —
P/BV 0.52
P/S 4.55
P/OCF 8.39
P/FCF 7.87
Dividend yield 4.3%
Turnover / mcap —
Returns  
ROE -1.5%
ROI -1.0%
ROIC -1.0%
Profit margin -13.3%
Growth  
Revenue growing Yes
Profits growing No
Revenue up 3y No
Revenue up 5y —
Earnings growth 3y (net profit CAGR) —
Quality  
Profitable No
Margin expanding No
Buying back stock Yes
Diluting (TTM) —
Debt/Equity 50.4%
Podcast bulls (TTM) Sign up
Podcast bears (TTM) Sign up
Podcast sentiment (TTM) Sign up
Podcast sentiment % (TTM) Sign up
News sentiment (TTM) 0
Quality score -23.5%
Insiders  
Buys, 1w Sign up
Buys, 1m Sign up
Buys, 1y Sign up
Sells, 1w Sign up
Sells, 1m Sign up
Sells, 1y Sign up

Sign up to see this company's insider trades

Figure FY 2025 FY 2024 FY 2023 FY 2022 FY 2021 FY 2020 FY 2019 FY 2018 FY 2017 FY 2016 FY 2015 FY 2014 FY 2013 FY 2012 FY 2011 FY 2010 FY 2009
Revenue 73.873M 72.731M 71.199M 71.309M 77.507M — — — — — — — — — — — —
Net profit -9.79M 12.372M -142.37M -31.37M 120.961M — — — — — — — — — — — —
Free cash flow — — — 42.696M 36.192M — — — — — — — — — — — —

Figure FY 2025 FY 2024 FY 2023 FY 2022 FY 2021 FY 2020 FY 2019 FY 2018 FY 2017 FY 2016 FY 2015 FY 2014 FY 2013 FY 2012 FY 2011 FY 2010 FY 2009
Share price 22.45 19.94 20.45 — 33.8 31.98 35.6 34.5 — 3.8 — — — — — — —
Price performance 12m 0.13 -0.02 — — 0.06 -0.1 0.03 — — — — — — — — — —

Filed figures

Figure Dec 2020 Dec 2021 Dec 2022 Dec 2023 Dec 2024 Dec 2025
Balance sheet detail
Trade receivables (EUR) 2.23M 4.02M 1.4M 3.96M 2.24M 1.6M
↳ YoY growth +80.4% -65.1% +182.5% -43.6% -28.6%
↳ 5y CAGR -6.4%
Borrowings, current (EUR) 1.09M 707,000 79.7M 11M 22.1M 74.7M
Borrowings, non-current (EUR) 365M 389M 286M 334M 324M 283M
Cash and deposits (EUR) 155,000 7.73M 196,000 202,000 8.45M 30.1M
Intangible assets (EUR) 242,000 134,000 72,000 32,000 29,000 11,000
Net debt (borrowings + leases - cash) (EUR) 366M 382M 365M 344M 338M 328M
Cash flow detail
Operating cash flow (EUR) 40M 36.9M 42.8M 41.6M 39.7M 41.6M
Purchases of property, plant and equipment (EUR) -7,000 -743,000 -104,000 — — —
Purchases of intangible assets (EUR) -83,000 -33,000 -31,000 0.00 -21,000 —
Change in receivables (cash effect) (EUR) -7.35M -3.43M 1.67M -626,000 2.63M 648,000
Change in payables (cash effect) (EUR) 4.55M -5.53M -1.89M 3.4M -823,000 2.36M
Dividends paid (cash effect) (EUR) -28.5M -26.9M -30.1M -34.8M -29.9M -21.8M
Income taxes paid (cash effect) (EUR) -8,000 12,000 6,000 -15,000 -2.85M -4.18M
Operating cash flow before change in receivables (EUR) 47.4M 40.4M 41.1M 42.3M 37M 41M
Free cash flow (OCF - PPE - intangibles) (EUR) 39.9M 36.2M 42.7M — — —
Income detail
Total comprehensive income (EUR) -20.4M 121M -31.4M -142M 12.4M -9.79M
Comprehensive income to owners (EUR) -20.4M 121M -31.4M -142M 12.4M -9.79M
Reported May 4, 2022 May 4, 2022 Apr 18, 2023 May 1, 2024 May 13, 2025 Mar 25, 2026

Operating KPIs — quarters

KPI Dec 22 Jun 23 Dec 23 Jun 24 Dec 24 Jun 25 Dec 25 Jun 26
Properties 23.00 14.00 22.00 21.00 23.00 23.00 21.00 21.00
↳ YoY growth 0% -6.7% -4.3% +50.0% +4.5% +9.5% -8.7% -8.7%
Weighted average lease term (years) 4.1 3.3 3.5 4 3.7 3.3 3.2 3.2
Reported — — — — — — — —

Operating KPIs — years

KPI Dec 2021 Dec 2022 Dec 2023 Dec 2024 Dec 2025
Properties 23.00 23.00 22.00 23.00 21.00
↳ YoY growth 0% -4.3% +4.5% -8.7%
Weighted average lease term (years) 4.2 4.1 3.5 3.7 3.2
Reported — — — — —

Sign up to see institutional holdings

Sign Up

Podcast Mentions

Sign up to see podcast mentions and sentiment

Sign Up

Post this release on X

NSI N.V. ("NSI") announces the commencement of its share buyback programme, pursuant to which NSI intends to repurchase a maximum of 976,045 ordinary shares, representing 5% of its outstanding shares excluding treasury shares, for a maximum aggregate consideration of 20 million euro.

The purpose of the share buyback programme is to reduce the number of outstanding shares.

The share buyback programme will commence on 15 October 2026 and will run until the earlier of 31 March 2027, the acquisition of 976,045 shares or the aggregate consideration reaching 20 million euro. The programme is being carried out pursuant to the authority granted by the General Meeting of Shareholders on 17 April 2026.

The share buyback programme will be executed by an independent financial intermediary, which will make its trading decisions independently of NSI and within the predetermined parameters of the programme. The programme will be executed in accordance with applicable laws and regulations, including Regulation (EU) No 596/2014 on market abuse ("MAR") and Commission Delegated Regulation (EU) 2016/1052.

NSI will provide regular updates on the progress of the share buyback programme and will publish the required transaction information on the Share Buyback Programme section of nsi.nl, in accordance with applicable disclosure requirements.

Participation of First Sponsor Group

In connection with the share buyback programme, First Sponsor Group will, at its own request, proportionally sell part of its current shareholding in NSI in order to maintain its percentage interest at its current level of approximately 29.98% and below 30% of NSI's outstanding shares. This is consistent with the standstill arrangements in paragraph 4 of the Relationship Agreement between NSI and First Sponsor Group dated 16 August 2024, which is available on NSI's corporate website.

On each trading day on which shares are repurchased in the market under the share buyback programme, the independent financial intermediary will also execute the purchase by NSI of a corresponding number of shares from First Sponsor Group. The number of shares purchased from First Sponsor Group will be determined in accordance with an agreed formula based on the number of shares purchased in the market on that trading day, so that First Sponsor Group sells shares in the same proportion as the reduction in the shares held by all other shareholders

The price per share paid to First Sponsor Group will be equal to the average price per share paid by NSI for the corresponding open-market purchases on that trading day.

Based on First Sponsor Group's shareholding at the commencement of the programme, a maximum of 292,626 shares may be repurchased from First Sponsor Group. Shares repurchased from First Sponsor Group form part of, and do not come in addition to, the overall maximum of 976,045 shares under the share buyback programme.

Transactions with First Sponsor Group will be reported separately in NSI's regular updates on the share buyback programme.

This press release is published by NSI N.V. and contains inside information within the meaning of Article 7(1) of Regulation (EU) No 596/2014 on market abuse.

This press release contains certain forward-looking statements which are based on NSI’s current expectations and assumptions and are subject to risks and uncertainties that may cause actual results or events to differ materially from those expressed or implied by such statements. Forward-looking statements speak only as of the date of this press release. NSI undertakes no obligation to update or revise any forward-looking statements, except as required by applicable law.

Post this release on X

We are pleased to present our Q3 2026 trading update. Highlights of the report are:

  • Leasing healthy across most of the portfolio, vacancy remains concentrated at Vivaldi II (Amsterdam) and Newtonweg (Leiden)
  • Scaling HNK at HNK Amsterdam Houthavens, HNK Utrecht CS and expanding to Noon and Glass House in Amsterdam
  • Noon development progressing; Glass House planned redevelopment start at end of H1 2027
  • 5% share buyback programme commencing today, running until the end of Q1 2027
  • Full-year EPRA EPS expected to end up around low end of stated range of €1.80-1.90, reflecting slower leasing at Vivaldi II and the impact of the emergency escape route issue at Atlanta

Share buyback programme
Further details on the share buyback programme commencing today, 15 October 2026, are available in a separate press release, found here.

Downloads

pdf Report (PDF)

Prompts

NSI N.V. (ticker NSI), listed in Netherlands.

ETFs Holding NSI N.V.

ETF Weight in ETF Shares Market value As of
VGSR 0.03% 7,443 $ 147.046K Jun 30, 2026
AVRE 0.02% 10,663 $ 203.579K Nov 16, 2026
DFGR 0.01% 27,956 $ 538.311K Nov 12, 2026