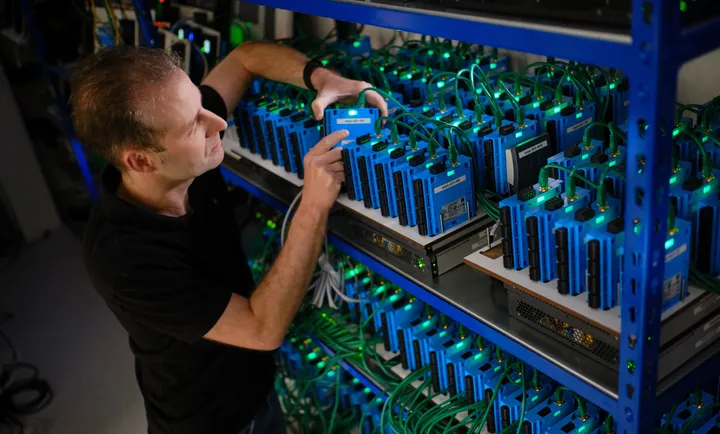
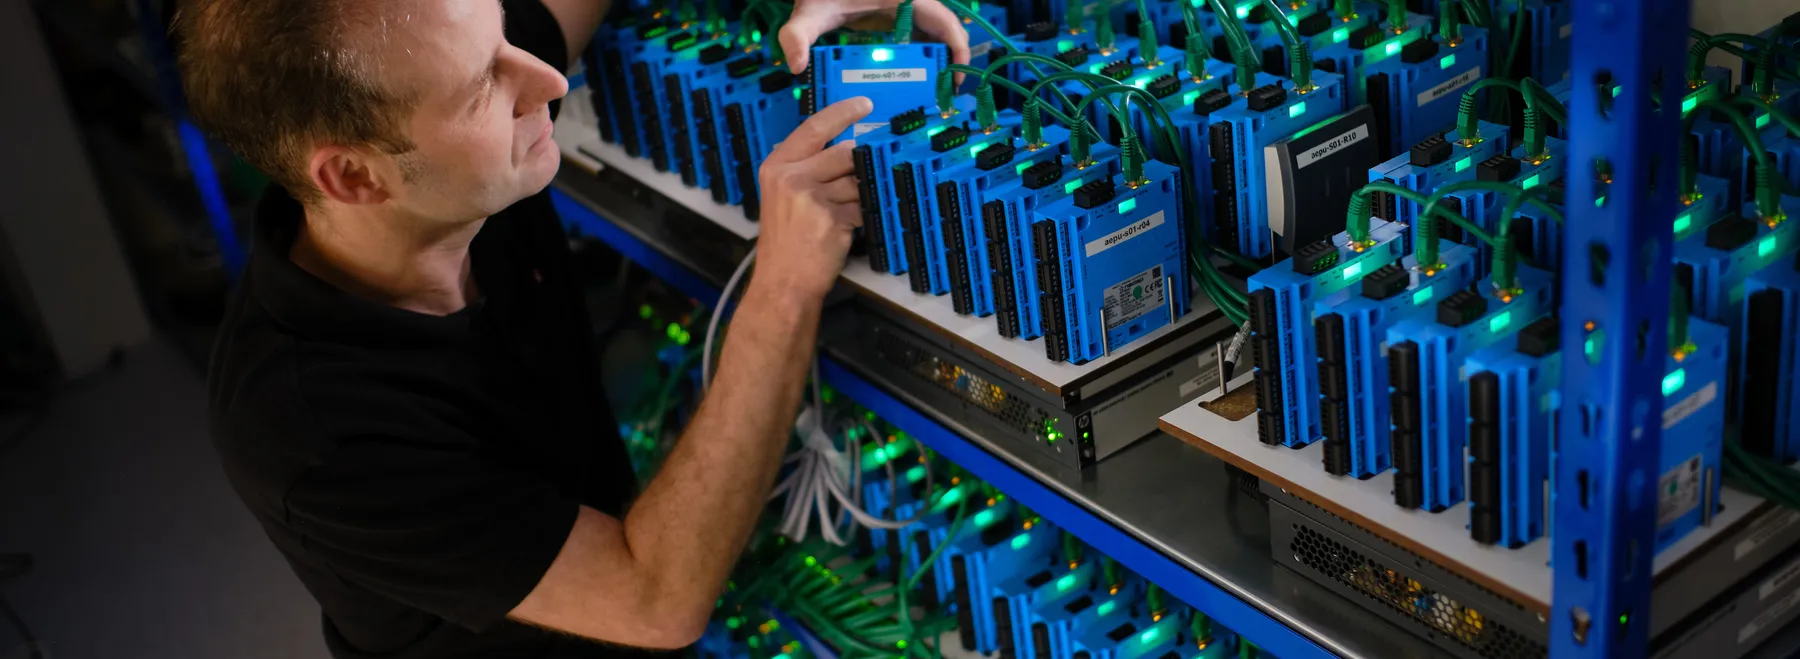
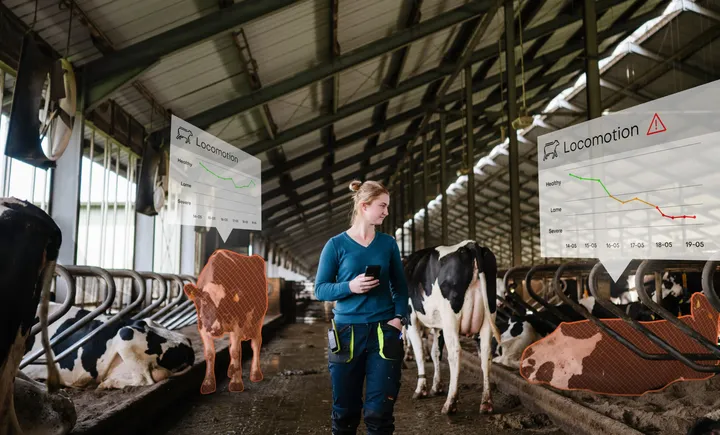
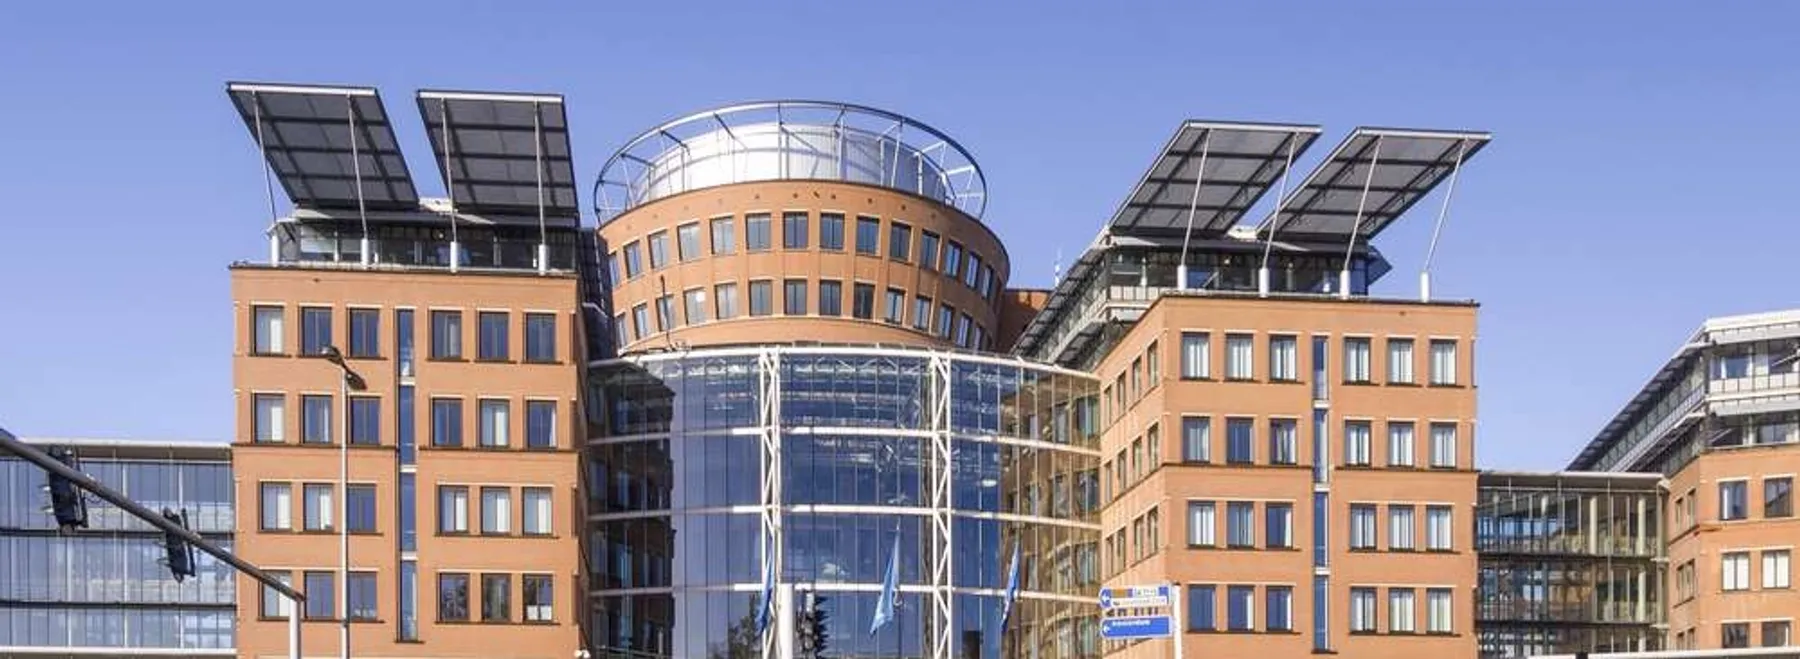
Nedap N.V. is a technology company that provides Digital Twin solutions across Healthcare, Retail, Livestock, and Security sectors. The firm utilizes a technology stack built on IoT, RFID, Vision, and SaaS to offer real-time insights for operational optimization and risk management. Founded in 1929 as Nederlandsche Apparatenfabriek, the company transitioned from electromechanics to electronics in the 1950s and pioneered RFID technology in the early 1970s. Nedap shifted its focus from hardware to software-oriented solutions around 2000. Its business units include Library Solutions, which was the first to apply High Frequency RFID technology in practical applications. The company serves customers in professional environments, contributing to their operational workflows through data-driven decision-making tools.

Summarised from the company's own disclosures, fiscal year ended Dec 2025

Industry Information Technology Services Homepage nedap.com
Sector Technology IR page nedap.com/en/investors
Tags
digital twin technology, rfid, internet of things, vision systems, saas, healthcare technology, retail technology, livestock management, security systems, library solutions, Nedap
Press page nedap.com/en/news

Metrics

Valuation  
Market cap € 580.634M
Market cap (USD) $ 641.716M
P/E 23.63
PEG 2.48
P/BV 6.49
P/S 3.06
P/OCF 19.16
P/FCF 15.88
Dividend yield 3.6%
Turnover / mcap —
Returns  
ROE 28.4%
ROI 27.6%
ROIC 28.1%
Profit margin 8.8%
Growth  
Revenue growing Yes
Profits growing Yes
Revenue up 3y No
Revenue up 5y No
Earnings growth 3y (net profit CAGR) 9.5%
Quality  
Profitable Yes
Margin expanding Yes
Buying back stock No
Diluting (TTM) —
Debt/Equity —
Podcast bulls (TTM) Sign up
Podcast bears (TTM) Sign up
Podcast sentiment (TTM) Sign up
Podcast sentiment % (TTM) Sign up
News sentiment (TTM) 0
Quality score 11.1%
Insiders  
Buys, 1w Sign up
Buys, 1m Sign up
Buys, 1y Sign up
Sells, 1w Sign up
Sells, 1m Sign up
Sells, 1y Sign up

Sign up to see this company's insider trades

Figure FY 2025 FY 2024 FY 2023 FY 2022 FY 2021 FY 2020 FY 2019 FY 2018 FY 2017 FY 2016 FY 2015 FY 2014 FY 2013 FY 2012 FY 2011 FY 2010
Revenue 279.813M 251.606M 262.426M 230.559M 207.012M 189.916M 191.549M 191.403M 182.185M 185.959M 180.875M 177.193M 173.696M 171.874M 152.345M 133.558M
Net profit 24.586M 18.527M 21.641M 18.704M 18.284M 13.751M 24.127M 17.072M 28.035M 10.779M 4.652M 17.881M 9.807M 13.505M 10.989M 8.765M
Free cash flow 36.555M 17.974M 19.144M 7.924M 19.161M 22.113M — — — — — — — — — —

Figure FY 2025 FY 2024 FY 2023 FY 2022 FY 2021 FY 2020 FY 2019 FY 2018 FY 2017 FY 2016 FY 2015 FY 2014 FY 2013 FY 2012 FY 2011 FY 2010
Share price 86.4 49.5 57.6 49.5 56.34 45.9 43.65 37.26 40.06 33.86 26.97 27.38 26.78 19.74 19.74 18.11
Price performance 12m 0.75 -0.14 0.16 -0.12 0.23 0.05 0.17 -0.07 0.18 0.26 -0.02 0.02 0.36 0 0.09 —

Filed figures

Figure Dec 2020 Dec 2021 Dec 2022 Dec 2023 Dec 2024 Dec 2025
Balance sheet detail
Trade receivables (EUR) 28.2M 34.5M 43.6M 36.6M 40.6M 43.4M
↳ YoY growth +22.6% +26.2% -16.1% +11.1% +6.7%
↳ 5y CAGR +9.0%
Borrowings, current (EUR) 80,000 0.00 0.00 — — —
Borrowings, non-current (EUR) 14M 14M 14M 14M 14M 0.00
Lease liabilities (EUR) 2.32M 2.42M 2.11M 1.79M 1.74M 4.42M
Cash and deposits (EUR) 25.7M 29.6M 17.5M 10.2M 4.36M 3.38M
Intangible assets (EUR) 2.21M 1.81M 2.85M 10.2M 13.7M 13.7M
Net debt (borrowings + leases - cash) (EUR) -9.26M -13.2M -1.38M 5.64M 11.4M 1.05M
Cash flow detail
Operating cash flow (EUR) 30.3M 28.3M 17.7M 29.8M 28.9M 44.5M
Purchases of property, plant and equipment (EUR) -8.19M -9.12M -9.74M -10.7M -10.9M -7.96M
Purchases of intangible assets (EUR) -485,000 -712,000 -1.85M -7.7M -4.18M -2.12M
Change in receivables (cash effect) (EUR) 2.35M -6.37M -8.26M 6.84M -3.88M -3.26M
Change in inventories (cash effect) (EUR) 5.44M -404,000 -4.88M -11.2M 7.2M 1.52M
Change in payables (cash effect) (EUR) -524,000 5.79M 2.8M -826,000 -505,000 1.63M
Dividends paid (cash effect) (EUR) -14.6M -14.6M -19.6M -19.7M -21.1M -21.2M
Interest paid (cash effect) (EUR) -271,000 -323,000 -306,000 -675,000 -950,000 -658,000
Income taxes paid (cash effect) (EUR) -3.22M -5.62M -3.98M -4.97M -5.75M -2.84M
Share-based compensation (EUR) 84,000 1.97M -550,000 575,000 -1.81M 2.61M
Operating cash flow before change in receivables (EUR) 28M 34.7M 25.9M 23M 32.7M 47.8M
Free cash flow (OCF - PPE - intangibles) (EUR) 21.6M 18.4M 6.07M 11.4M 13.8M 34.4M
Income detail
Total comprehensive income (EUR) 13.4M 18.7M 18.8M 21.3M 19M 23.4M
Comprehensive income to owners (EUR) 13.4M 18.7M 18.8M 21.3M 19M 23.4M
Reported Mar 16, 2022 Mar 16, 2022 Feb 28, 2023 Feb 27, 2024 Mar 6, 2025 Mar 4, 2026

Sign up to see institutional holdings

Sign Up

Podcast Mentions

Sign up to see podcast mentions and sentiment

Sign Up

News

Skip to main content

Revenue up 13%, operating margin up to 12.1%

July 16 • 2 min read

Financial

All key markets contributing to revenue growth

Key points

  • Revenue increased by 13% to €152.0 million (H1 2025: €134.9 million). Revenue in key markets grew by 14%.
  • Recurring revenue increased by 17% (H1 2025: 11%) and accounted for 42% of total revenue (H1 2025: 40%).
  • Operating profit increased to €18.3 million (H1 2025: €13.8 million). Operating margin grew to 12.1% (H1 2025: 10.3%).

Rob Schuurman, CEO: “Halfway through the year, we remain on track with our Step Up! strategy. Revenue grew across all four key markets in the first half of the year, with Livestock making a large contribution to this growth. Recurring revenue continued to grow, reflecting the increasing adoption of our Digital Twin Technology solutions in customers' core business processes, and its rising share in our revenue mix improved underlying profitability.”

Outlook

We expect revenue growth in the second half of 2026 compared to the second half of 2025, supported by growing customer adoption across our markets. We remain focused on sustainable long-term growth and will continue to invest accordingly, with particular emphasis on Nedap's technology platform, AI, and cybersecurity. Geopolitical developments and market conditions may affect the pace of revenue growth during the remainder of the year.

Download the full press release here: Half-year figures 2026 Nedap N.V.

Rianne Jans

Rianne Jans

CFO

Sytze Loor

Sytze Loor

Head of Communications

Related news

Nedap launches Nedap Way: secure building access with its next-generation reader line

September 22

Press release

Access

Reader

+1

May 12

Nedap expands presence in Saudi Arabia with new office

Access

Mayke Nagtegaal appointed to the Supervisory Board

June 23

Corporate

Nedap proposes to appoint Mayke Nagtegaal to Supervisory Board

May 8

Corporate

June 9

Nedap expands partnership with Albert Heijn with mobile access

Access

Revenue up 14.3% in the first quarter of 2026

April 7

Financial

September 22 • 2 min read

Press release

Access

Reader

+1

A better way to access, designed around the people who use, install, and manage access systems every day

Nedap (AMS:NEDAP), a global leader in Digital Twin Technology and access management solutions, announces the launch of Nedap Way, its new reader line for secure building access. The portfolio brings a clear, intuitive user experience, while giving organizations and their partners the flexibility to evolve their access systems over time.

Access control is increasingly software-driven, but the reader at the door remains the point where technology meets people. It is the point where a person presents a credential, receives feedback, and either moves on or needs to try again. That moment should feel simple and certain, even when the underlying access environment is complex.

Nedap Way was designed with this experience in mind. The reader line combines secure access, flexible credential support, and smooth integration with new and existing systems. It enables organizations to create an access experience that fits their environment today, while providing a future-ready foundation for tomorrow.

“When we started developing Nedap Way, we looked first at the people around the reader,” says Edwin Grobbink, Head of Devices for Security at Nedap. “Our aim was to create readers that are easy to install, configure, and manage, while making the interaction clear and intuitive for every user. Access should feel straightforward: people should know where to present their credential and understand the feedback they receive.”

The Nedap Way portfolio consists of Way Base, Way Keypad, and Way QR. The three readers share a consistent design language and user experience, supporting everyday building access, visitor access, and high-security applications.

For installation and business partners who design access solutions, Way makes it easier to meet each customer’s needs. It supports a wide range of credentials, works alongside existing infrastructure and third-party solutions, and provides a consistent approach across the portfolio. Whether a customer is modernizing step by step or planning a new environment, Way gives them the freedom to move forward at their own pace.

Nedap Way extends Nedap’s access offering from the perimeter to the building, while integrating smoothly with a wide range of access control systems.

Access, the Nedap Way.

Jun Song

Jun Song

Content marketer

Security

Lisan Westerik

Lisan Westerik

Marketing specialist

Security

Skip to main content

Total revenue down 8%, recurring revenue up 20% in first half of 2024

July 18, 2024 • 2 min read

Financial

Revenue amounted to €124.1 million in the first half of 2024, 8% less than in the first half of 2023 and recurring revenue was up 20% and accounts for 39% of total revenue (30% in the first half of 2023).

Other key points

  • Added value in percentage of revenue increased to 71% (H1 2023: 69%).
  • Operating profit decreased to €10.6 million (H1 2023: €16.1 million) in the first half of 2024.
  • The operating margin was 8.5% (H1 2023: 12.0%).
  • Nedap expects revenue growth in the second half of 2024.

Ruben Wegman, Nedap CEO: "As indicated earlier, the first half of 2024 started slower compared to the same period in 2023. The catch-up effect that boosted our revenue in the first half of 2023 has tapered off. Additionally, softening market conditions within Livestock and Retail have lasted longer than anticipated. While we continue to invest in growth, we are mindful of the temporary slowdown in revenue development and tempered the hiring of new talent in the first half of 2024. The upward trend in our recurring revenue continued, resulting in a higher added value as a percentage of revenue and reducing volatility in revenue development. We are confident in the long-term outlook for our key markets and foresee revenue growth in the second half of the year compared to the same period last year."

Outlook

We foresee revenue growth for the second half of the year compared to the same period in 2023. Due to ongoingvolatility, primarily in the livestock market, it is too early to predict the impact on the revenue growth for the yearas a whole. We reiterate our Step Up! financial ambitions, including an EBIT margin growing toward 15%, albeitwith a potential one-year delay.

Download the full press release here: 2024 Half-year figures Nedap N.V.

Sytze Loor

Sytze Loor

Head of Communications

Related news

Nedap launches Nedap Way: secure building access with its next-generation reader line

September 22

Press release

Access

Reader

+1

June 9

Nedap expands partnership with Albert Heijn with mobile access

Access

Revenue up 13%, operating margin up to 12.1%

July 16

Financial

Nedap expands presence in Saudi Arabia with new office

May 12

Access

June 23

Mayke Nagtegaal appointed to the Supervisory Board

Corporate

Nedap proposes to appoint Mayke Nagtegaal to Supervisory Board

May 8

Corporate

Prompts

Nedap N.V. (ticker NEDAP), listed in Netherlands.

ETFs Holding Nedap N.V.

ETF Weight in ETF Shares Market value As of

AVDV 0.01% 12,812 $ 1.324M Nov 16, 2026
AVDS 0.01% 439 $ 45.363K Nov 16, 2026
DFIS 0.01% 3,395 $ 364.811K Nov 12, 2026
DXIV 0.00% 106 $ 11.39K Nov 12, 2026
DFIC 0.00% 6,100 $ 655.478K Nov 12, 2026
DFAX 0.00% 4,063 $ 436.592K Nov 12, 2026
DFSI 0.00% 220 $ 23.64K Nov 12, 2026
DFAI 0.00% 2,119 $ 227.698K Nov 12, 2026
AVDE 0.00% 3,810 $ 393.694K Nov 16, 2026