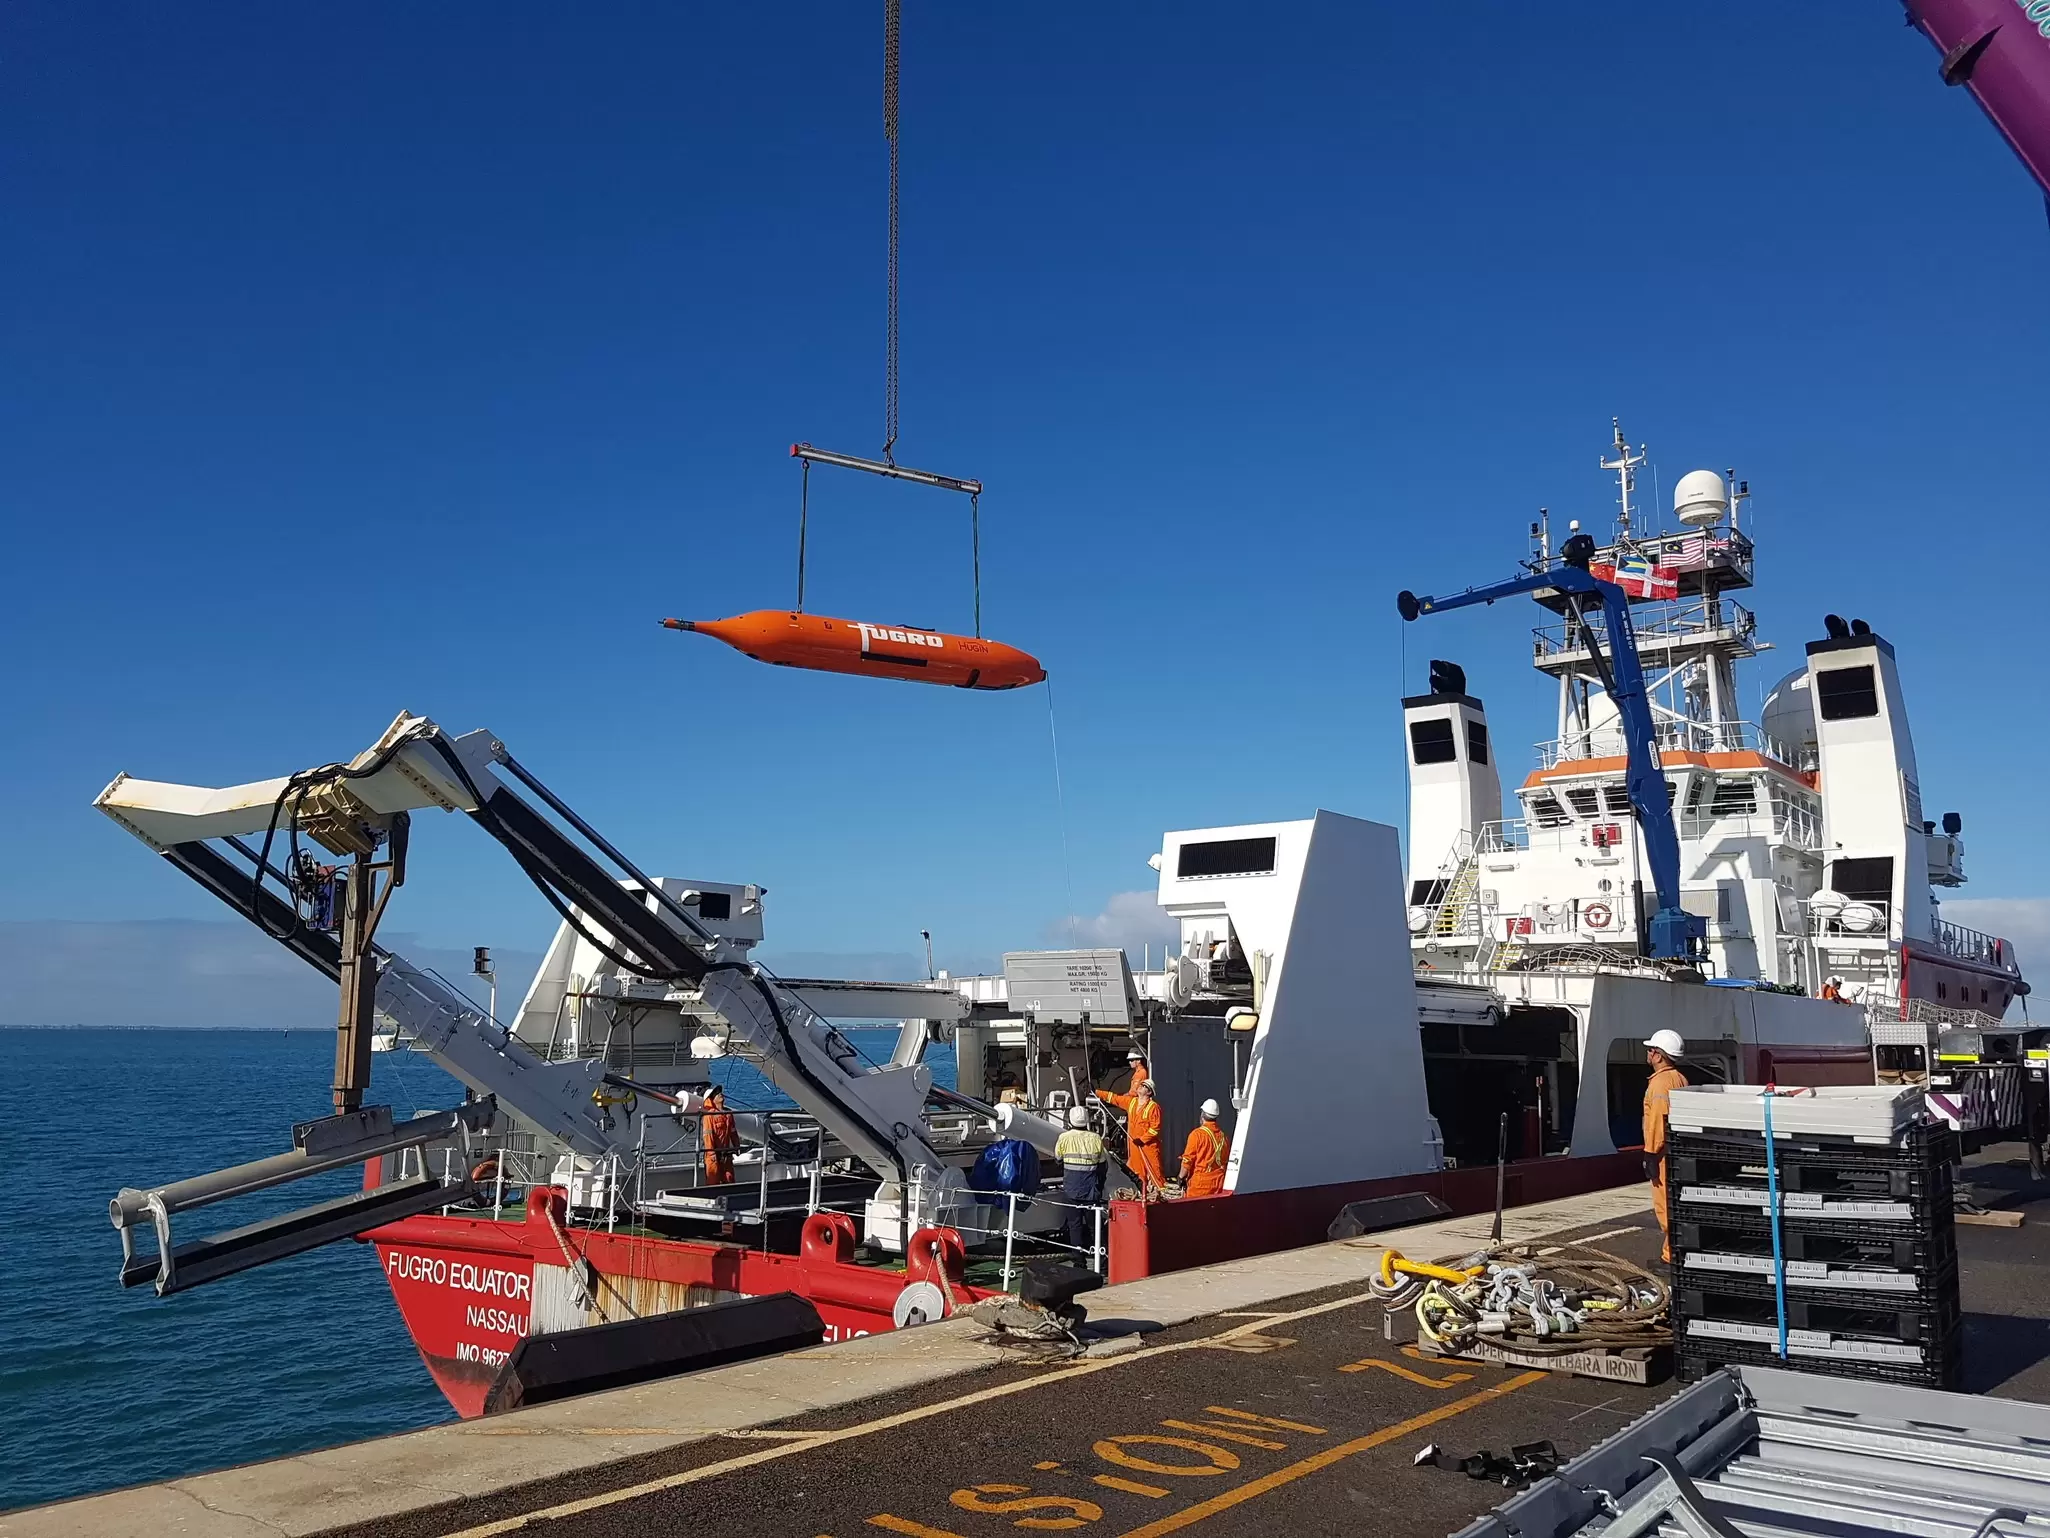
News Long reads Hydrographic surveys vs bathymetric surveys whats the difference
Hydrographic Surveys vs. Bathymetric Surveys: What’s the Difference?
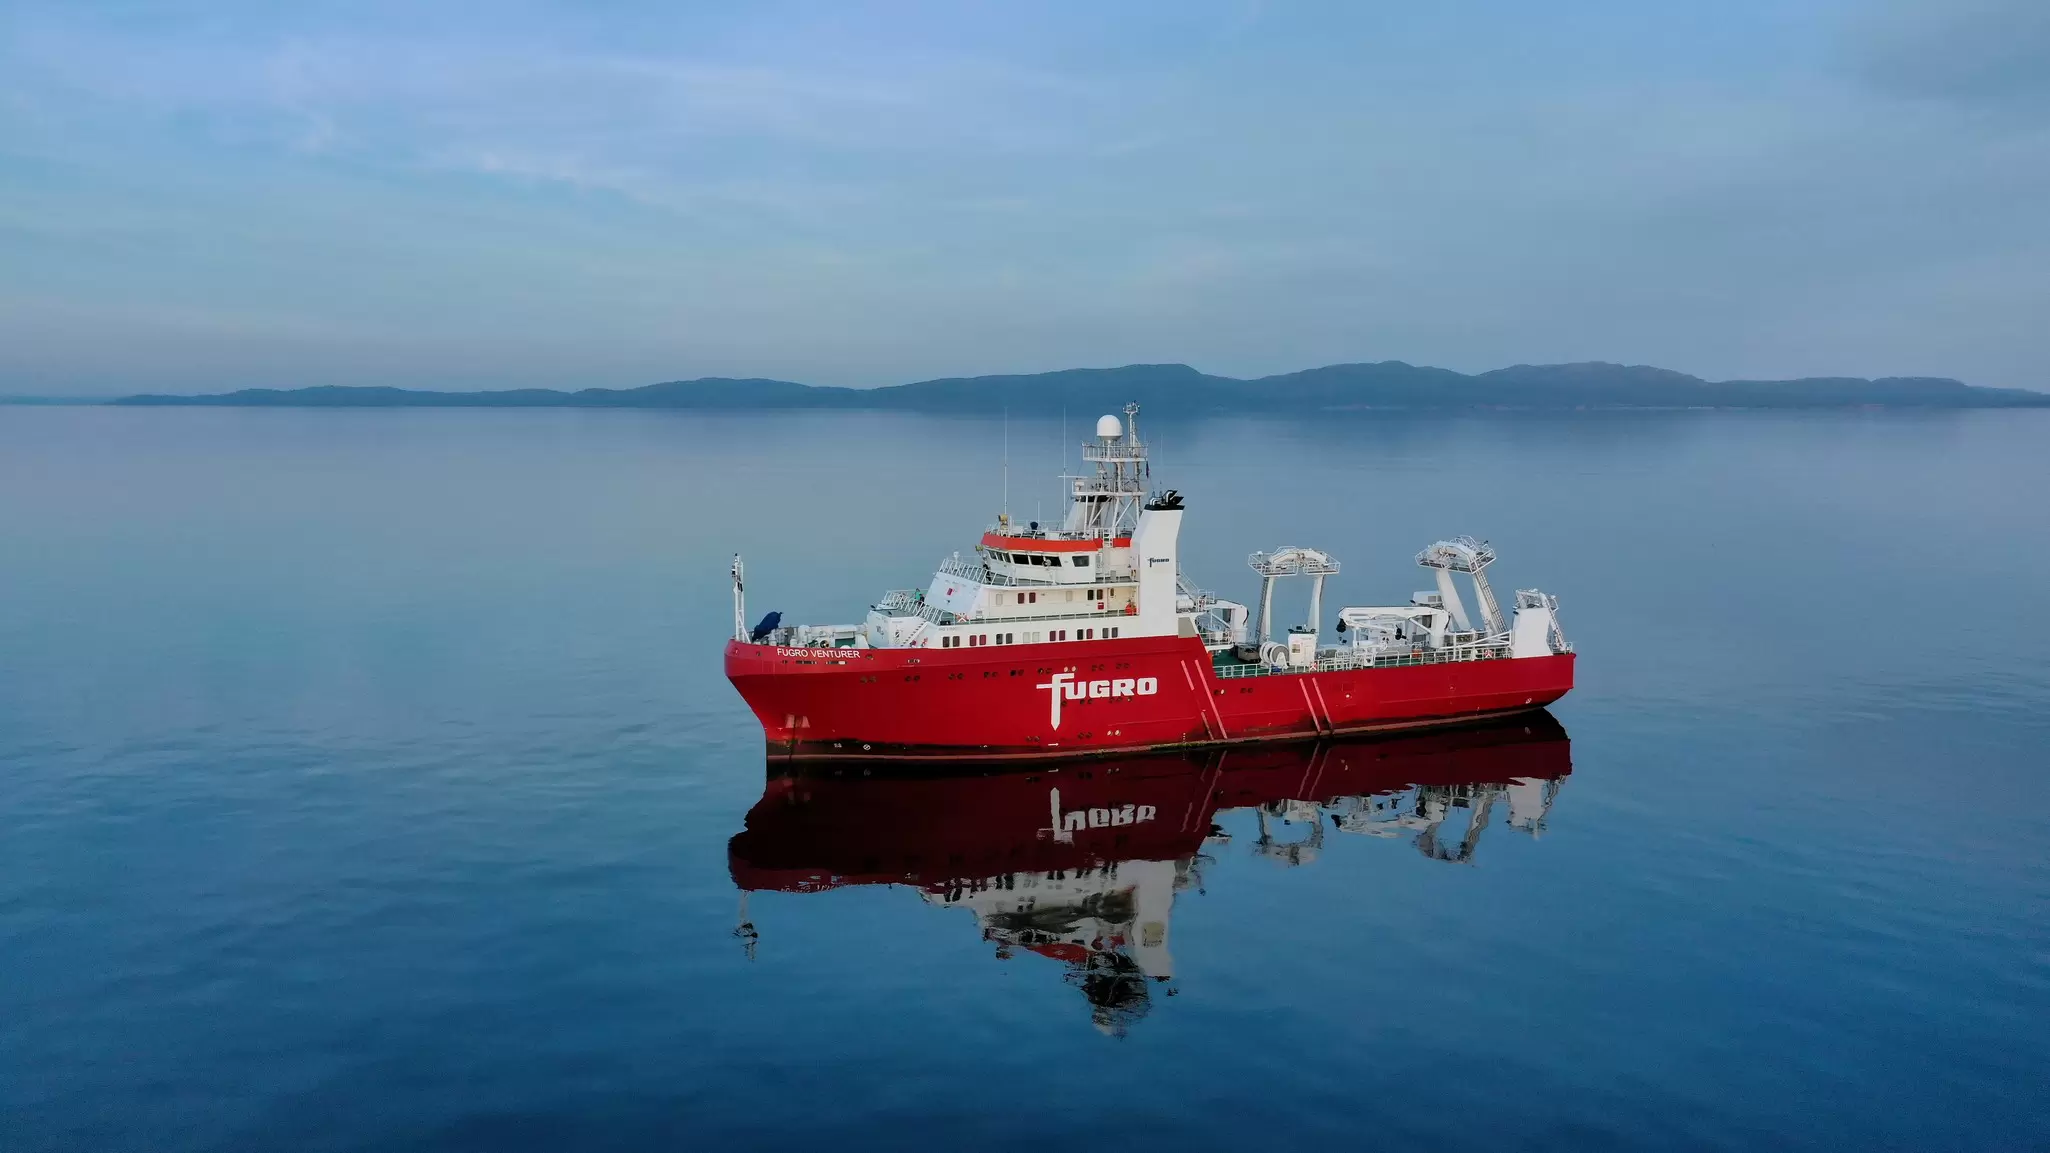
Although hydrographic and bathymetric surveys are closely related, they are not the same. Both involve mapping underwater environments, but they can differ in their scope, the data they collect, and sometimes the equipment used.
If you work in construction, coastal monitoring, or environmental research, understanding the difference between hydrographic and bathymetric surveys is essential. This article explains how the two are connected, where they differ, and how new technologies are transforming both fields.
What are hydrographic surveys?
A hydrographic survey is the process of mapping water bodies and gathering information about their physical characteristics. Depending on the survey objectives, hydrographic data can include information on:
-
Water depth and morphology of the seabed;
-
Natural and man-made seafloor features;
-
Characteristics of the seabed and shallow subsurface layers;
-
Water levels and tides;
-
Current direction and strength;
-
Water column characteristics (temperature, salinity, turbidity);
-
Boundaries of a water body;
-
Interaction of the water body and the surrounding coastline or land.
The purpose of hydrographic surveying is to develop a comprehensive understanding of a water body and its surrounding environment. This information is essential for a wide range of applications, including marine construction, navigation, coastal protection, and resource management.
Construction
Hydrographic data helps engineers identify suitable locations for marine infrastructure. Projects such as bridge foundations, offshore wind farms, and harbours rely on this information to determine safe and stable construction sites.
Navigation
Nautical charts based on hydrographic data help vessel masters to identify safe navigation routes and potential hazards. This allows ships to navigate safely and efficiently, even in unfamiliar waters.
Coastal protection
Hydrographic data helps track changes in coastlines, water levels, and seabed morphology. These insights allow timely actions to reduce flood risk , prevent shoreline erosion, and protect beaches, infrastructure, and coastal ecosystems.
Resource management
Hydrographic information supports the sustainable management of coastal and offshore resources. It can be used to protect marine habitats, monitor water quality, and support the planning and management of marine protected areas.
The wide variety of possible data collected during a hydrographic survey means that no single technology is suitable for every application. The choice of equipment depends on the survey objective, the characteristics of the survey area, and the required level of detail.
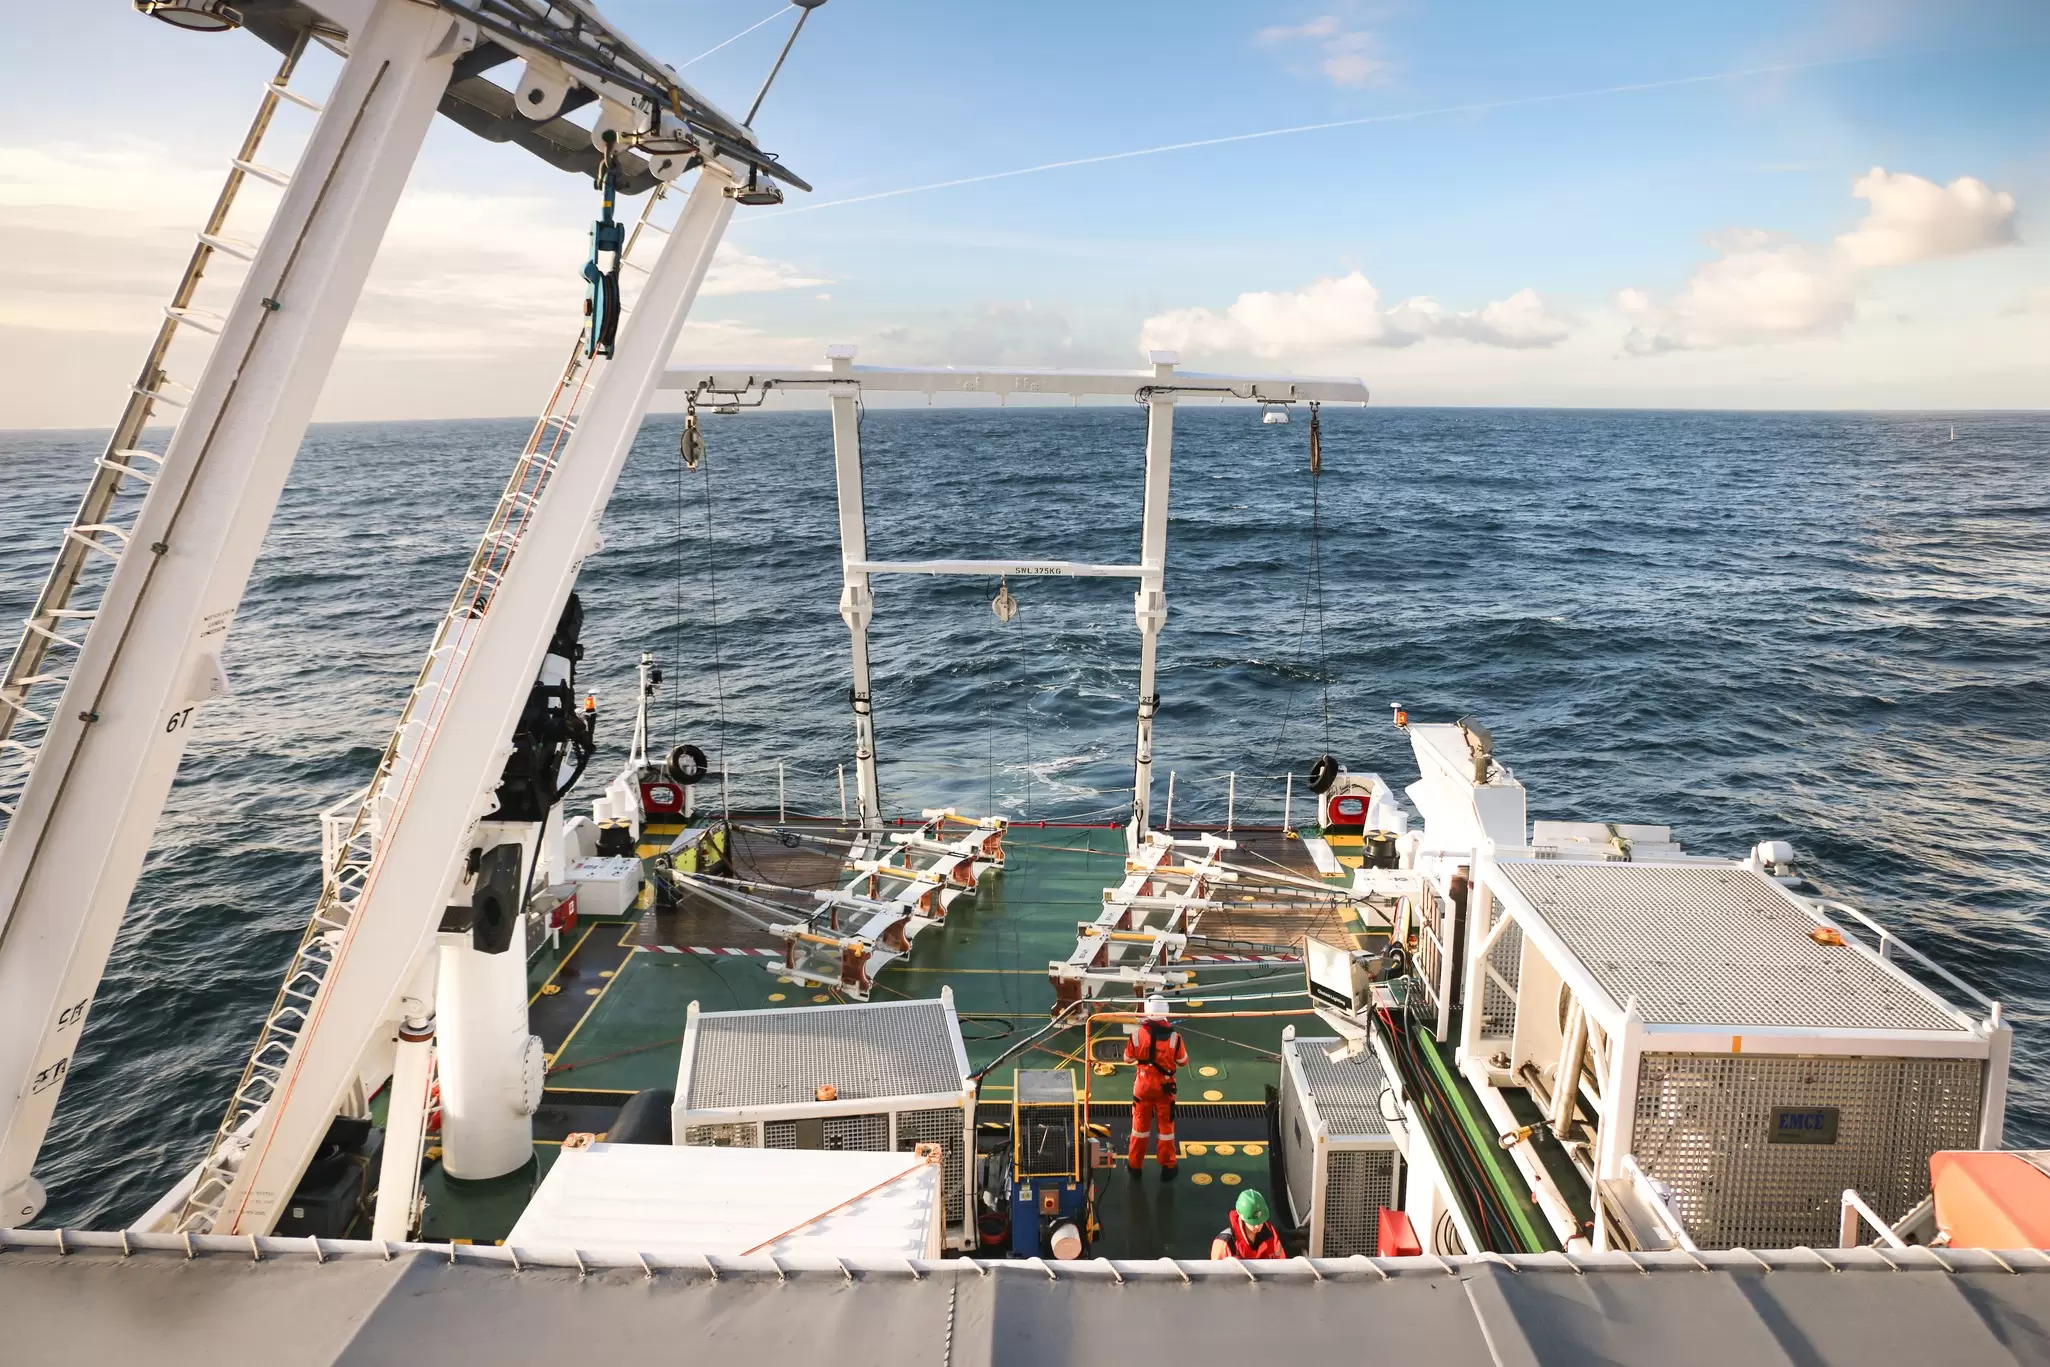
At Fugro, we commonly use hydroacoustic systems such as multibeam echo sounders, side-scan sonars, and sub-bottom profilers to collect hydrographic data. These are typically mounted on survey vessels. In shallow waters, we also use LiDAR systems deployed from aircraft, which use laser light to measure both the water surface and the seabed. In addition, satellite-derived data can be used to obtain hydrographic information over large and remote areas.
Depending on the type of survey and the size of the area, data collection can take a few hours or several months. Analysing hydrographic data and generating charts also takes time. This could be anything from a few days to several weeks.
To summarise, hydrographic surveys provide clear insight into what is going on within a body of water. The process requires high-tech equipment such as echo sounders, LiDAR and satellite data. The type of information collected depends on the requirements of the project, but it could include information about seabed morphology and characteristics, seabed features, water quality, or water level.
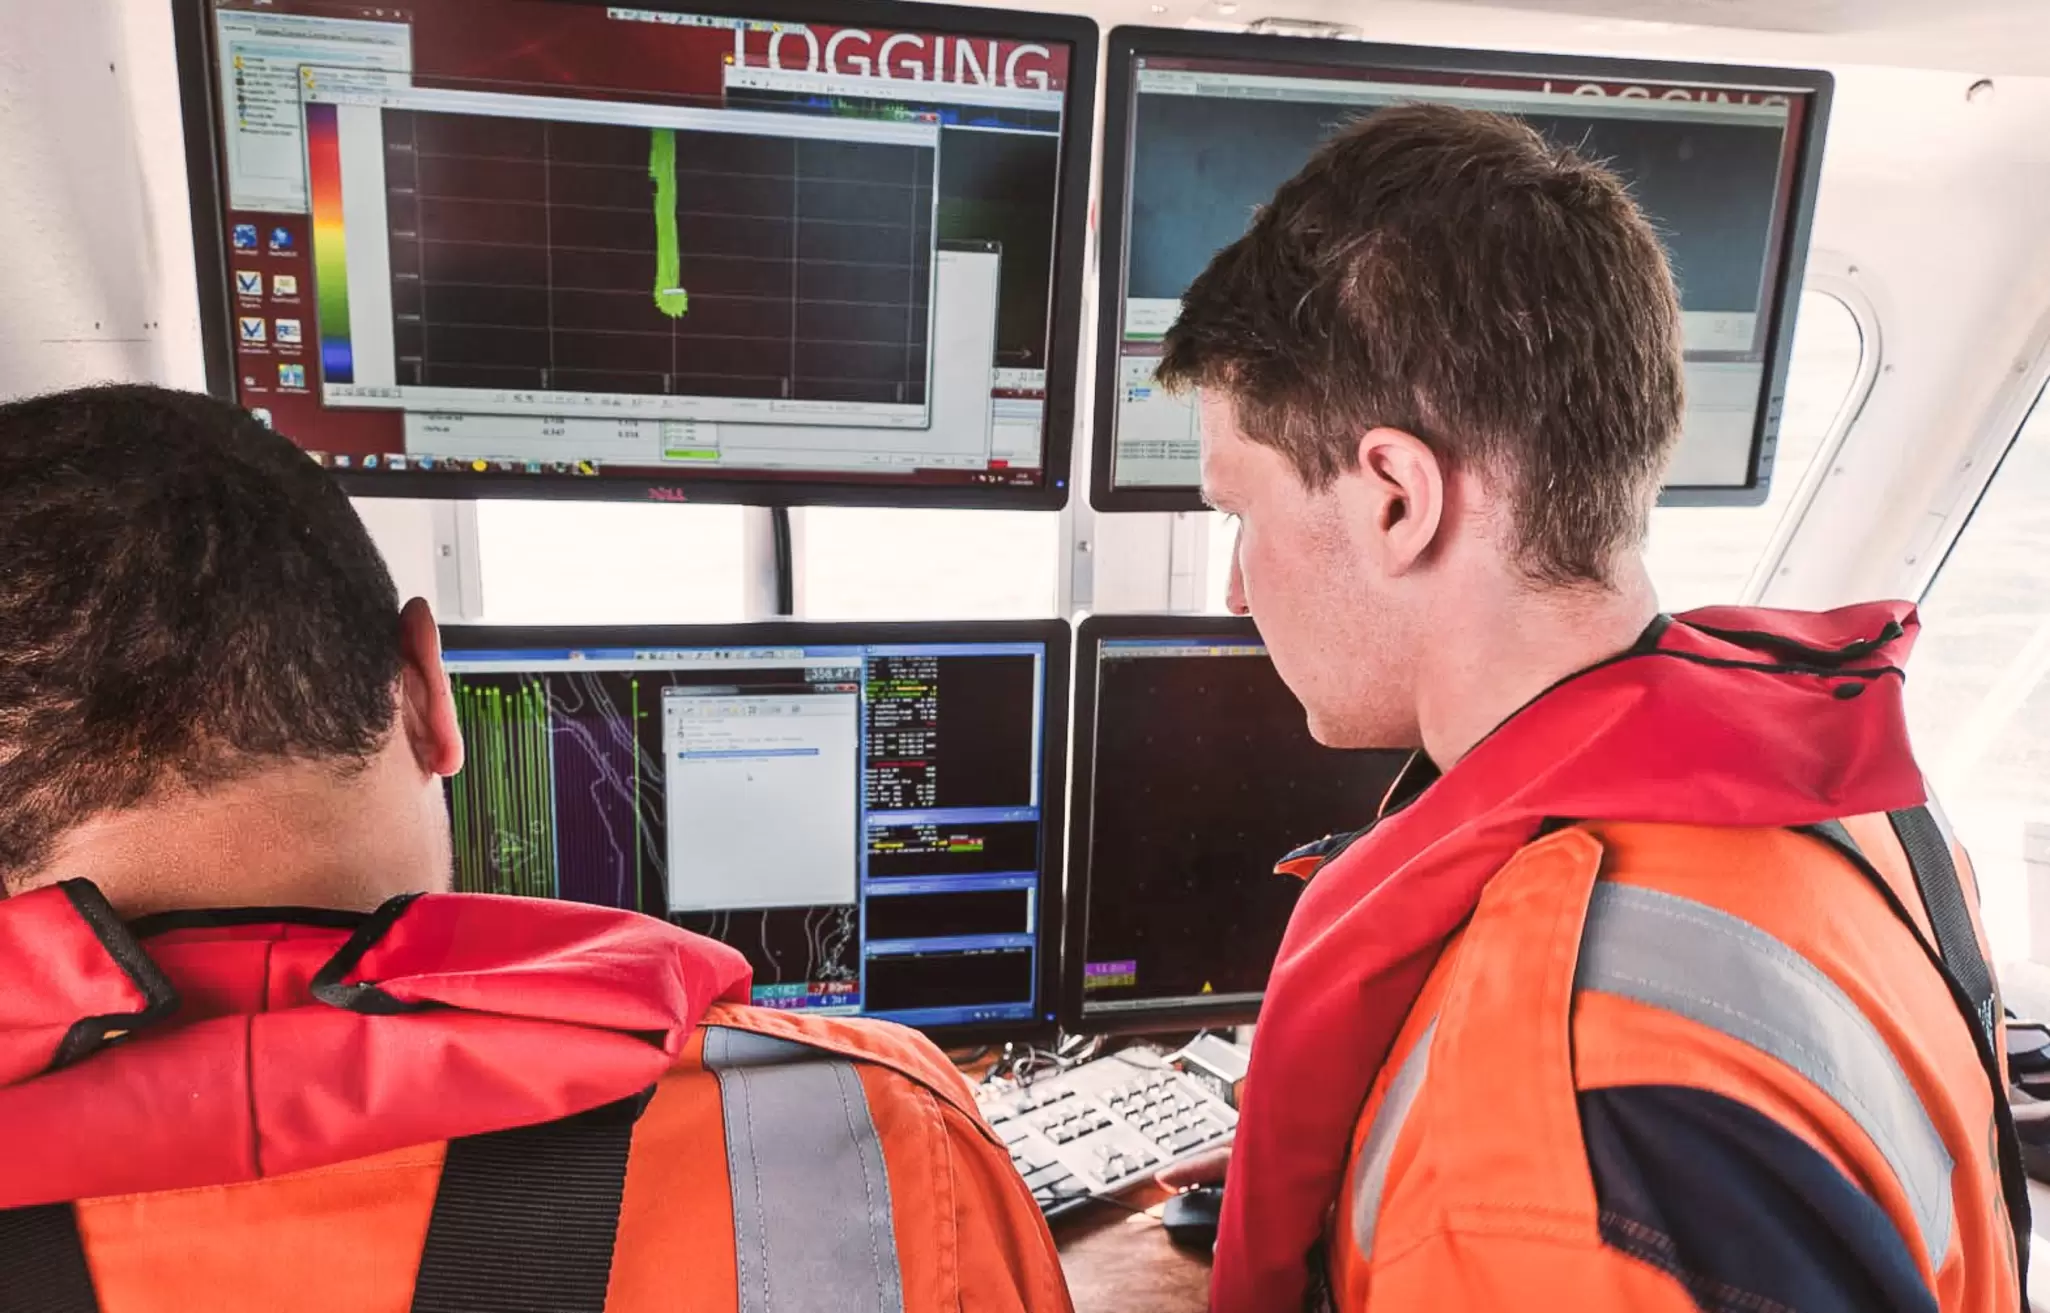
Applied Hydrographic Survey Programme
Hydrography in action
There are countless examples of hydrography in action. If the aim is to investigate whether a specific site is suitable for infrastructure development, only this small area of interest needs to be surveyed. Even for relatively small areas, such as a planned offshore wind farm, a wide range of hydrographic information is required to fully understand the site conditions.
For Sørlige Nordsjø II, an offshore wind development area in the Norwegian North Sea, Fugro used multibeam echo sounders, side-scan sonars, sub-bottom profilers, and magnetometers to map the seabed and investigate its characteristics. On other sites 2D seismic or 3d seismic campaigns are added to the scope of work The collected survey data provide in depth information on water depth, seabed features, and shallow subsurface conditions. Together with geotechnical investigations, these insights help to identify suitable locations for future wind turbine foundations and the conditions underneath the seafloor.
Meanwhile, other marine projects involve mapping entire coastlines. In 2023, Fugro conducted a hydrographic survey of Saudi Arabia’s eastern coastline. The resulting data supported the production of nautical charts, helping to improve the safety of navigation.
In 2025, Fugro mapped seagrass habitats along approximately 7,500 km of the Italian coastline. As seagrass relies on photosynthesis, it is typically found in shallow waters. The maximum depth at which it can grow is strongly influenced by water turbidity. Seagrass meadows provide important habitats for a wide range of marine species, store significant amounts of carbon, and help protect the coastline from erosion.
To map these habitats, Fugro combined data from satellites, airborne LiDAR systems, multibeam echo sounders, and cameras on an autonomous underwater vehicle (AUV) operating close to the seafloor. The various data sets were then combined and analysed using machine learning algorithms to classify different seabed types and identify seagrass habitats.
Perhaps the largest hydrographic mapping effort in terms of geographic extent is the global initiative Seabed 2030, led by the Nippon Foundation and GEBCO. The initiative aims to map the entire ocean floor by 2030 and make the data freely available to the public. To achieve this goal, governmental agencies, research institutes, and survey companies worldwide contribute data to Seabed 2030. As one of the largest private-sector contributors, Fugro provides data collected by survey vessels during transits between project sites. By 2026, Fugro had contributed approximately 3 million km2 of bathymetric data, covering an area nearly the size of India.
What are bathymetric surveys?
The term “bathymetry” originates from the Greek words “bathy” (depth) and “metron” (measure). While hydrographic surveys collect a broad range of environmental data concerning a water body, bathymetric surveys primarily focus on depth measurements and mapping the seafloor morphology.
For bathymetric surveys different equipment in terms of sensors and platforms can be used. Typically echo sounders mounted on manned or unmanned vessels are utilized. But one can also gather data from the air using aircraft or from space using satellites. The most common bathymetric survey technologies therefore include:
-
Echo sounders (mounted on manned or unmanned vessels)
-
Bathymetric LiDAR (deployed using aircraft)
-
Earth observation (satellite-derived bathymetry)
The choice of bathymetric survey technology and platform depends on both the project requirements and the characteristics of the survey area.
First, the required level of detail is important. If you need to map a small area in high detail, a multibeam echo sounder deployed on an unmanned underwater vehicle may be the best option. The closer the sensor is to the seabed, the higher the data resolution, allowing smaller seabed features to be identified in the data. However, surveying close to the seabed means that only a relatively small area can be covered in a given amount of time.
Second, the conditions of the survey area need to be considered. Optical methods such as LiDAR and satellite-derived bathymetry depend heavily on water turbidity. In clear, shallow waters, such as those found in the Caribbean, LiDAR can be very effective. In contrast, it is less suitable for harbours or rivers with high sediment concentrations. In such cases, as well as in deeper waters, acoustic methods are often the better choice.
Accurate bathymetric maps allow us to see what the terrain looks like below the water surface. This is crucial information for several applications.
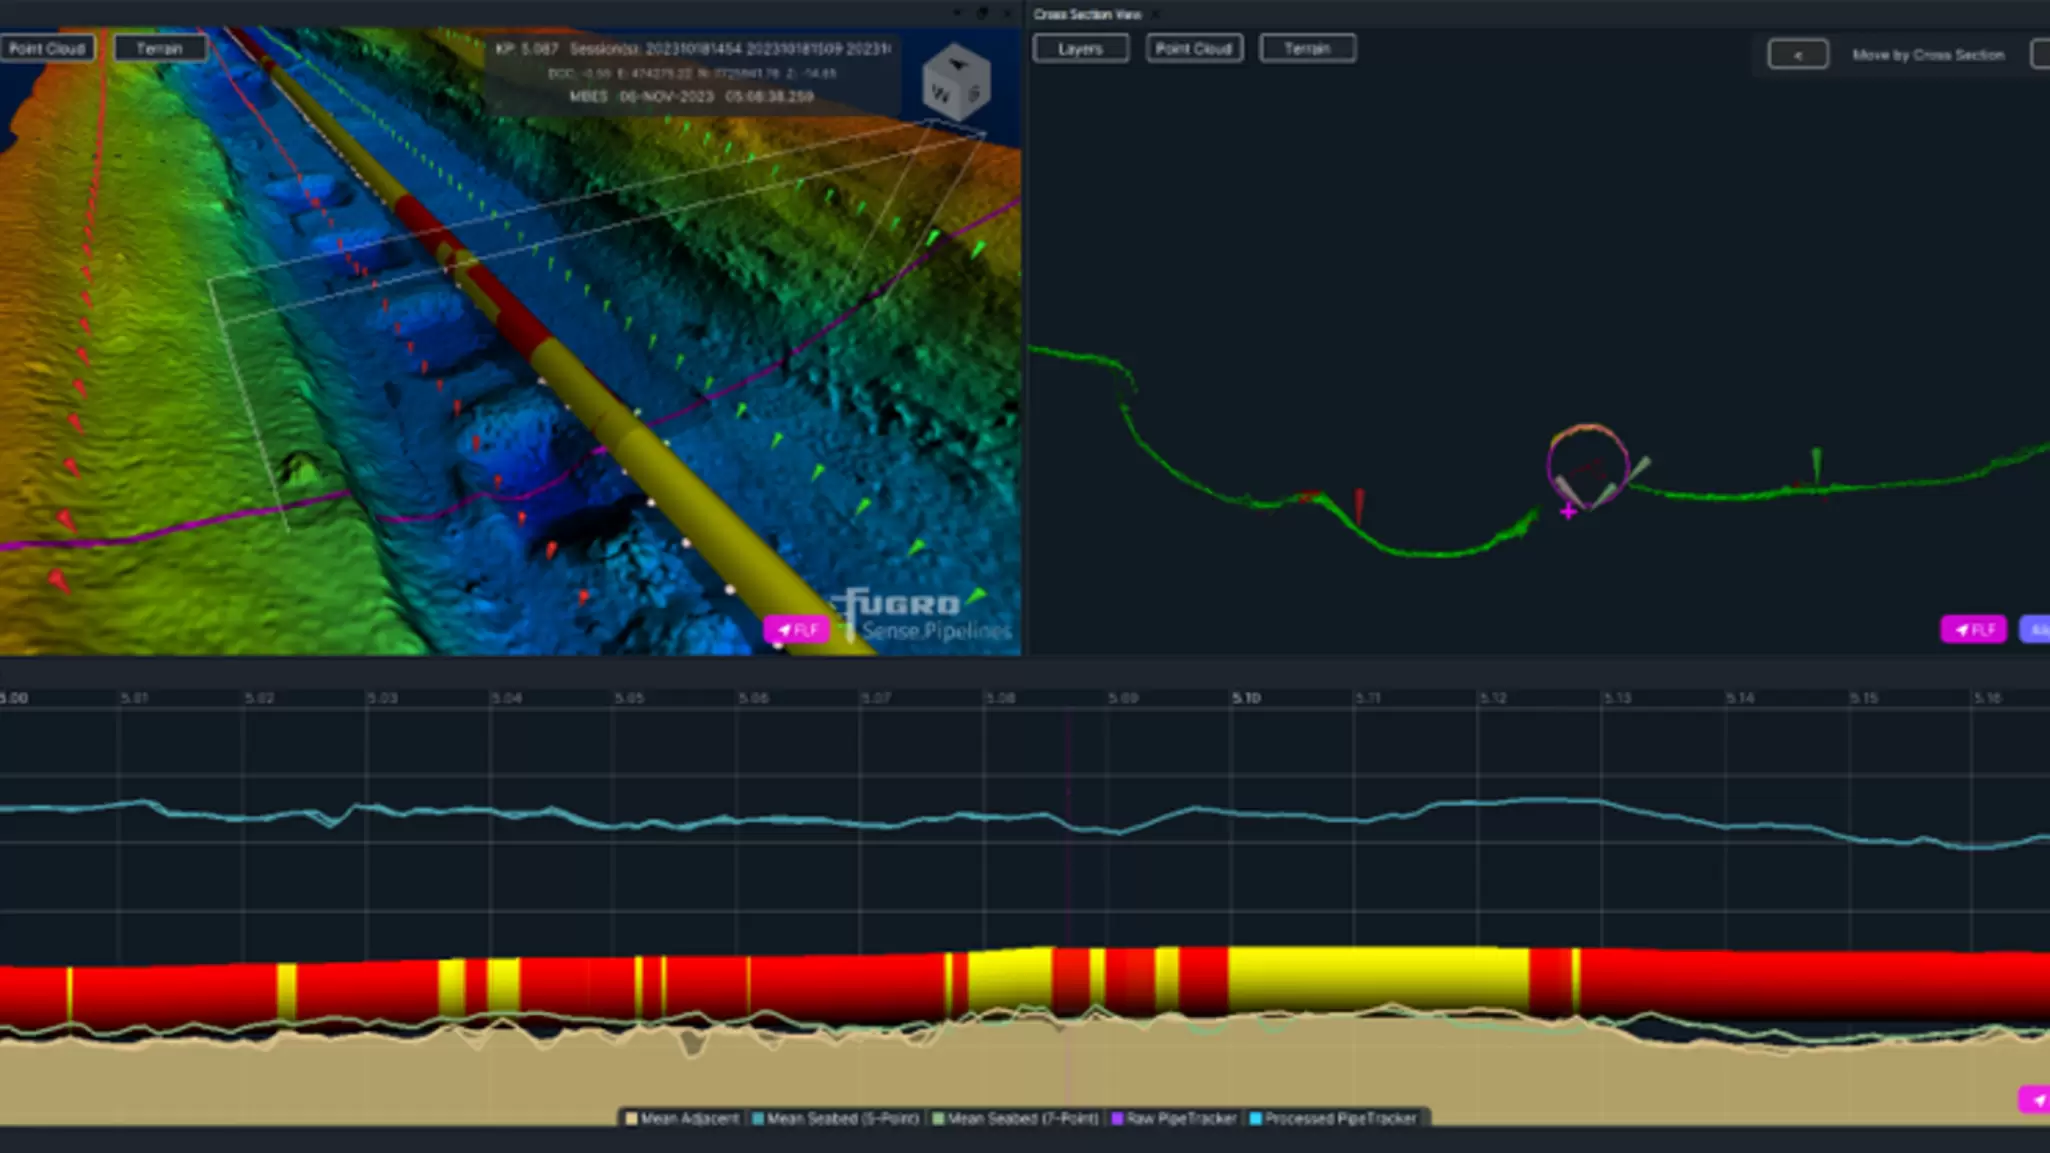
Bathymetric survey data
Key differences between hydrographic and bathymetric surveys
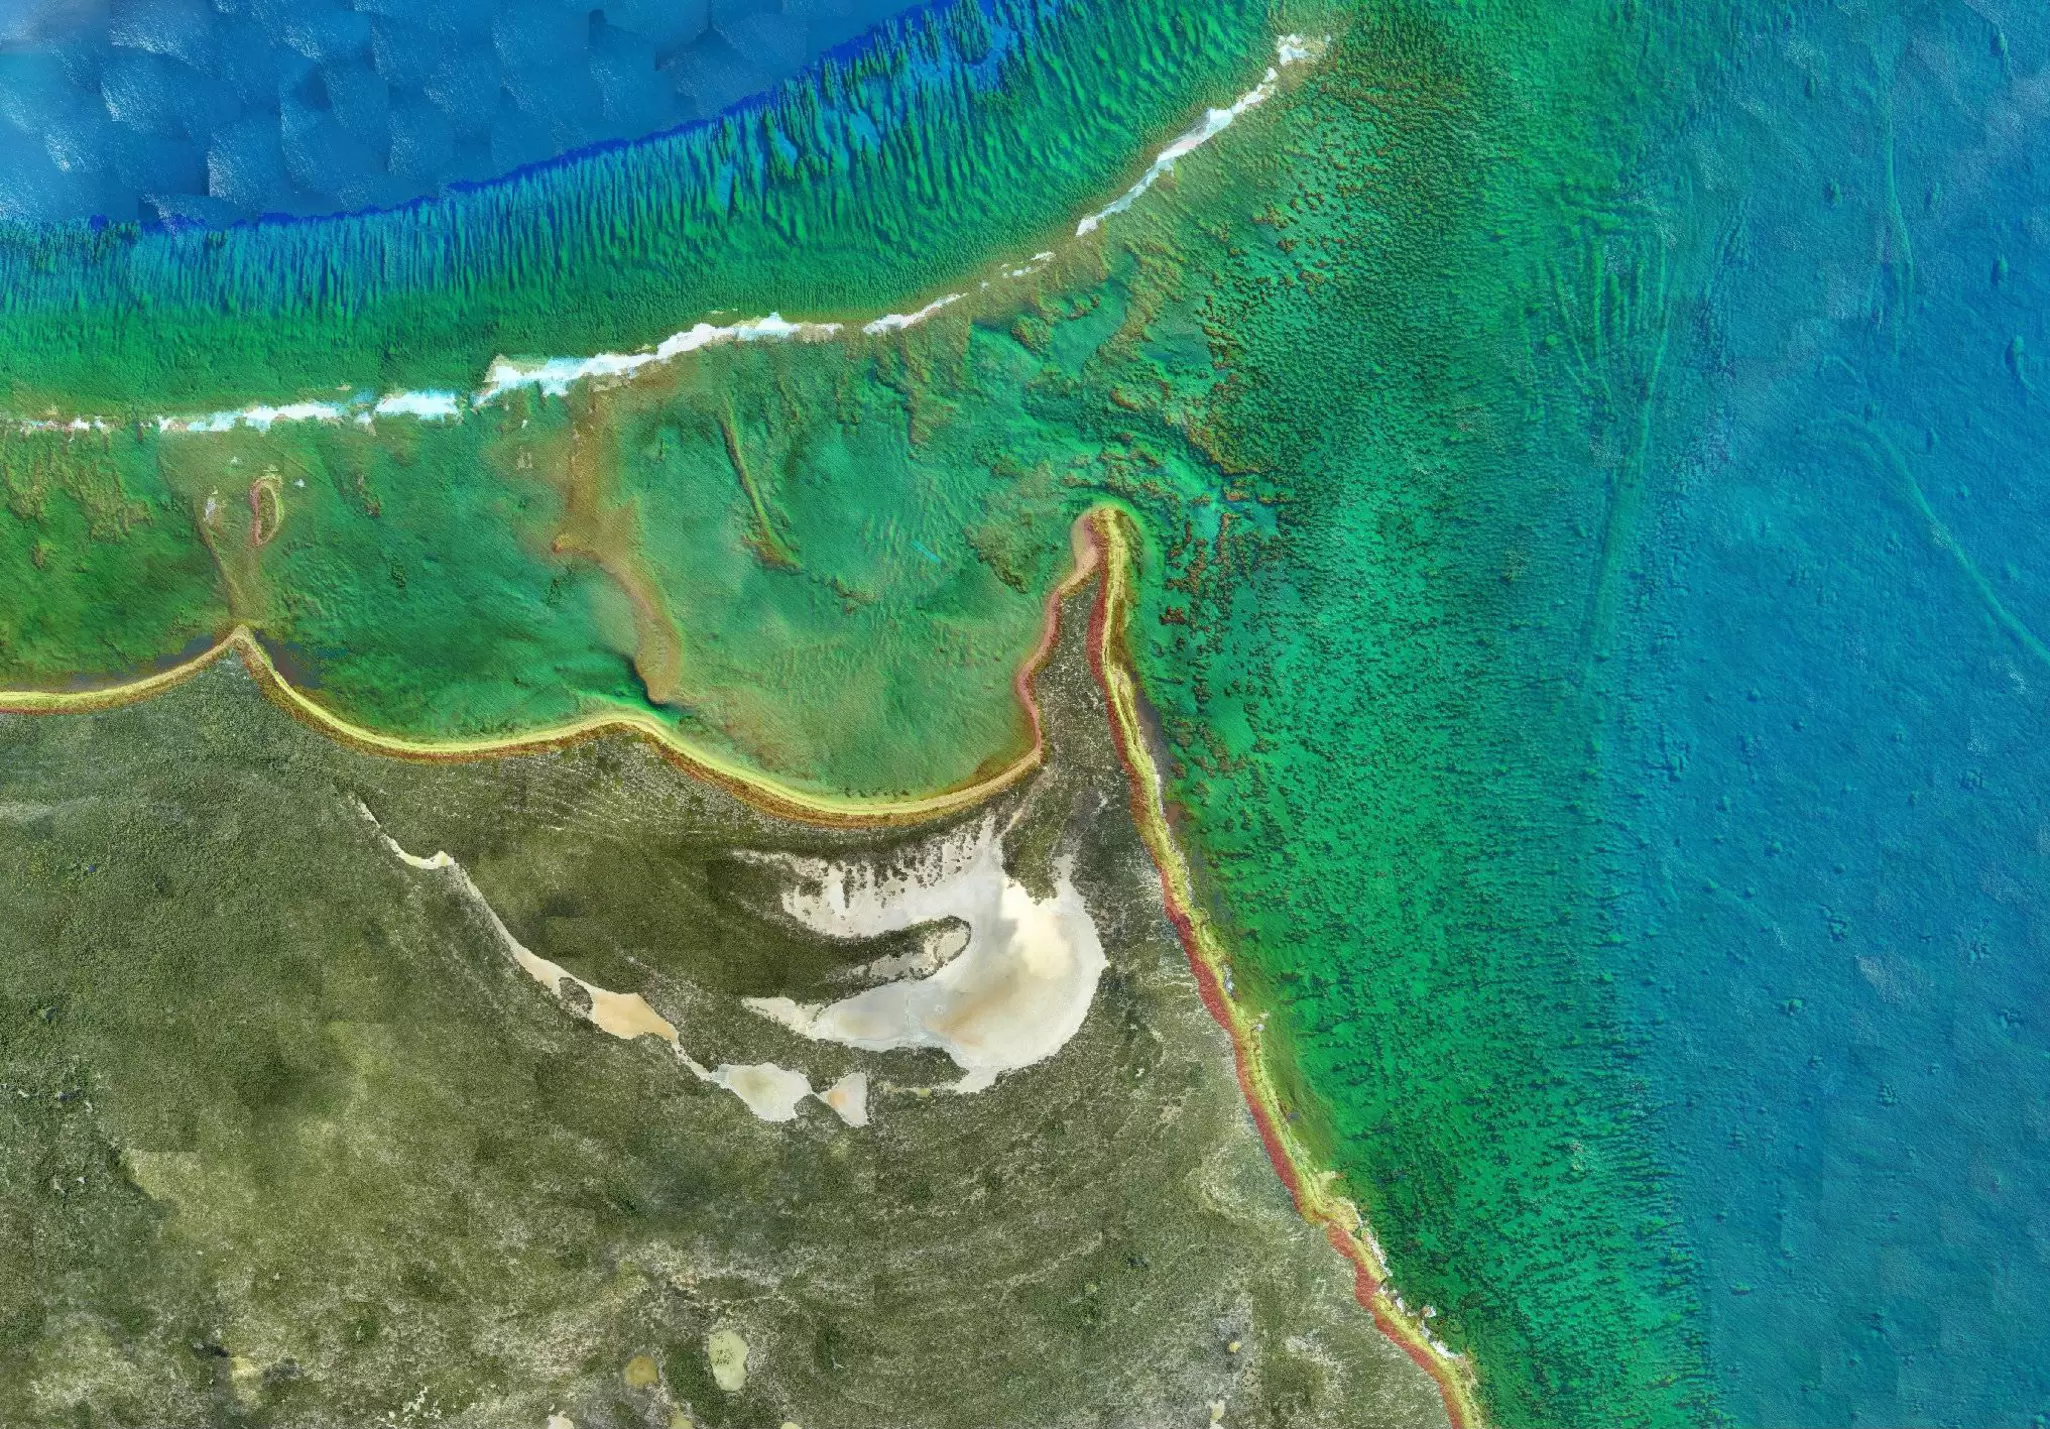
Technically speaking, a bathymetric survey is a specific type of hydrographic survey. Its primary purpose is to map the morphology of the seafloor, resulting in detailed bathymetric maps. They reveal the seafloor shape that is normally hidden beneath the water’s surface.
Hydrography, in contrast, is the broader practice of collecting a wider range of information about water bodies. Most hydrographic surveys include bathymetric data as it is essential for most applications but not for all. For example, if you're only analysing tides or water quality, detailed mapping of the seafloor may not be necessary.
| Feature | Hydrographic Survey | Bathymetric Survey |
| Definition | Broad data collection about water bodies | A focused survey on seafloor depth and terrain shape |
| May Include | Tides, currents, water quality, seabed features, properties of upper seabed layers, water column information | Only depth and underwater morphology |
| Use cases | Offshore construction, coastal planning and protection, environmental monitoring, resource management | Navigation, infrastructure design and monitoring, seabed modelling |
| Subset or parent? | Parent discipline | Subset of hydrography |
Where do the two overlap?
Bathymetry and hydrography have always been closely linked, as bathymetric data is a fundamental component of most hydrographic surveys. However, advances in survey technology are making the distinction between the two increasingly blurred.
Modern bathymetric survey systems can collect far more than water depth measurements alone. Over the past decades, improvements in sensor technology have not only increased the survey accuracy and efficiency but have also expanded the range of information that can be acquired simultaneously.
For example, modern multibeam echo sounders record not only the water depth but also backscatter intensity and water column information. The intensity provides valuable information about the seabed characteristics. It can help to distinguish between soft sediments, sand, gravel, and rock. In water column data, fish schools or gas seeps can be identified.
As these additional data sets are collected simultaneously with bathymetric measurements, the scope of a bathymetric survey increasingly extends into the field of hydrography. As a result, the distinction between bathymetry and hydrographic surveys is becoming less clear as sensor technology advances.
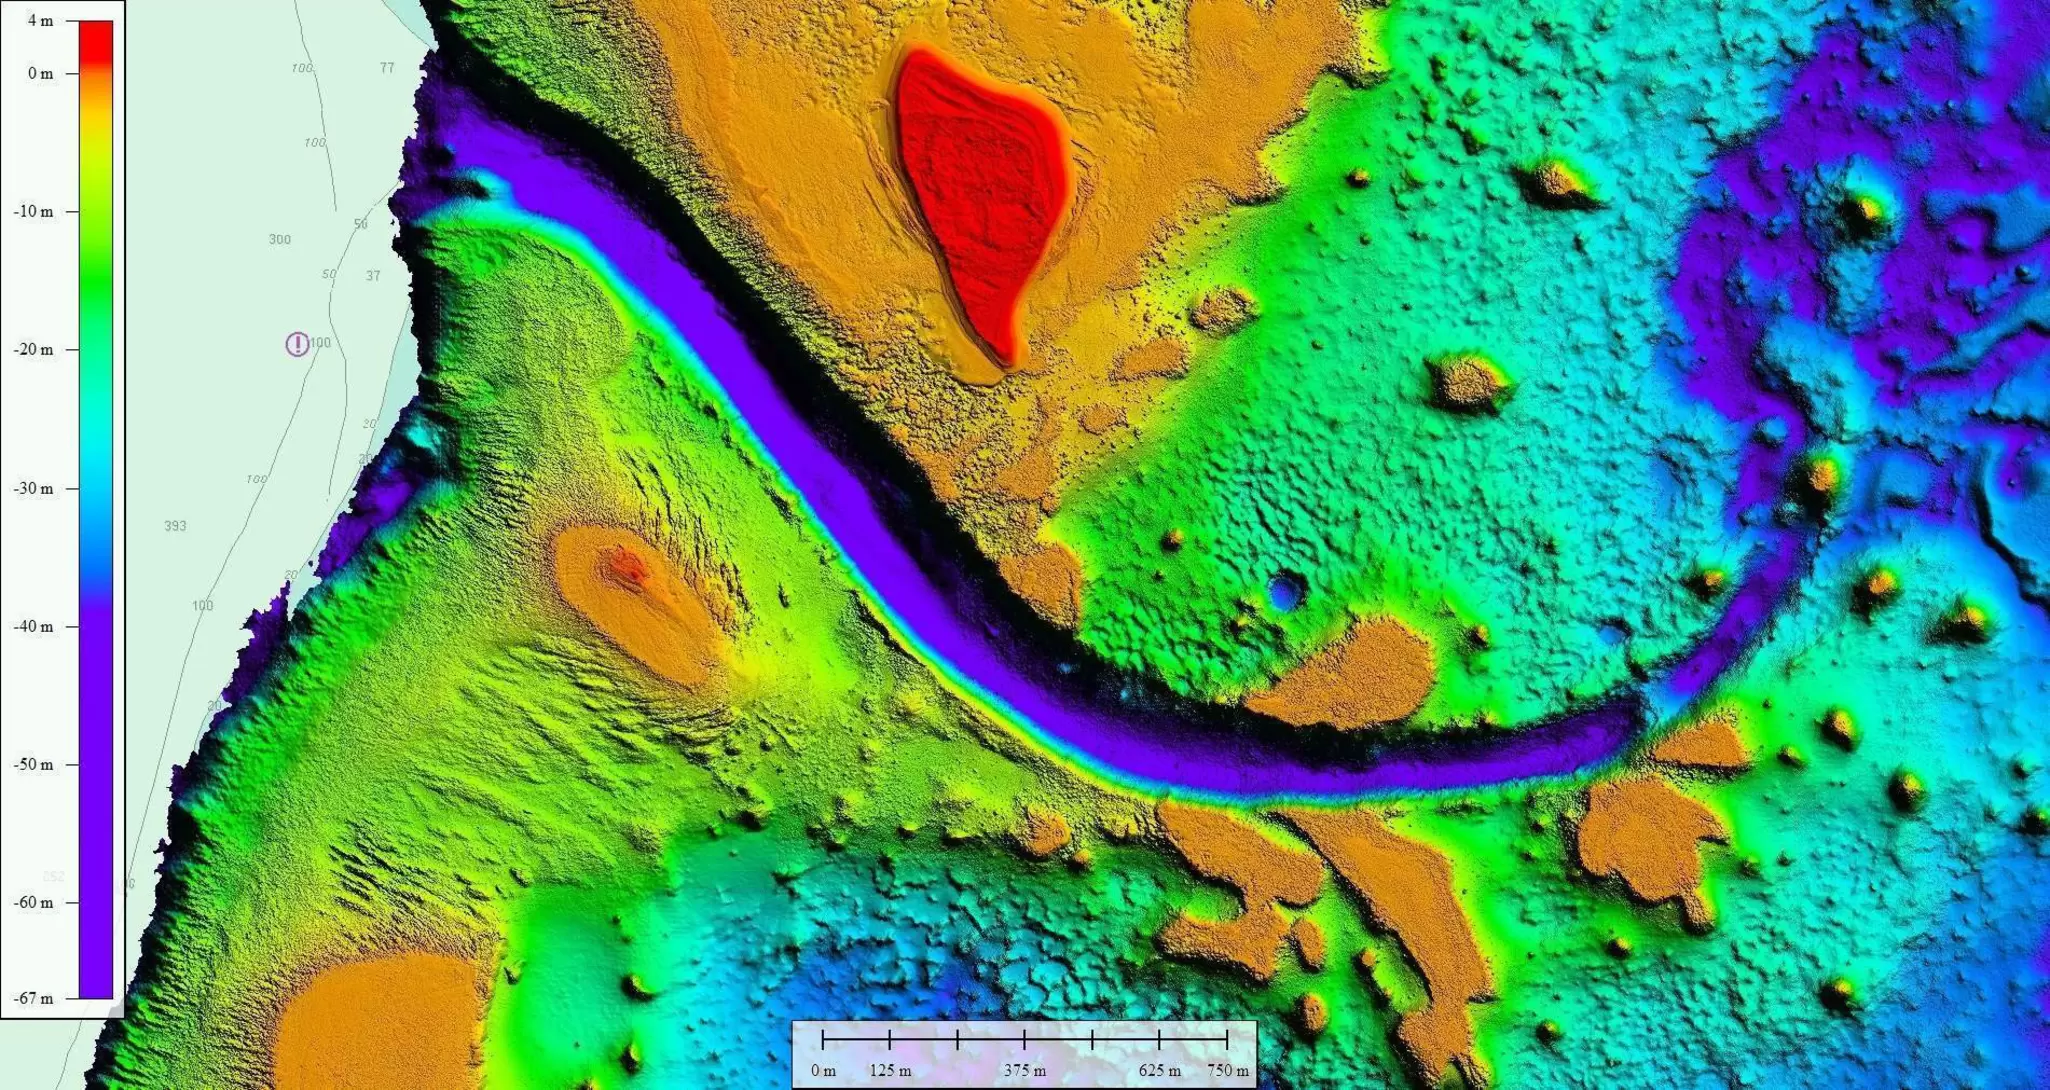
Bathymetric and topo lidar of Tuvalu islands
The future of marine surveying: AI and automation
Since the early days of bathymetric surveying, survey efficiency has increased a lot. When the route for the first transatlantic telegraph cable was surveyed about 170 years ago, it took several expeditions over a period of four years to collect the necessary data. Echo sounders had not yet been invented, so water depth was measured using a lead line: A weight tied to a rope is lowered to the seafloor and when it reaches the bottom, the length of rope indicates the water depth. Today, in comparison, a full deep water bathymetric cable route survey across the Atlantic can be completed in just a few weeks.
The development of the technology is ongoing. AI and automation are increasingly finding their way also in hydrographic surveying. So, what does the future hold for marine surveying?
AI in hydrographic surveying
A major emerging trend is the use of AI. Its implementation improves the efficiency, accuracy, and consistency of hydrographic survey data processing and interpretation. Some of the key applications of AI are:
Feature detection
AI can now identify underwater physical features such as pipelines, wrecks, or boulders faster and more consistently than manual analysis.
Seabed classification
By analysing multibeam bathymetry and backscatter data, AI can classify different seabed types, including sediment, gravel, rock, and vegetation.
Change detection and predictive analytics
Bathymetric maps do not have to be static. AI-powered models can detect changes between repeated surveys and even predict future seafloor changes based on processes such as sediment transport and erosion.
Data processing
Hydrographic surveys can generate a vast amount of data. Traditionally, tasks such as outlier detection, noise removal, and data correction have required significant manual effort. AI algorithms can automate many of these processes, significantly reducing processing times while improving consistency.
Uncrewed and autonomous survey platforms
Another important trend in hydrographic surveying is the increasing use of unmanned survey platforms. Uncrewed Surface Vessels (USVs) and Autonomous Underwater Vehicles (AUVs) are becoming increasingly capable and are transforming the way hydrographic data is collected:
-
Remote Operations: USVs and AUVs can operate for extended periods in remote or hazardous environments while transmitting data in near real-time. Surveyors can monitor the data acquisition remotely from land. The systems are equipped not only with hydrographic survey equipment but also additional sensors to monitor their environment for collision avoidance.
-
Swarm Surveying: Coordinated groups of AUVs can work together to collect high-resolution bathymetric data. They work together on a shared task. This increases the efficiency, as multiple vehicles can survey a larger area in a shorter time than a single platform.
As USV and AUV technologies continue to advance, hydrographic surveys require less time and fewer personnel in the field. As surveys can last days or even weeks, remote operations not only reduce risks to personnel but also make it possible to cover vast areas more efficiently while minimising the environmental impact.
Conclusion: hydrographic surveys vs bathymetric surveys
Although the terms are often used interchangeably, hydrographic and bathymetric surveys are not the same. Bathymetric surveys focus specifically on measuring water depth and mapping seafloor morphology, whereas hydrographic surveys provide a broader understanding of water bodies by incorporating additional information such as tides, currents, seabed characteristics, and water column properties.
In practice, they are closely linked, with bathymetric data forming the foundation of many hydrographic surveys. Advances in survey technology are further blurring the distinction between them, as modern sensors can collect multiple types of data simultaneously.
Looking ahead, innovations such as AI, automation, and unmanned survey platforms are transforming marine surveying. These technologies are improving efficiency, enhancing data quality, reducing operational risks, and enabling larger areas to be surveyed than ever before. As a result, hydrographic surveys will continue to play a crucial role in supporting safe maritime navigation, sustainable resource management, environmental monitoring, and offshore development.
Expertise
Creating a safe and liveable world
Tackling tomorrow’s problems
Subscribe to news alerts
-
Social media