PRESS RELEASE HALF-YEAR REPORT 2026
Acomo reports robust H1 2026 with healthy margin and promising recovery in Edible Seeds US ROTTERDAM (NL), 28 JULY 2026
ACOMO N.V. (Acomo), the Euronext Amsterdam-listed diversified, plant-based food ingredients Group, today reports H1 2026 results. Performance highlights H1 2026: • Second best H1 in the history of the Group • Sales at constant currency down 3% versus a record high H1 2025 comparison • Adjusted EBITDA of €61 million (H1 2025: €67.9 million) with adjusted EBITDA margin of 8.6% (H1 2025: 9.0%) • Continued recovery in Edible Seeds with EBITDA up +22% year on year on a constant currency basis • Strong cash generation with operating cash flow of €56 million • Leverage ratio at 2.9x, with continued strong balance sheet • Interim dividend set at €0.45 per share, equal to prior year • Citromil and Cublend bolt-on acquisitions completed in July, expanding the Group's value-added footprint
% Change
% FX Adjusted Change
758.4
-6%
-3%
67.9
-10%
-7%
H1 2026
H1 2025
Sales
710.7
Adjusted EBITDA1
61.3
Adjusted EBITDA %
8.6%
9.0%
Operating Cash flow
56.1
(28.4)
(in € millions)
1
Non-IFRS financial measure. Refer to Reconciliation of non-IFRS information on page 15
Comments from Allard Goldschmeding, CEO of Acomo:
"This performance, the second-best first half-year result in the history of the Group, demonstrates the underlying strength of our business. In a world where supply chains and market prices are governed by uncertainty, our companies are reliable partners to both suppliers and customers. I am especially pleased by the recovery of our Edible Seeds business in the US, resulting from positive momentum in our Sunbutter® and Wildlife businesses which is underpinned by the actions we have taken to preserve margins. We also continued our growth momentum in the Spices & Nuts segment. Our Organic Ingredients segment is operating in a market with attractive growth potential. The organic cocoa business is proof of this potential and performed strongly against the backdrop of continued price volatility. We also made important investments to capture further growth and efficiencies in this segment, as shown in the acquisition of Citromil in Spain and the insourcing of our juice processing in the US. In addition, the recently completed acquisition of Cublend further strengthens our positioning in the Food Solutions segment. These M&A transactions are fully aligned with our strategy of expanding our capabilities and creating sustainable long-term value. We look forward to working with these businesses and their employees and realizing that value potential together. In the near future the environment is expected to remain uncertain. However, given the expertise of our companies and the initiatives we are taking, including M&A, we remain well positioned for further growth given the long-term market trends and we are on track with our ambitions as laid out in our ‘building routes to healthier foods’ plan."
ROTTERDAM (NL), 28 JULY 2026
1
PRESS RELEASE HALF-YEAR REPORT 2026
Half-year performance
Consolidated sales decreased by -3% on a constant currency basis to €710.7 million (2025: €758.4 million). Sales increased in the first half year for Spices & Nuts and Tea, offset by a decline in Edible Seeds and Organic Ingredients. Food Solutions sales remained broadly in line with the previous period. Overall adjusted Gross Profit margin improved from 16.2% to 16.4%. Leverage ratio is at 2.9x due to relatively high market prices, with a continuously strong balance sheet. H1 2026
H1 2025
% Change
Sales
710.7
758.4
-6%
Adjusted Gross profit1
116.9
122.7
-5%
Adjusted Gross profit %
16.4%
16.2%
Consolidated figures (in € millions)
Adjusted Operating income (EBIT)1
52.1
58.3
-11%
Adjusted Net profit
33.5
40.8
-18%
Earnings per share (adjusted)
1.13
1.36
-17%
Earnings per share (reported)
0.94
1.42
-34%
45.1%
47.1%
2.9x
2.1x
Earnings per share (in €)
Ratios Solvency – total equity as % of total assets Leverage ratio (net debt/EBITDA) 1
Non-IFRS financial measure. Refer to Reconciliation of non-IFRS information on page 15
ESG
In the first half of 2026, Acomo published its second CSRD-aligned Sustainability Statement and continued rolling out its strategy to support all entities in building responsible and resilient supply chains. Selected developments are highlighted below. • Climate change: Following its 2025 SBTi commitment, Delinuts completed a Scope 3 hotspot analysis and started engaging selected suppliers to identify emission-reduction opportunities and support science-based target setting. • Nature & Biodiversity: Tradin Organic organized dynamic agroforestry workshops in Peru under the 2026–2027 SAFE program with La Campina Peru and GIZ, supporting ginger, cocoa, orange and coffee farmers in strengthening agricultural and economic resilience. • Own workforce: Acomo implemented a Group-wide learning platform and launched its first mandatory governance training programs, supporting a more consistent approach to employee training across the Group. • Workers in the value chain: Royal Van Rees Group received an EcoVadis Gold Medal, placing it among the top 5% of assessed companies and recognizing progress across management systems focusing on environment, labor and human rights, ethics and sustainable procurement.
Currency euro/US dollar
The average euro/US dollar exchange rate of 1.167 in H1 2026 was -6.7% weaker compared to H1 2025 (1.094), resulting in a -€23.6 million translation effect on sales and -€1.4 million effect on net profit. The euro/US dollar rate of 1.142 at 30 June 2026 reflected the stronger US dollar compared to the 2025 year-end rate (1.175), which represents a +2.8% revaluation. On total assets, the stronger US dollar had an impact of +€12.3 million.
Interim dividend H1 2026
The interim dividend has been set at €0.45 per share. The ex-dividend date is 3 August 2026 and the dividend is payable on 11 August 2026.
ROTTERDAM (NL), 28 JULY 2026
2
PRESS RELEASE HALF-YEAR REPORT 2026
Activity reviews per segment Q2-2026
Q2-2025
% Change
% FX Adjusted Change
H1 2026
H1 2025
% Change
% FX Adjusted Change
Spices and Nuts
131.3
131.8
0%
0%
276.2
266.6
+4%
+4%
Edible Seeds
55.6
56.5
-2%
0%
114.5
124.2
-8%
-3%
Organic Ingredients
124.5
151.2
-18%
-16%
253.8
302.9
-16%
-11%
Tea
30.0
24.7
+22%
+22%
56.2
54.1
+4%
+9%
Food Solutions
6.4
6.5
0%
0%
12.8
12.9
0%
0%
Intra Group
(1.2)
(1.1)
(2.8)
(2.3)
346.6
369.6
710.7
758.4
-6%
-3%
Sales (in € millions)
Total
-6%
-5%
Spices & Nuts
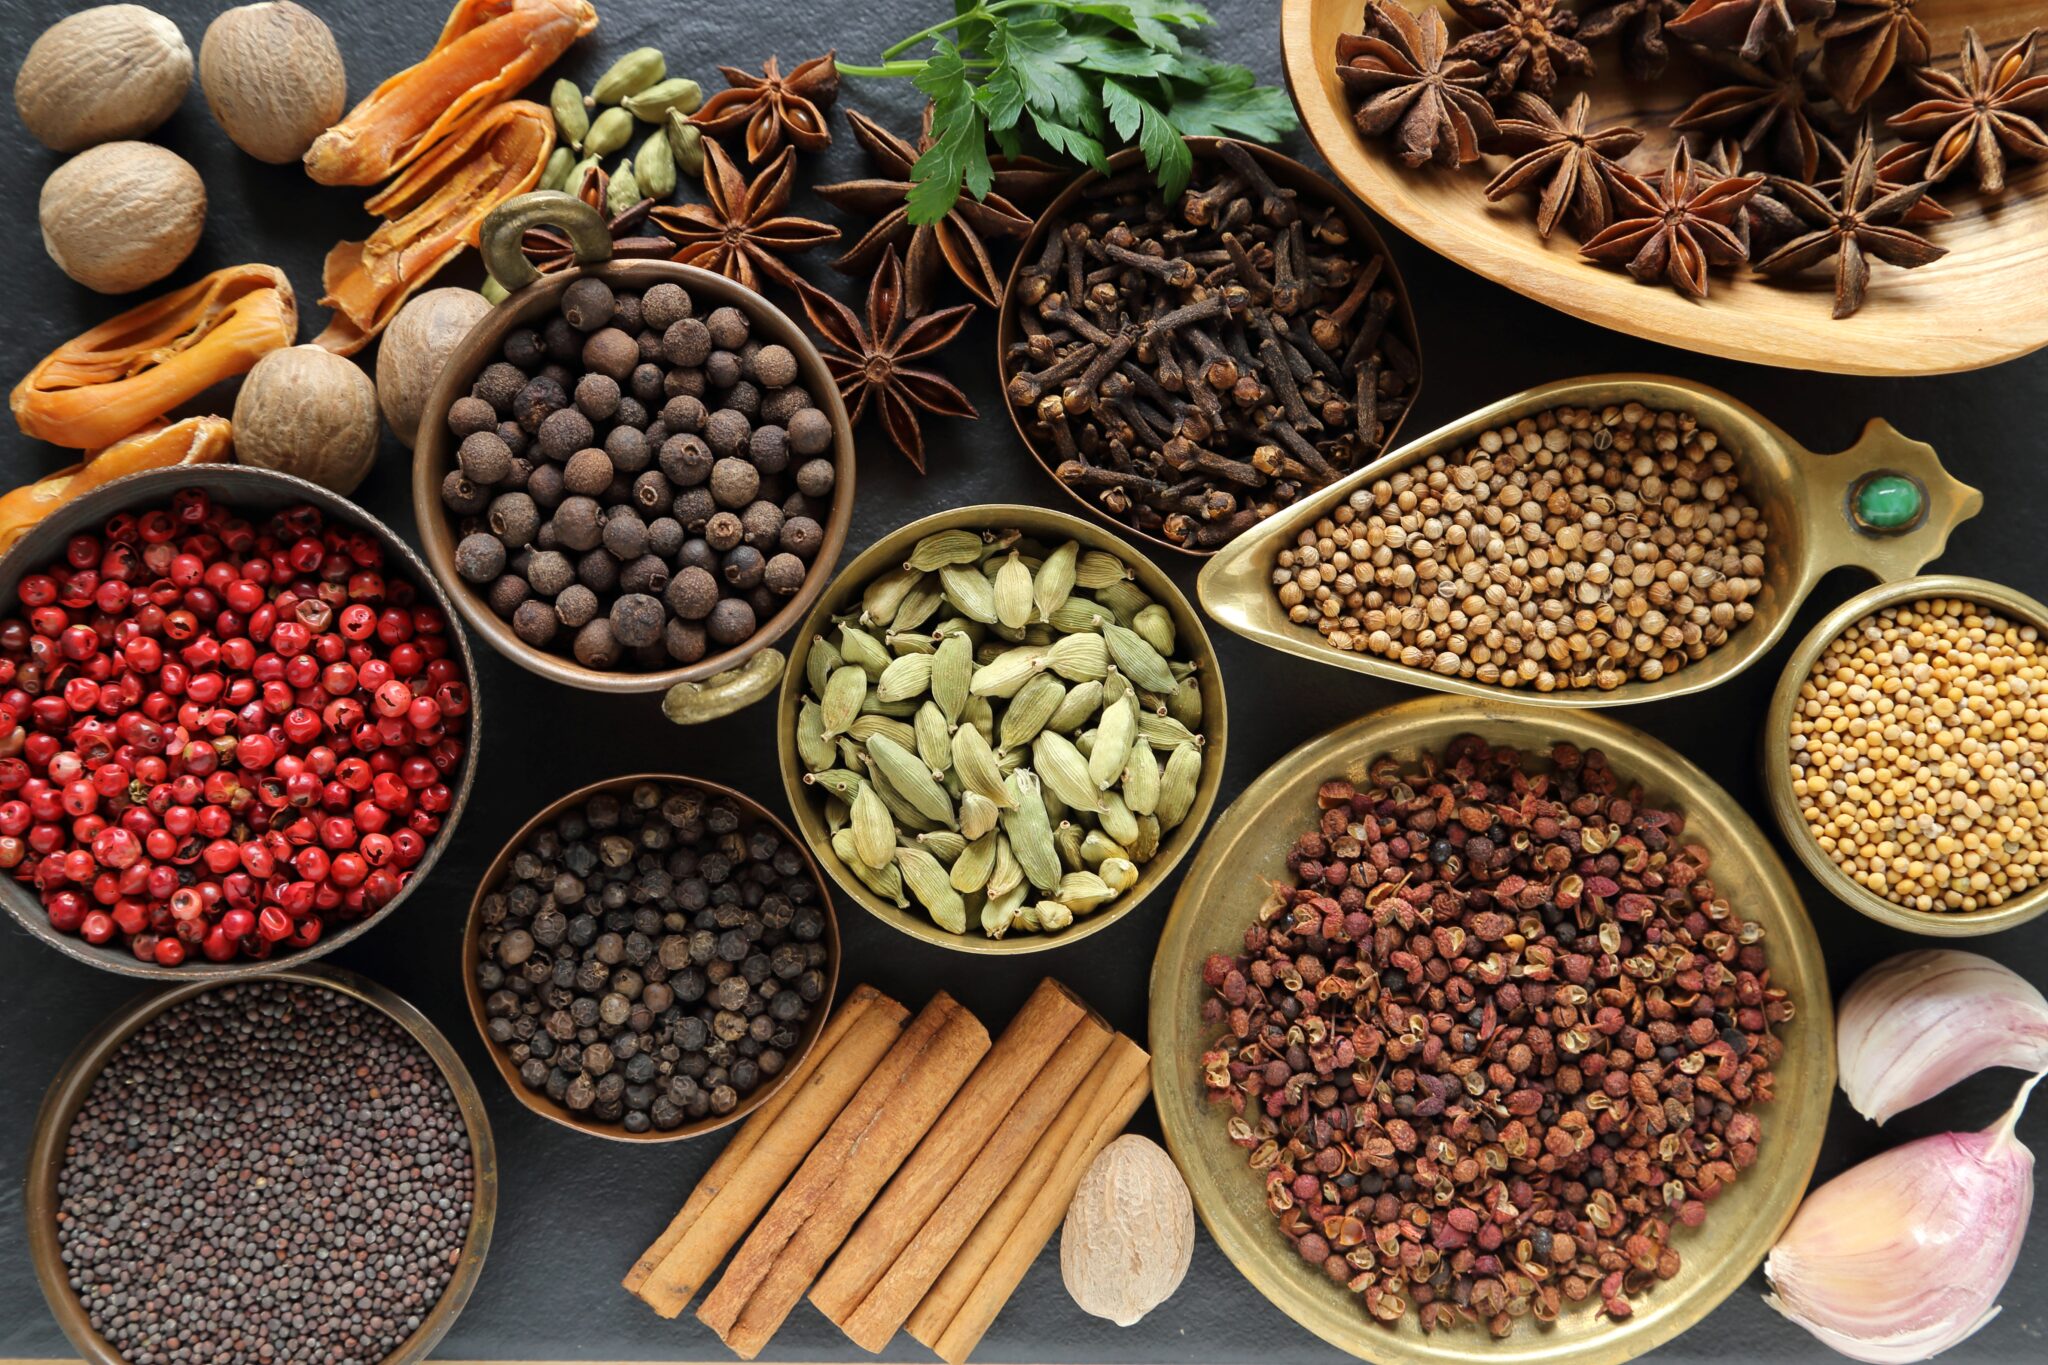
Market conditions remained broadly similar during the first half of the year to those reported at year-end, with most key product categories trading at relatively elevated yet generally stable levels. The period was marked by ongoing supply chain disruptions and geopolitical uncertainty, creating challenges across several sourcing regions and trade routes. Despite these circumstances, the Spices & Nuts division continued to effectively support customers through its global sourcing capabilities, supply chain expertise and strong market knowledge. Black pepper prices eased from earlier peaks as supply improved, particularly from Brazil, while desiccated coconut prices remained well supported by strong demand and limited raw material availability. Cashew prices remained relatively stable throughout the period following the correction from the unusually high levels recorded in 2025. To strengthen the business and service offerings to customers, Catz International opened an office in China. As market prices were more stable compared with the exceptional environment of H1 2025, margins were closer to historical average, at a healthy level of 10.3%, reflecting the strength of the division's market position, customer relationships and risk management capabilities. H1 2026 sales were up +4% on a constant currency basis compared with H1 2025, supported by the acquisition of Manuzzi in the second half of 2025, while adjusted EBITDA for the segment reached €28.6 million, versus €34.8 million in H1 2025.
Edible Seeds
H1 2026 saw a recovery in the Edible Seeds business in the US. The production issues that affected Sunbutter® in Q4 2025 were fully resolved by the end of January and sales of Sunbutter® increased versus H1 2025 following successful full replenishment and strong offtake. For Wildlife, volume and sales performance exceeded the levels achieved in the first half of the previous year supported by improved execution at key accounts and a return to more seasonal demand. As a result, the US business within Edible Seeds contributed significantly to the year-on-year improvement of the segment's margin performance, mitigating a more challenging first half of the year in the smaller European seeds business. Edible Seeds sales declined by -2.8% on a constant currency basis compared to H1 last year. Nonetheless, the segment saw a strong recovery with an adjusted EBITDA of €10.1 million, up +22% versus last year on a constant currency basis.
Organic Ingredients
The global trend of consumer momentum for healthier and more sustainable foods continues to be positive, with organic retail sales growth across Europe and the US outpacing overall retail sales growth. Within Acomo’s Organic Ingredients segment, the Fruits business continues to demonstrate healthy commercial momentum and consistent growth. Initiatives to capture future growth and realize efficiencies have been taken, with investments in further integrating and strengthening the global citrus fruits supply chain. The acquisition of Citromil in Spain was finalized which will strengthen the position in Europe and beyond. In the US, an investment has been made to insource processing for the Juice business. This initiative will put some pressure on sales in the short term but will structurally improve the business from the first half of 2027 onwards. The Cocoa business continues to perform well, successfully navigating the ongoing market volatility and increasingly complex regulatory landscape. After the record high cocoa prices at the back end of 2024 and first half of 2025, cocoa
ROTTERDAM (NL), 28 JULY 2026
3
PRESS RELEASE HALF-YEAR REPORT 2026
prices have come down but remain above historic levels with continued daily volatility. For Coffee, lower volumes were more than offset by improved margins. Organic Ingredients segment sales declined by -11% on a constant currency basis in H1 2026 versus a strong H1 2025 comparable. Adjusted EBITDA was €20.2 million, in line year-on-year on constant currency basis, with improved margins offsetting lower sales.
Tea
Continuation of market volatility, shaped by both direct and indirect geopolitical exposures, put pressure on margin performance in the Tea segment compared with the first half of the previous year. Nevertheless, sales growth in this segment underscores its ability to further strengthen how it adapts to evolving market conditions within a fragmented and complex customer landscape. Positive volume and sales development in Tea in the second quarter resulted in H1 2026 sales growth of +9% year-onyear at constant currency, while adjusted EBITDA was €1.3 million.
Food Solutions
The Food Solutions segment delivered an improved margin performance in H1 2026 compared with the same period last year, primarily driven by the blends business. Supported by an entrepreneurial drive and continued investment in R&D, a further diversification of the wet blends product range fueled the ongoing scaling of the production facility that became operational last year. The segment generated overall H1 2026 sales of €12.8 million, in line with the prior year, while adjusted EBITDA increased by +9% on a constant currency basis to €3.5 million.
Other information Consolidated balance sheet
Total assets amounted to €992.5 million as at 30 June 2026 (year-end 2025: €989.9 million). The main financial developments in the first half of 2026 were: • Shareholders’ equity increased by +€10.7 million to €444.8 million as at 30 June 2026 (year-end 2025: €434.1 million). The main movements were the H1 2026 net profit of €27.8 million, and the positive currency translation effect of €9.0 million, partly offset by dividend payments to shareholders of €28.2 million. • Working capital decreased by -€7.2 million compared to 31 December 2025, driven by lower inventory, partly offset by higher receivables. • Solvency as at 30 June 2026 was 45.1% (year-end 2025: 44.1%).
Outlook 2026
The Acomo Group is well-positioned for sustainable growth and is on track to achieve the growth ambitions set out at the 2025 Capital Markets Day, driven by our relevant and diversified plant-based product portfolio in combination with our proven ability to manage turbulent market conditions. In the short term we continue to monitor external developments closely and our business model remains agile in response to changing market conditions. As indicated at our FY 2025 investor call and assuming no material change to the current operating environment we are expecting a more balanced EBITDA distribution between H1 and H2 in 2026 compared to last year.
Investor call
On Tuesday 28 July 2026 at 15.00 (CET) an investor call will be held to discuss these results further. A link can be found on the company's website.
Note
This H1 2026 report has not been subject to an audit.
ROTTERDAM (NL), 28 JULY 2026
4
PRESS RELEASE HALF-YEAR REPORT 2026
Financial calendar
28 July 2026
Investor call H1 2026 financials
3 August 2026
Ex-dividend date, interim dividend FY 2026
4 August 2026
Dividend record date, interim dividend FY 2026
11 August 2026
Dividend payment date, interim dividend FY 2026
22 October 2026
Trading update Q3 2026 – pre-market
Notes to the editors: