임원ㆍ주요주주특정증권등소유상황보고서
Bull 0
Bear 0
Routine
329180
|
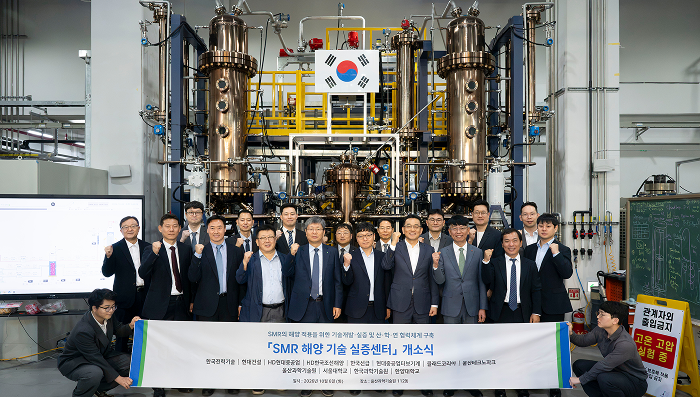
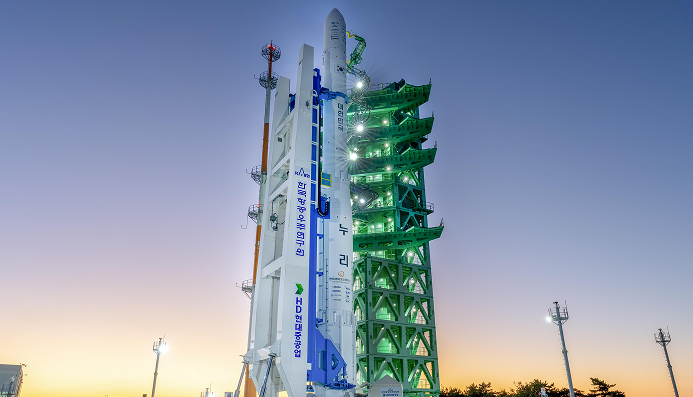
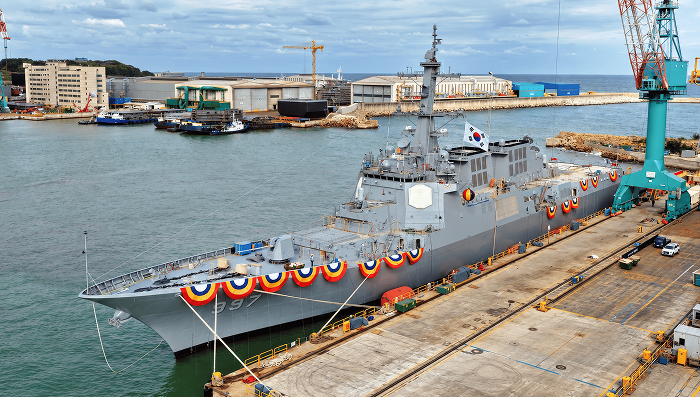
HD HYUNDAI HEAVY INDUSTRIES is a South Korean heavy industry company operating in shipbuilding, offshore engineering, and engine manufacturing. The company builds commercial vessels, including LNG carriers, container ships, and eco-friendly ships, as well as military vessels such as destroyers, frigates, and submarines. Its offshore division designs and constructs oil and gas production facilities, floating storage and regasification units, and renewable energy infrastructure, including offshore wind platforms and small modular reactors. The engine segment produces marine propulsion and generator engines, including the HiMSEN brand, and land-based power generation systems. The company serves global shipping lines, energy companies, and defense agencies across Asia, Europe, the Americas, and the Middle East. It is a subsidiary of the HD Hyundai Group and absorbed HD Hyundai Mipo in 2025. The company was founded in 1972. Summarised from the company's own disclosures, fiscal year ended Mar 2026 |
Industry Engineering & Construction | Homepage hd-hhi.com |
| Sector Industrials | IR page hd-hhi.com//kr/main | |
|
Tags
shipbuilding, offshore engineering, marine engines, defense vessels, lng carriers, offshore wind, small modular reactors, power generation, heavy industry, HiMSEN, HD Hyundai Mipo, HD Hyundai Engine, HD Hyundai MNS, Hi-Float, Hi-OSS, HiCON, OceanLink, HiEMS, WeDAS, SkyBench, Morning Walk, Blue Whale, Tenergy, CMA CGM Hope, Ane Mærsk, Gas Ivory, Vasant One, Tove Knutsen, Marshal Vasilevskiy, Goliat, King's Quay, Badamyar, Jangkrik, Odoptu, Aasta Hansteen, West Bollsta, Shwe, Yosemiti, Az-Zour North, Al-zour, Shuqaiq, Soyang, Cheonan, Chungnam, Sejong the Great, Jungjo the Great, Ulsan, Yeoncheon, Donghae, Seoul, Taepyeongyang 16, Hansando, Ilchulbong, Nodokbong, Shindolseok, Shinchaeho, Yoon Bonggil, Raja Sulaiman, Miguel Malvar, Antonio Luna, Jose Rizal, Aotearoa, Jarl, Tercos P, Basant One
|
Press page — |
Metrics
| Valuation | |
|---|---|
| Market cap | — |
| Market cap (USD) | — |
| P/E | — |
| PEG | — |
| P/BV | — |
| P/S | — |
| P/OCF | — |
| P/FCF | — |
| Dividend yield | — |
| Turnover / mcap | — |
| Returns | |
|---|---|
| ROE | 18.8% |
| ROI | 15.2% |
| ROIC | 17.1% |
| Profit margin | 8.1% |
| Growth | |
|---|---|
| Revenue growing | Yes |
| Profits growing | Yes |
| Revenue up 3y | Yes |
| Revenue up 5y | No |
| Earnings growth 3y (net profit CAGR) | — |
| Quality | |
|---|---|
| Profitable | Yes |
| Margin expanding | Yes |
| Buying back stock | No |
| Diluting (TTM) | Yes |
| Debt/Equity | — |
| Podcast bulls (TTM) | Sign up |
| Podcast bears (TTM) | Sign up |
| Podcast sentiment (TTM) | Sign up |
| Podcast sentiment % (TTM) | Sign up |
| News sentiment (TTM) | — |
| Quality score | 61.5% |
| Insiders | |
|---|---|
| Buys, 1w | Sign up |
| Buys, 1m | Sign up |
| Buys, 1y | Sign up |
| Sells, 1w | Sign up |
| Sells, 1m | Sign up |
| Sells, 1y | Sign up |
Sign up to see this company's insider trades
Filed figures
Lines the statements and their notes report beside the headline figures, read from the filings' XBRL as filed (no restatement applied), with figures computed from one filing's own lines. Cash-flow lines carry their cash direction: an outflow is negative. Each period links to its filing; a figure's period, report date and tag are in its tooltip.
| Figure | Dec 2019 | Dec 2020 | Dec 2021 | Dec 2022 | Dec 2023 | Dec 2024 | Dec 2025 |
|---|---|---|---|---|---|---|---|
| Balance sheet detail | |||||||
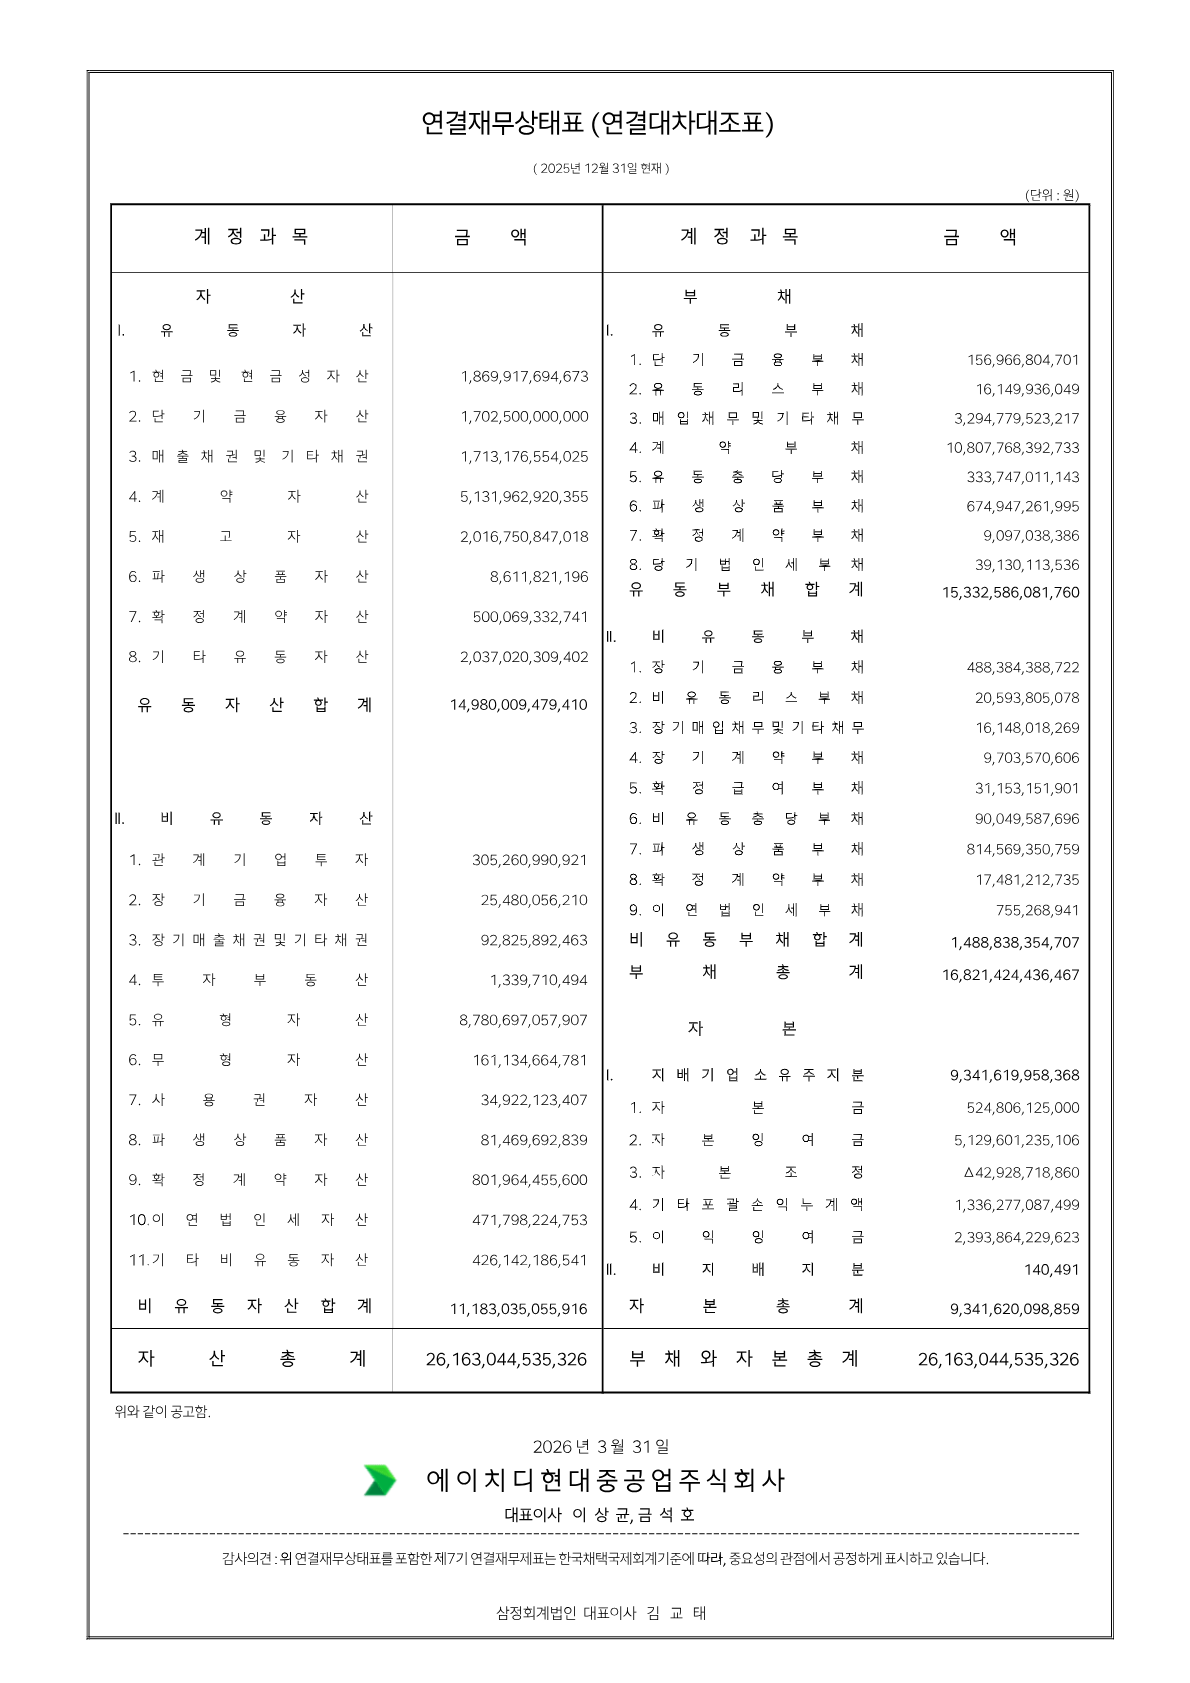
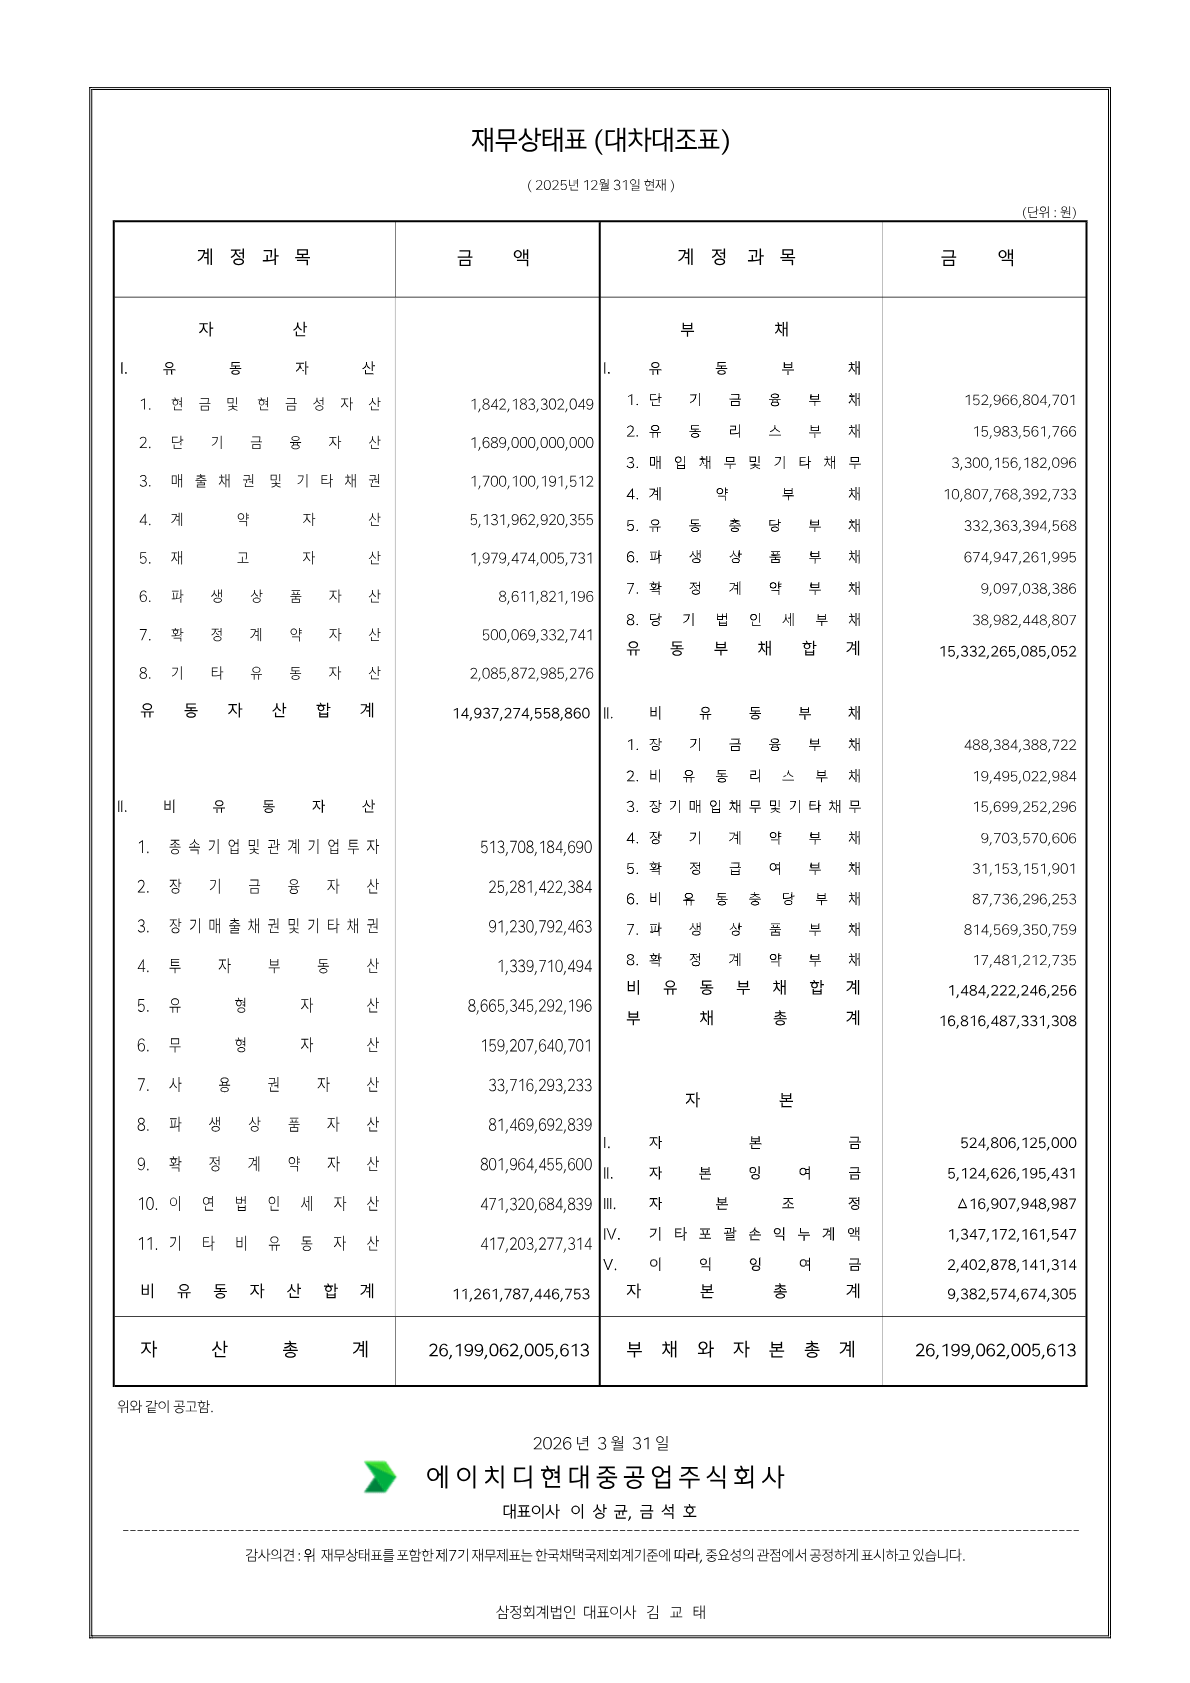
| Trade receivables (KRW) | 1.32T | 892B | 1.03T | 1.14T | 1.39T | 1.66T | 1.71T |
| ↳ YoY growth | -32.2% | +15.7% | +10.0% | +22.0% | +19.7% | +3.2% | |
| ↳ 5y CAGR | +4.8% | +13.9% | |||||
| Lease liabilities (KRW) | 8.65B | 16.3B | 18.8B | 44.5B | 39.1B | 33.3B | 36.7B |
| Cash and deposits (KRW) | 994B | 1.31T | 2.14T | 744B | 928B | 1.26T | 1.87T |
| Intangible assets (KRW) | 58.2B | 65B | 79.5B | 100B | 108B | 128B | 161B |
| Right-of-use assets (KRW) | 8.6B | 15.6B | 17.9B | 43.4B | 37.4B | 31.5B | 34.9B |
| Cash flow detail | |||||||
| Operating cash flow (KRW) | -585B | -200B | 762B | 71.2B | 169B | 2.88T | 3.51T |
| Purchases of property, plant and equipment (KRW) | -159B | -226B | -244B | -484B | -478B | -463B | -512B |
| Purchases of intangible assets (KRW) | -5.37B | -9.86B | -21.2B | -29.7B | -35.7B | -33.1B | -29.5B |
| Dividends paid (cash effect) (KRW) | — | — | — | — | 0.00 | 0.00 | -334B |
| Share buybacks (cash effect) (KRW) | — | — | — | — | 0.00 | 0.00 | -15.5B |
| Interest paid (cash effect) (KRW) | -63.7B | -137B | -110B | -76.9B | -117B | -115B | -39.4B |
| Income taxes paid (cash effect) (KRW) | — | — | 296M | -4.75B | -2.47B | -2.22B | -50.9B |
| Free cash flow (OCF - PPE - intangibles) (KRW) | -750B | -436B | 497B | -443B | -345B | 2.39T | 2.97T |
| Income detail | |||||||
| Total comprehensive income (KRW) | -94.5B | -262B | -835B | -306B | -85.2B | 498B | 1.58T |
| Comprehensive income to owners (KRW) | -94.5B | -262B | -835B | -306B | -85.2B | 498B | 1.58T |
| Reported | Apr 1, 2021 | Apr 1, 2021 | Mar 18, 2024 | Mar 18, 2024 | Mar 20, 2026 | Mar 20, 2026 | Mar 20, 2026 |
Sign up to see institutional holdings
Sign UpPodcast Mentions
Sign up to see podcast mentions and sentiment
Sign UpDisclosures filed with DART (material events and exchange disclosures), newest first, headlines as filed in Korean. The link opens the filing on DART. Press releases from the company's own website, newest first.






Prompts
Click prompts to add them under the company line, click again to take one out, then copy the result into your AI chat. Shared by Asian Century Stocks and Uncovered Thai Stocks. Thank you.
HD HYUNDAI HEAVY INDUSTRIES (ticker 329180), listed in South Korea.
Copied
ETFs Holding HD HYUNDAI HEAVY INDUSTRIES
Exchange-traded funds whose newest published daily portfolio holds one of the company's listings, largest weight first.
| ETF | Weight in ETF | Shares | Market value | As of |
|---|---|---|---|---|
| MKOR | 1.55% | 6,083 | $ 2.324M | Jun 30, 2026 |
| MEM | 1.01% | 1,470 | $ 561.699K | Jun 30, 2026 |
| ASIA | 0.98% | 1,431 | $ 546.797K | Jun 30, 2026 |
| MINV | 0.94% | 4,558 | $ 1.742M | Jun 30, 2026 |
| FEMR | 0.44% | 1,803 | $ 689.51K | Jun 30, 2026 |
| AVES | 0.42% | 30,216 | $ 6.017M | Nov 16, 2026 |
| MEMX | 0.39% | 511 | $ 195.257K | Jun 30, 2026 |
| EMMF | 0.26% | 1,227 | $ 468.847K | Jun 30, 2026 |
| REMG | 0.24% | 670 | $ 256.012K | Jun 30, 2026 |
| DGRE | 0.14% | 542 | $ 207.103K | Jun 30, 2026 |
| AVXC | 0.11% | 2,337 | $ 465.338K | Nov 16, 2026 |
| DEHP | 0.09% | 1,792 | $ 360.299K | Nov 12, 2026 |
| AVEM | 0.05% | 67,930 | $ 13.526M | Nov 16, 2026 |
| DFAE | 0.04% | 19,762 | $ 3.973M | Nov 12, 2026 |
| DFEM | 0.02% | 9,035 | $ 1.817M | Nov 12, 2026 |
| DEXC | 0.01% | 196 | $ 39.408K | Nov 12, 2026 |
| DFSE | 0.01% | 411 | $ 82.636K | Nov 12, 2026 |
| DFAX | 0.00% | 2,913 | $ 585.687K | Nov 12, 2026 |