기업설명회(IR)개최(안내공시)
Bull 0
Bear 0
Routine
294870
|
IPARK-DVP is a South Korean construction and real estate development company operating through construction and other business segments. Its construction division covers outsourced housing, civil engineering, general architecture, and self-developed projects, utilizing the IPARK brand for residential developments. The company executes urban redevelopment, rehousing, and remodeling projects, alongside civil infrastructure works such as roads, ports, and railways. In the general architecture segment, it constructs office and commercial facilities for public and private clients. The self-development segment involves land acquisition and the execution of large-scale residential, mixed-use, and urban development projects. The other segment includes the production of precast concrete structures through HDC Hyundai PC, hotel and resort services through Hotel HDC, and residential real estate investment trusts (REITs) for property development and operation. The company serves domestic markets, with clients including government agencies, local governments, and private enterprises. It was founded in 1976 following the merger of Korea City Development and Hana Construction, and operates under the HDC Group. Summarised from the company's own disclosures, fiscal year ended Mar 2026 |
Industry Engineering & Construction | Homepage ipark-dvp.com |
| Sector Industrials | IR page ipark-dvp.com/ko | |
|
Tags
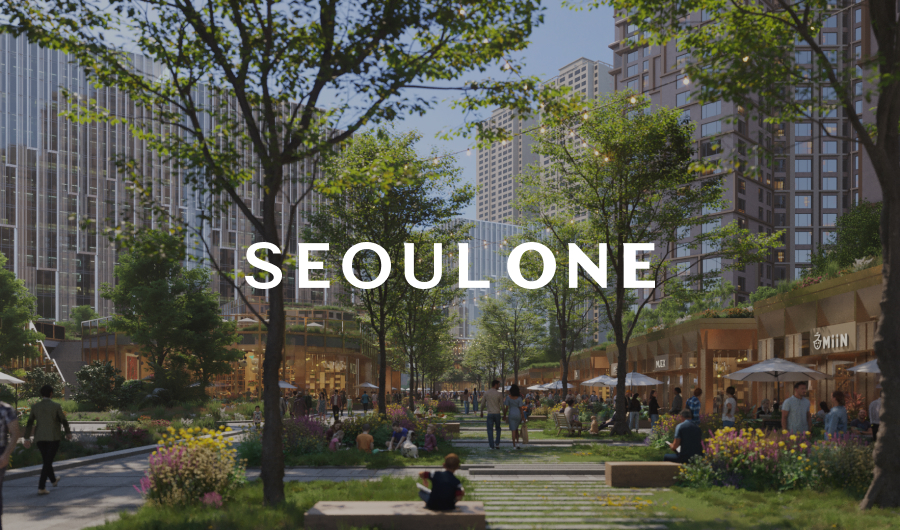
residential construction, civil engineering, real estate development, precast concrete, hotel services, reits, urban redevelopment, mixed-use development, IPARK, HDC Hyundai PC, Hotel HDC, HDC IPARK No.1 Trust Management Real Estate Investment Trust, HDC IPARK No.2 Trust Management Real Estate Investment Trust, HDC Private Rental Housing No.1 Trust Management Real Estate Investment Trust, Parkrose Resort & Wellness, Tongyeong Eco Power, Hyundai Industrial Development & Construction, HDC, IPARK Tower, Haeundae IPARK, Suwon IPARK City, Busan Port Bridge, Gochok Sky Dome, Apgujeong Hyundai Apartment, Samsung IPARK, Seoul One
|
Press page ipark-dvp.com/ko/newsroom/news |
Metrics
| Valuation | |
|---|---|
| Market cap | ₩ 1.555T |
| Market cap (USD) | $ 1.144B |
| P/E | 8.07 |
| PEG | 0.17 |
| P/BV | 0.47 |
| P/S | 0.42 |
| P/OCF | 2.29 |
| P/FCF | 3.03 |
| Dividend yield | — |
| Turnover / mcap | — |
| Returns | |
|---|---|
| ROE | 5.0% |
| ROI | 4.9% |
| ROIC | 5.7% |
| Profit margin | 3.8% |
| Growth | |
|---|---|
| Revenue growing | No |
| Profits growing | No |
| Revenue up 3y | No |
| Revenue up 5y | No |
| Earnings growth 3y (net profit CAGR) | 46.4% |
| Quality | |
|---|---|
| Profitable | Yes |
| Margin expanding | Yes |
| Buying back stock | No |
| Diluting (TTM) | No |
| Debt/Equity | — |
| Podcast bulls (TTM) | Sign up |
| Podcast bears (TTM) | Sign up |
| Podcast sentiment (TTM) | Sign up |
| Podcast sentiment % (TTM) | Sign up |
| News sentiment (TTM) | — |
| Quality score | 5.9% |
| Insiders | |
|---|---|
| Buys, 1w | Sign up |
| Buys, 1m | Sign up |
| Buys, 1y | Sign up |
| Sells, 1w | Sign up |
| Sells, 1m | Sign up |
| Sells, 1y | Sign up |
Sign up to see this company's insider trades
| Figure | FY 2025 | FY 2024 | FY 2023 | FY 2022 | FY 2021 | FY 2020 | FY 2019 | FY 2018 |
|---|---|---|---|---|---|---|---|---|
| Revenue | 4.147T | 4.256T | 4.191T | 3.298T | 3.364T | 3.67T | 4.216T | 2.793T |
| Net profit | 158.149B | 155.717B | 173.07B | 50.367B | 176.535B | 220.205B | 413.67B | 229.853B |
| Free cash flow | -114.917B | 279.973B | 575.165B | -1.817T | 13.318B | -263.507B | -124.972B | 448.789B |
Filed figures
Lines the statements and their notes report beside the headline figures, read from the filings' XBRL as filed (no restatement applied), with figures computed from one filing's own lines. Cash-flow lines carry their cash direction: an outflow is negative. Each period links to its filing; a figure's period, report date and tag are in its tooltip.
| Figure | Dec 2018 | Dec 2019 | Dec 2020 | Dec 2021 | Dec 2022 | Dec 2023 | Dec 2024 | Dec 2025 |
|---|---|---|---|---|---|---|---|---|
| Balance sheet detail | ||||||||
| Trade receivables (KRW) | 467B | 370B | 355B | 371B | 382B | 671B | 799B | 897B |
| ↳ YoY growth | -20.8% | -4.1% | +4.5% | +2.9% | +75.8% | +19.1% | +12.2% | |
| ↳ 5y CAGR | +7.5% | +16.7% | +20.4% | |||||
| Other receivables (KRW) | — | — | — | 505B | 1.48T | 605B | 493B | 520B |
| Borrowings, current (KRW) | 372B | 402B | 1.03T | 1.17T | 1.86T | 1.6T | 1.77T | 1.72T |
| Borrowings, non-current (KRW) | 34.9B | 4.81B | 139B | 489B | 326B | 249B | 200B | 779B |
| Bonds payable (KRW) | — | — | — | 489B | 319B | 249B | 200B | 320B |
| Cash and deposits (KRW) | 895B | 361B | 527B | 351B | 564B | 558B | 825B | 884B |
| Intangible assets (KRW) | 6.12B | 7.98B | 11.8B | 10.9B | 12.6B | 11.4B | 11.8B | 14.2B |
| Right-of-use assets (KRW) | — | — | — | 40.8B | 93.2B | 82.5B | 70.7B | 66.1B |
| Net debt (borrowings + leases - cash) (KRW) | -487B | 45.7B | 641B | 1.31T | 1.62T | 1.29T | 1.14T | 1.62T |
| Cash flow detail | ||||||||
| Operating cash flow (KRW) | 455B | -120B | -259B | 30.4B | -1.74T | 640B | 314B | 2.81B |
| Purchases of property, plant and equipment (KRW) | -5.85B | -4.98B | -4.6B | -17.1B | -82.1B | -65B | -34.4B | -118B |
| Purchases of intangible assets (KRW) | -103M | -2.53B | -3.97B | -1.07B | -2.26B | -1.22B | -3.25B | -4.78B |
| Dividends paid (cash effect) (KRW) | — | -22B | -22.3B | -39.5B | -39.5B | -39.5B | -44.9B | -44.9B |
| Share buybacks (cash effect) (KRW) | -716M | — | — | 0.00 | 0.00 | -20B | 0.00 | -16.2B |
| Interest paid (cash effect) (KRW) | -14.8B | -23.3B | -38.7B | -46.1B | -103B | -74.8B | -125B | -100B |
| Income taxes paid (cash effect) (KRW) | -24.1B | -99.8B | -133B | -155B | -118B | -76.4B | -46.4B | -21.8B |
| Free cash flow (OCF - PPE - intangibles) (KRW) | 449B | -127B | -267B | 12.2B | -1.82T | 574B | 277B | -120B |
| Income detail | ||||||||
| Total comprehensive income (KRW) | 228B | 409B | 215B | 182B | 56.1B | 167B | 149B | 159B |
| Comprehensive income to owners (KRW) | 228B | 409B | 215B | 182B | 56.3B | 167B | 149B | 159B |
| Provision for credit losses (KRW) | — | — | — | 3.6B | -1.03B | -455M | 4.81B | 117B |
| Credit cost ratio (credit losses / average receivables) (%) | — | — | — | 0.6% | 0.1% | 0.0% | 0.4% | 8.6% |
| Reported | Jun 30, 2020 | Jun 30, 2020 | Mar 16, 2021 | Apr 1, 2024 | Apr 1, 2024 | Apr 1, 2024 | Aug 12, 2025 | Mar 18, 2026 |
Sign up to see institutional holdings
Sign UpPodcast Mentions
Sign up to see podcast mentions and sentiment
Sign UpDisclosures filed with DART (material events and exchange disclosures), newest first, headlines as filed in Korean. The link opens the filing on DART. Press releases from the company's own website, newest first.


 홈


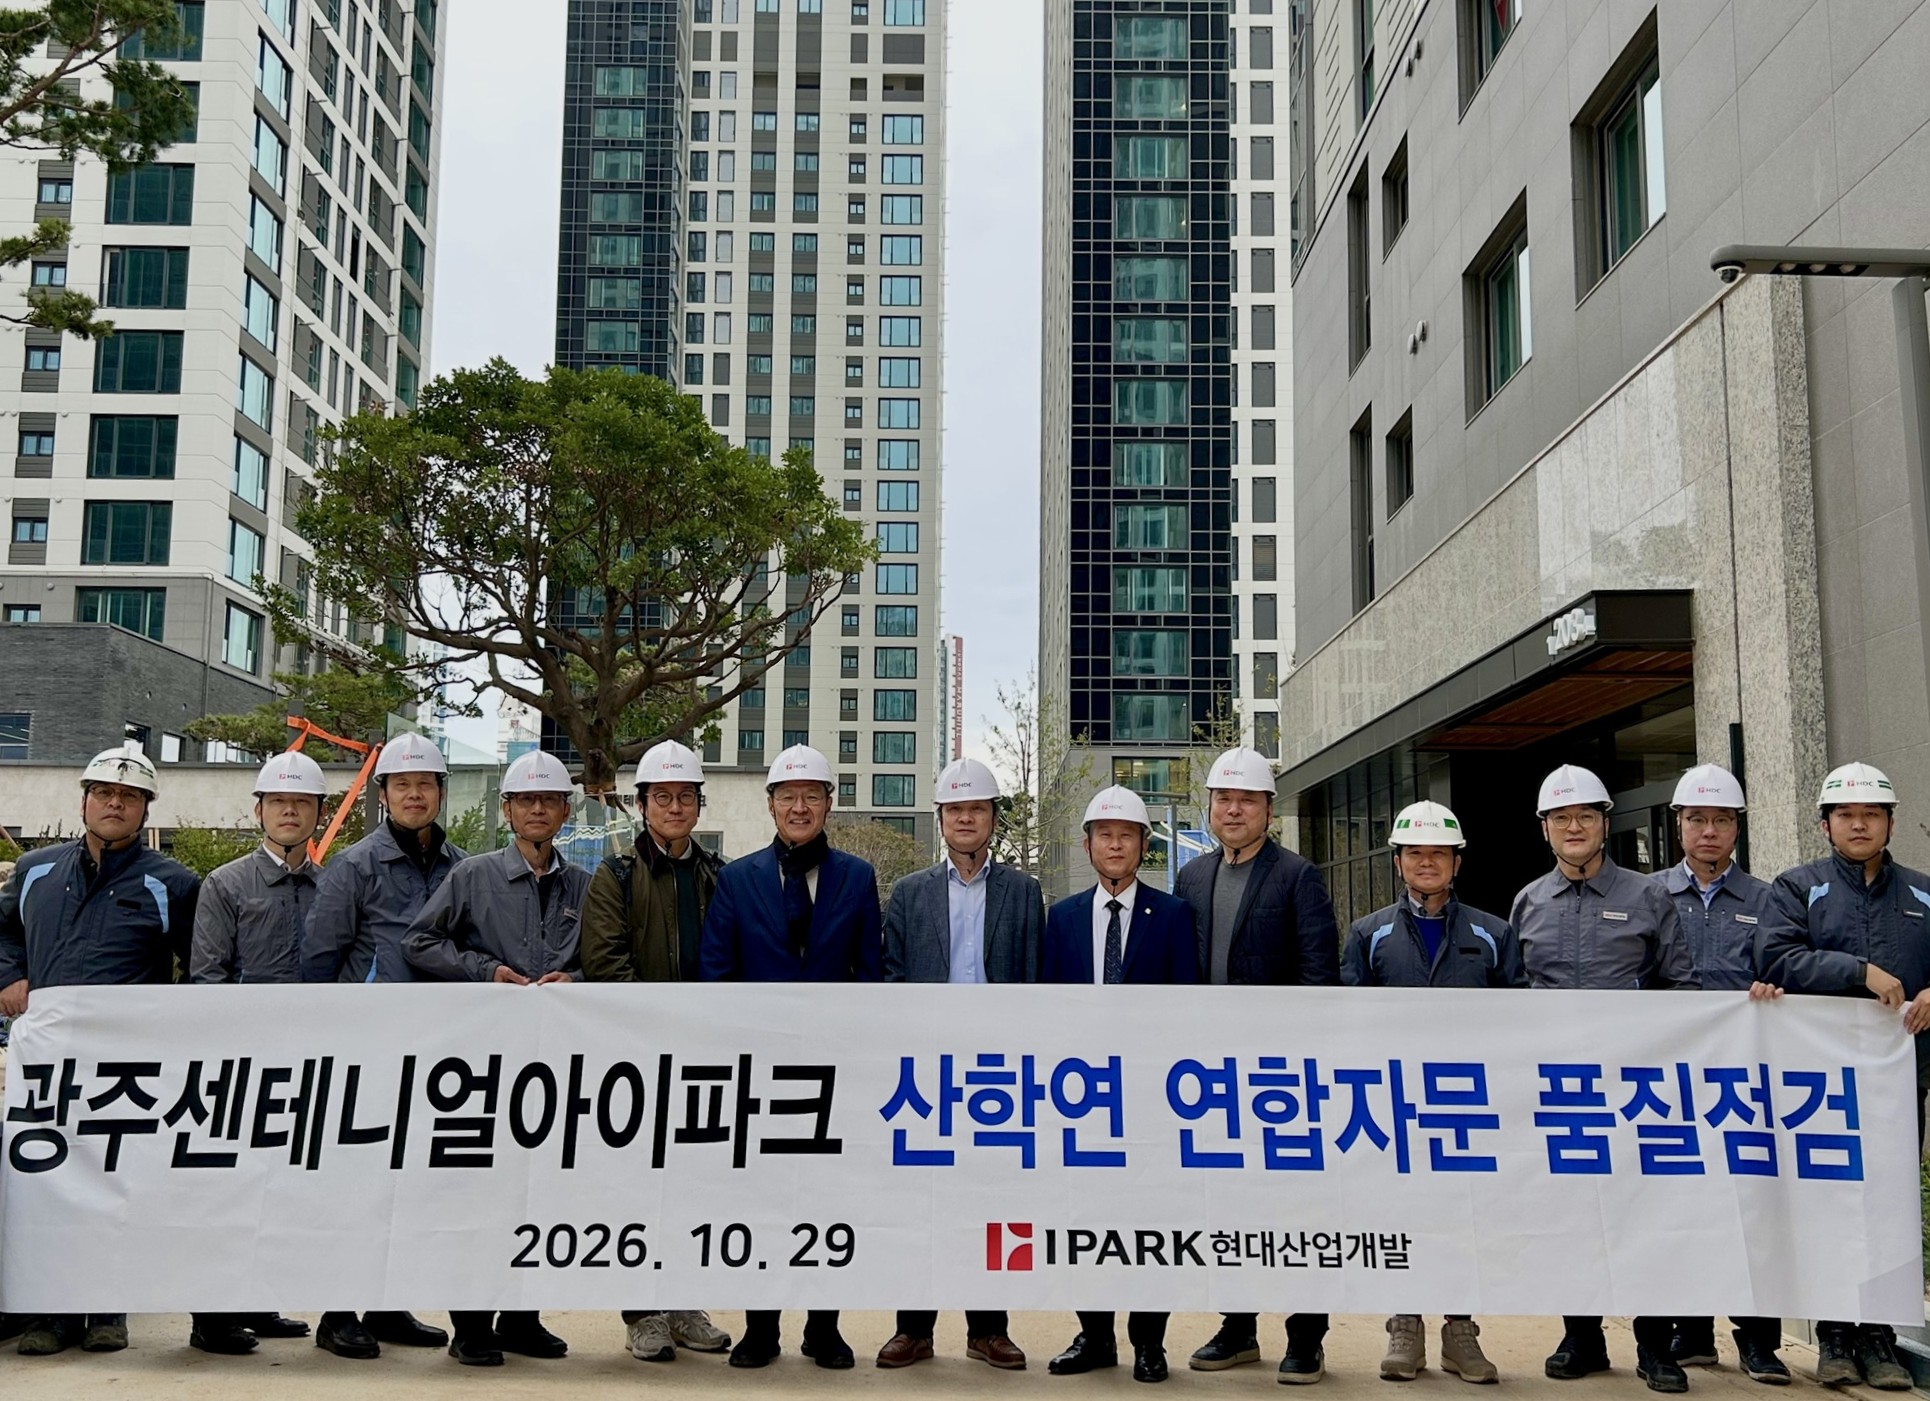
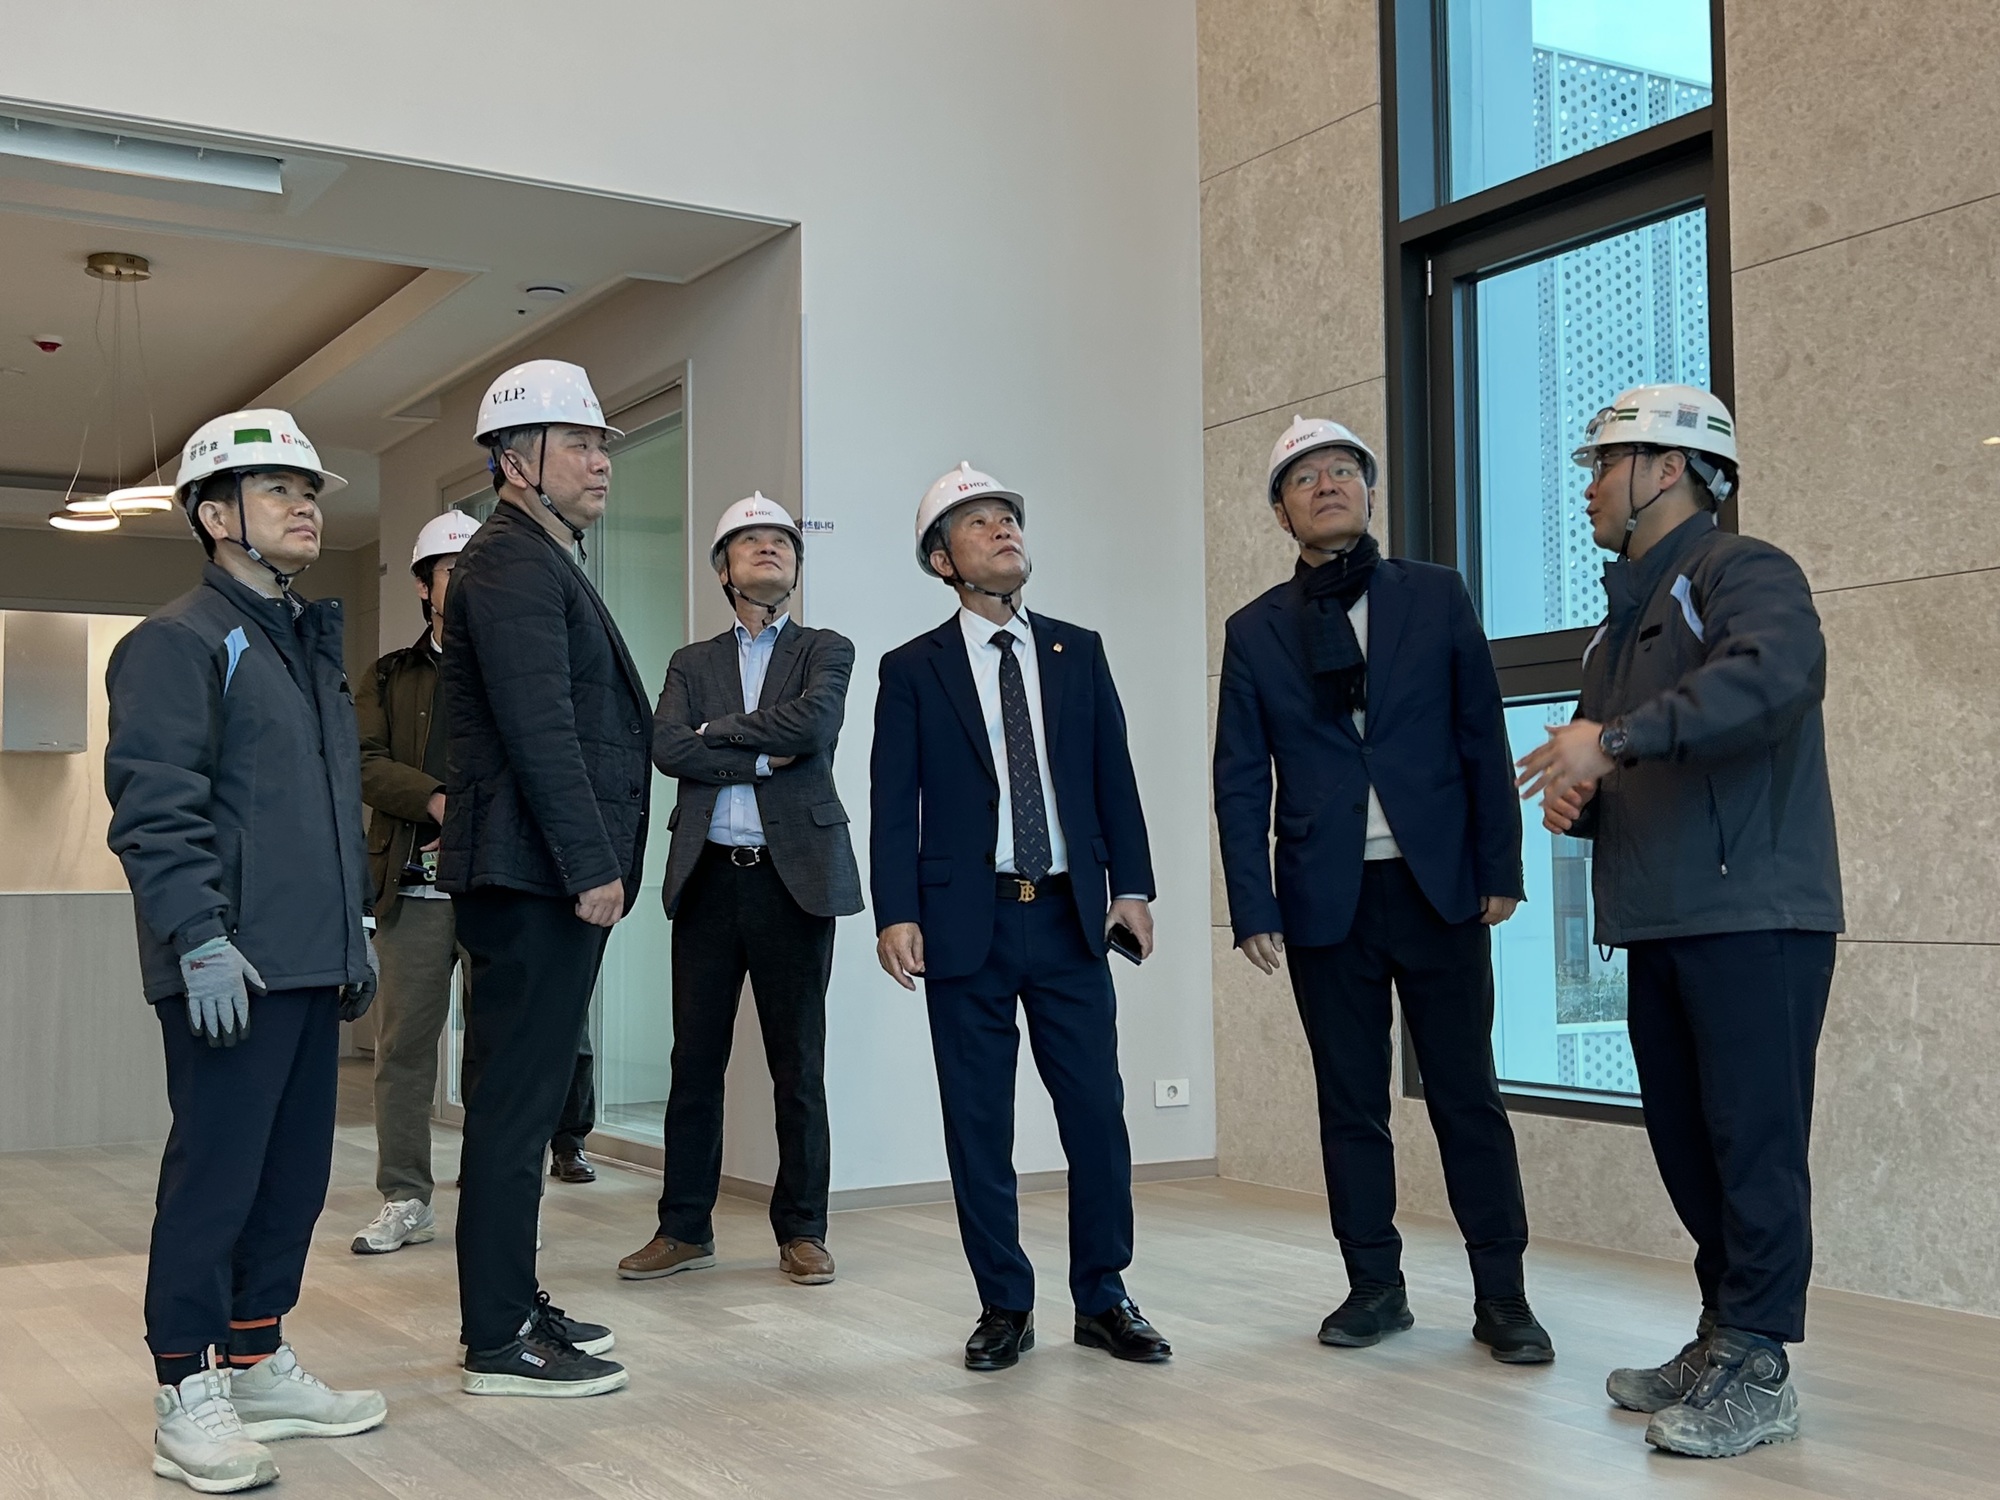


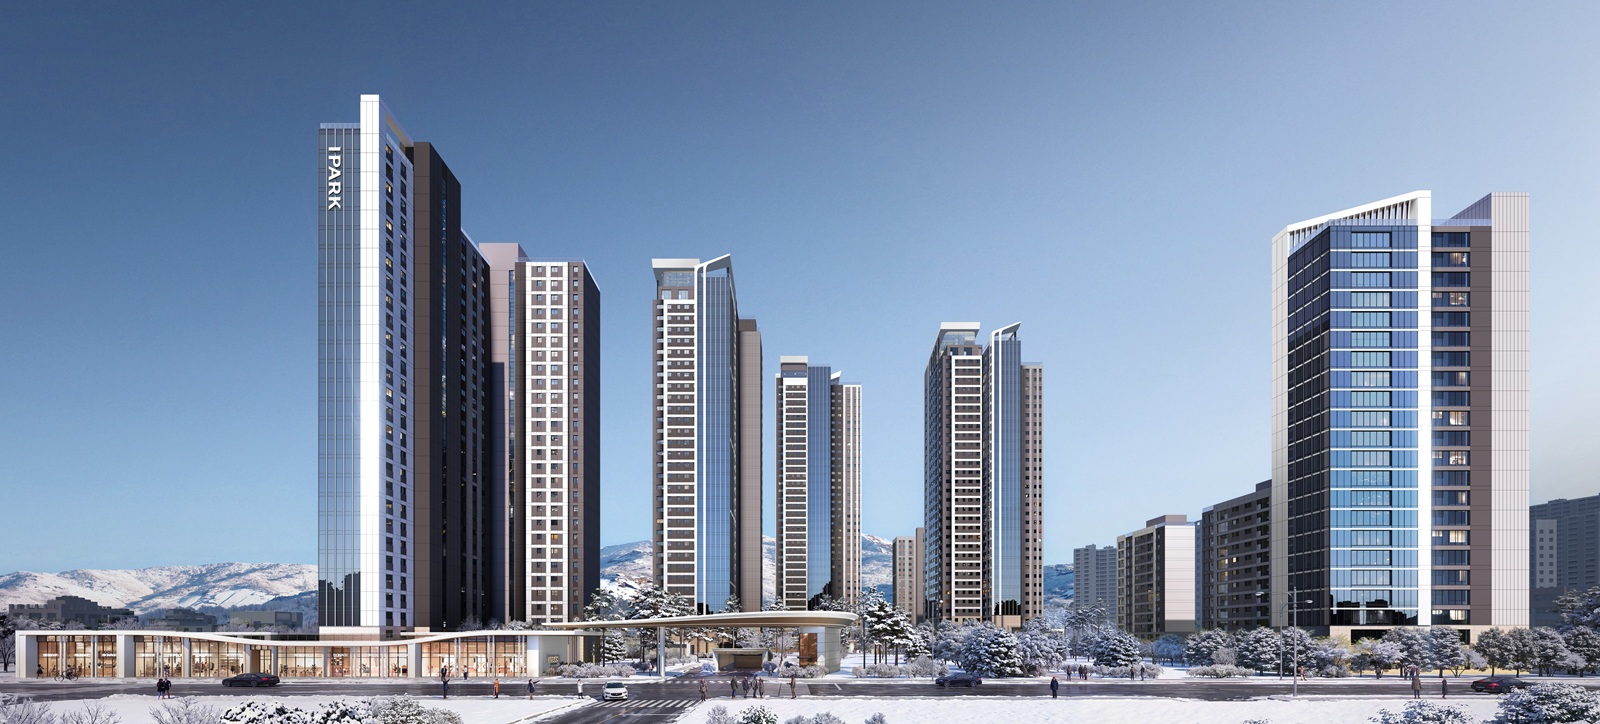
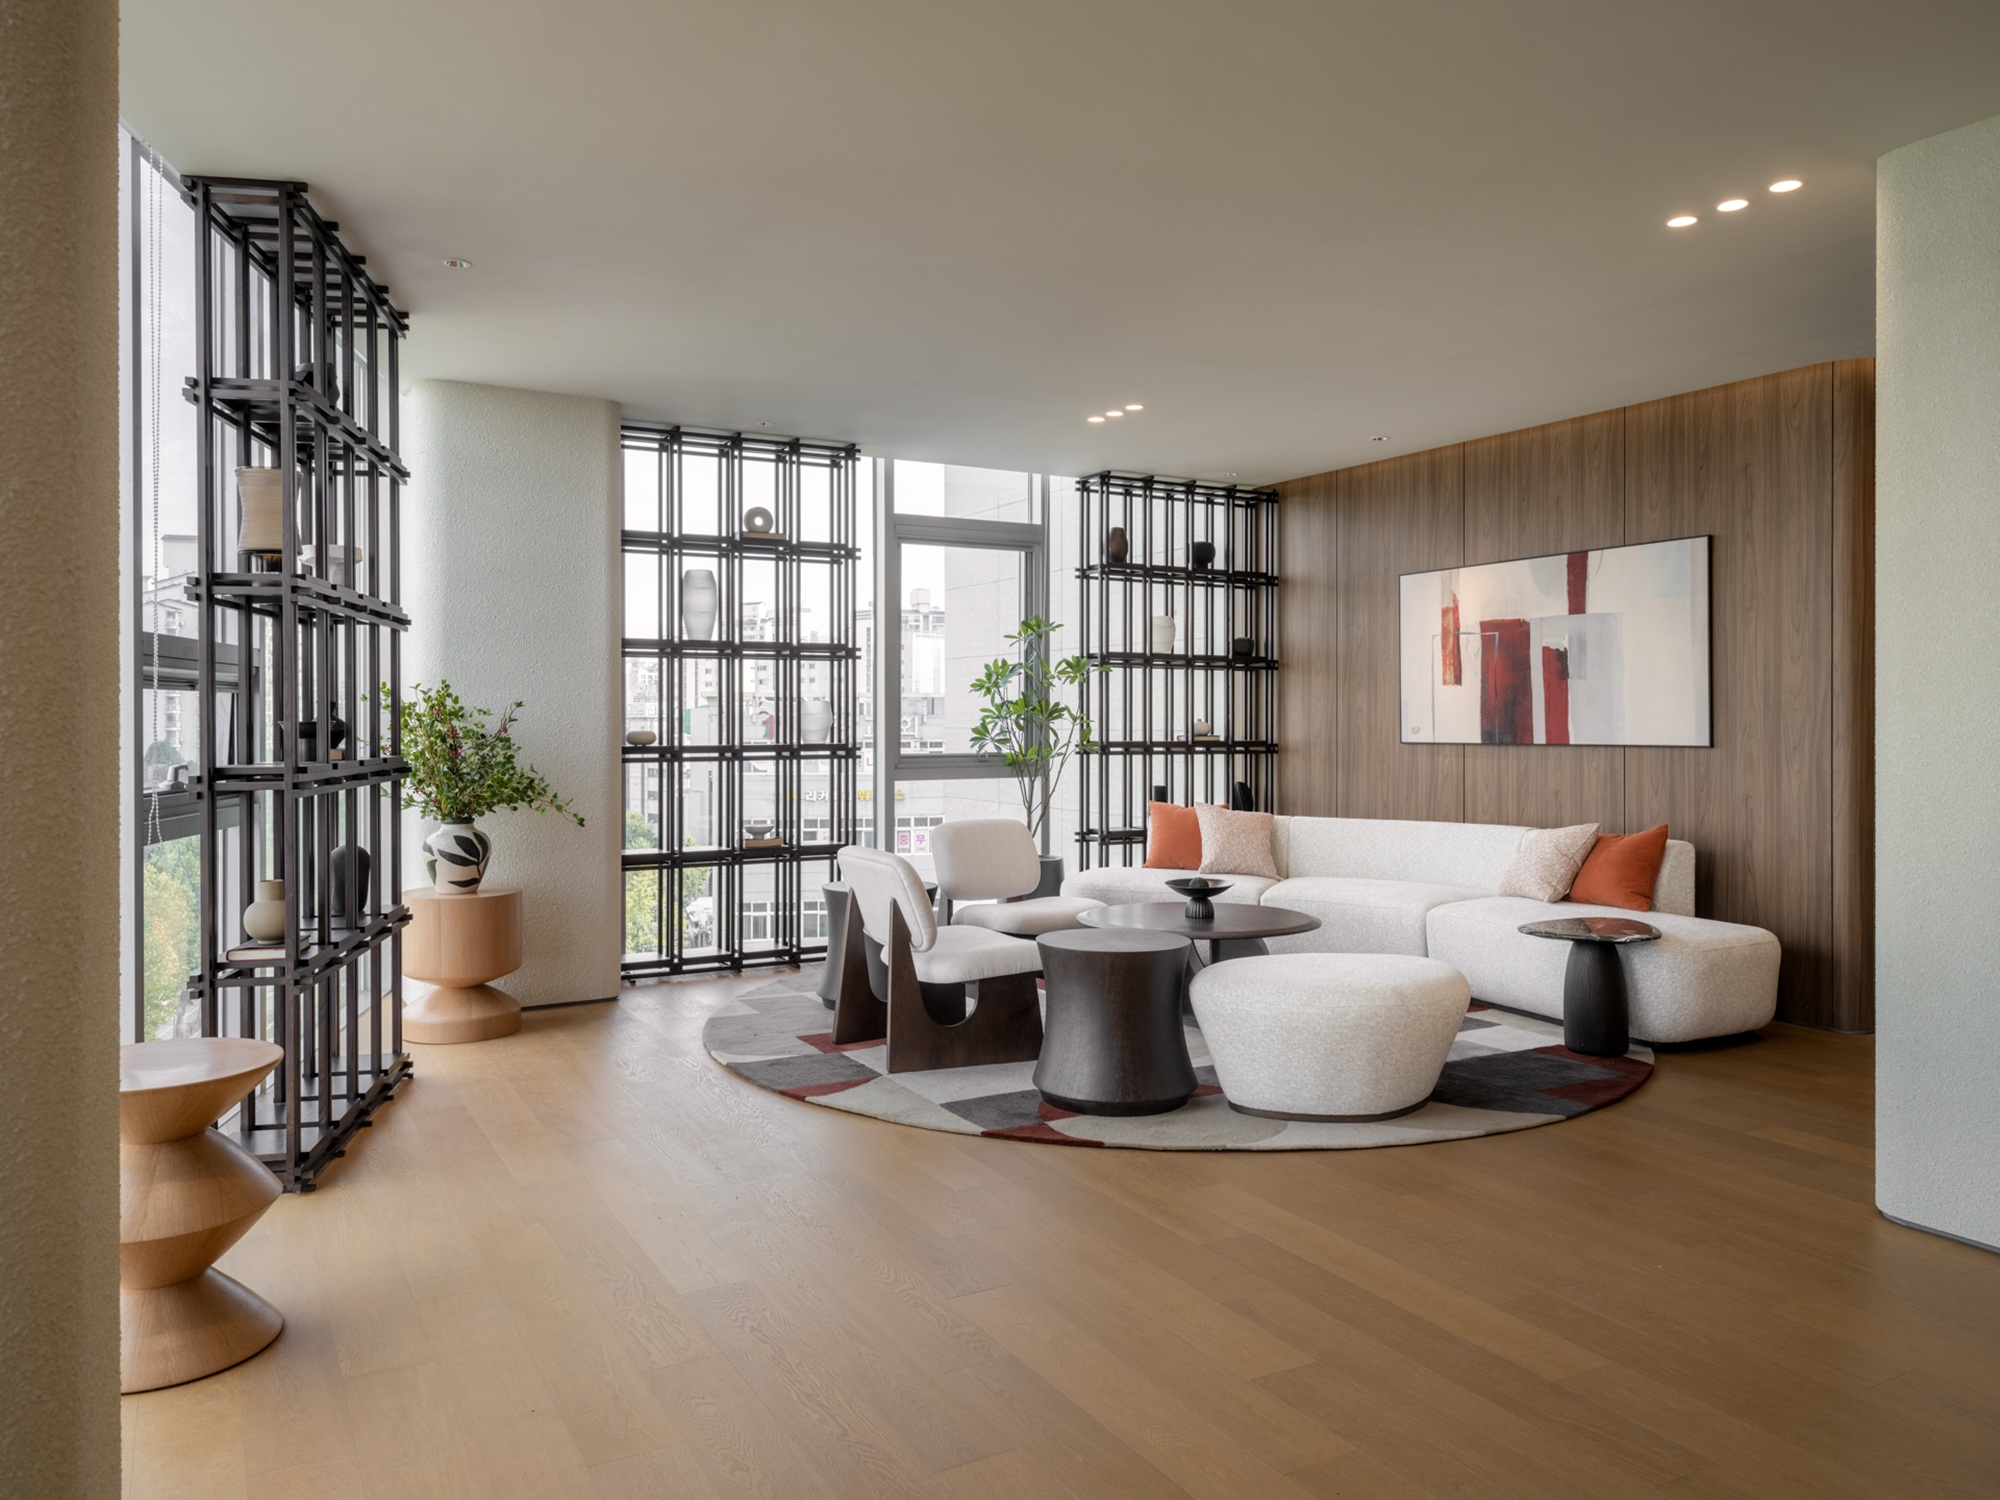







Prompts
Click prompts to add them under the company line, click again to take one out, then copy the result into your AI chat. Shared by Asian Century Stocks and Uncovered Thai Stocks. Thank you.
IPARK-DVP (ticker 294870), listed in South Korea.
Copied
ETFs Holding IPARK-DVP
Exchange-traded funds whose newest published daily portfolio holds one of the company's listings, largest weight first.
| ETF | Weight in ETF | Shares | Market value | As of |
|---|---|---|---|---|
| AVEE | 0.07% | 5,280 | $ 94.965K | Nov 16, 2026 |
| AVES | 0.06% | 47,081 | $ 846.789K | Nov 16, 2026 |
| AVSE | 0.02% | 2,365 | $ 42.536K | Nov 16, 2026 |
| AVXC | 0.02% | 4,936 | $ 88.778K | Nov 16, 2026 |
| DFSE | 0.02% | 6,152 | $ 110.282K | Nov 12, 2026 |
| DFEV | 0.02% | 22,972 | $ 411.802K | Nov 12, 2026 |
| DEXC | 0.01% | 2,191 | $ 39.276K | Nov 12, 2026 |
| DFEM | 0.01% | 55,339 | $ 992.022K | Nov 12, 2026 |
| AVEM | 0.01% | 120,800 | $ 2.173M | Nov 16, 2026 |
| DFAE | 0.01% | 35,459 | $ 635.647K | Nov 12, 2026 |
| DFAX | 0.01% | 34,927 | $ 626.111K | Nov 12, 2026 |