기업설명회(IR)개최
Bull 0
Bear 0
Routine
257720
|
Silicon2 is a global K-Beauty distribution platform that operates B2B wholesale and B2C e-commerce businesses. The company sources and distributes Korean beauty products through its proprietary platforms, StyleKorean.com for retail and StyleKorean Wholesale for corporate buyers, serving customers worldwide. Its business segments include Brand Management, Corporate Account, Personal Account, Fulfillment, and Marketing services. Silicon2 provides end-to-end solutions for K-Beauty brands, including overseas market entry support, logistics, and influencer marketing. The company operates a network of overseas subsidiaries and logistics centers in regions including North America, Europe, the Middle East, and Asia. It also runs the 'moida' offline retail concept to facilitate product experience and brand incubation. Silicon2 utilizes automated guided vehicle (AGV) systems for its logistics operations and maintains a large inventory of K-Beauty SKUs to support global demand. Summarised from the company's own disclosures, fiscal year ended Mar 2026 |
Industry Internet Retail | Homepage siliconii.com |
| Sector Consumer Cyclical | IR page siliconii.com | |
|
Tags
k-beauty, b2b wholesale, b2c e-commerce, cosmetics distribution, fulfillment services, influencer marketing, brand incubation, logistics automation, StyleKorean.com, StyleKorean Wholesale, moida, StyleKorean Middle East FZE, StyleKorean MX S.R.L de C. V., StyleKorean Vietnam Co. Ltd., StyleKorean MY Sdn. Bhd., PT. StyleKorean Indonesia, MOIDA Limited Liability Company
|
Press page — |
Metrics
| Valuation | |
|---|---|
| Market cap | ₩ 3.148T |
| Market cap (USD) | $ 2.317B |
| P/E | 13.51 |
| PEG | 0.09 |
| P/BV | 4.57 |
| P/S | 2.32 |
| P/OCF | 68.48 |
| P/FCF | 292.12 |
| Dividend yield | — |
| Turnover / mcap | — |
| Returns | |
|---|---|
| ROE | 46.9% |
| ROI | 36.9% |
| ROIC | 34.9% |
| Profit margin | 15.1% |
| Growth | |
|---|---|
| Revenue growing | Yes |
| Profits growing | Yes |
| Revenue up 3y | Yes |
| Revenue up 5y | — |
| Earnings growth 3y (net profit CAGR) | 147.2% |
| Quality | |
|---|---|
| Profitable | Yes |
| Margin expanding | No |
| Buying back stock | No |
| Diluting (TTM) | No |
| Debt/Equity | — |
| Podcast bulls (TTM) | Sign up |
| Podcast bears (TTM) | Sign up |
| Podcast sentiment (TTM) | Sign up |
| Podcast sentiment % (TTM) | Sign up |
| News sentiment (TTM) | — |
| Quality score | 25.0% |
| Insiders | |
|---|---|
| Buys, 1w | Sign up |
| Buys, 1m | Sign up |
| Buys, 1y | Sign up |
| Sells, 1w | Sign up |
| Sells, 1m | Sign up |
| Sells, 1y | Sign up |
Sign up to see this company's insider trades
Filed figures
Lines the statements and their notes report beside the headline figures, read from the filings' XBRL as filed (no restatement applied), with figures computed from one filing's own lines. Cash-flow lines carry their cash direction: an outflow is negative. Each period links to its filing; a figure's period, report date and tag are in its tooltip.
| Figure | Dec 2021 | Dec 2022 | Dec 2023 | Dec 2024 | Dec 2025 |
|---|---|---|---|---|---|
| Balance sheet detail | |||||
| Trade receivables (KRW) | 5.43B | 6.12B | 21.3B | 42.2B | 96.1B |
| ↳ YoY growth | +12.8% | +247.6% | +98.3% | +127.6% | |
| Borrowings, current (KRW) | 1.01B | 20.1B | 55B | 145B | 41.5B |
| Borrowings, non-current (KRW) | 3.56B | 3.69B | 3.64B | 56.5M | 42.8M |
| Lease liabilities (KRW) | 2.12B | 1.28B | 5.03B | 10B | 21.2B |
| Cash and deposits (KRW) | 16.1B | 21.2B | 17.2B | 86B | 77.3B |
| Intangible assets (KRW) | 165M | 90.8M | 661M | 1.65B | 1.76B |
| Right-of-use assets (KRW) | 2.2B | 1.3B | 5.08B | 9.01B | 19.7B |
| Net debt (borrowings + leases - cash) (KRW) | -9.4B | 3.9B | 46.5B | 69.2B | -14.5B |
| Cash flow detail | |||||
| Operating cash flow (KRW) | 2.48B | 9.85B | -18.5B | 60.1B | 1.14B |
| Purchases of property, plant and equipment (KRW) | — | -22.8B | -18.3B | -75.8B | -6.88B |
| Purchases of intangible assets (KRW) | — | -632,262 | -607M | -871M | -159M |
| Interest paid (cash effect) (KRW) | — | -196M | -38.4M | -5.84B | -5.29B |
| Income taxes paid (cash effect) (KRW) | — | -2.46B | -4.57B | -21.1B | -35.8B |
| Free cash flow (OCF - PPE - intangibles) (KRW) | — | -12.9B | -37.4B | -16.5B | -5.9B |
| Income detail | |||||
| Total comprehensive income (KRW) | 8.94B | 11.6B | 38.1B | 126B | 168B |
| Reported | Mar 20, 2024 | Apr 8, 2025 | Apr 8, 2025 | Apr 8, 2025 | Mar 20, 2026 |
Sign up to see institutional holdings
Sign UpPodcast Mentions
Sign up to see podcast mentions and sentiment
Sign UpDisclosures filed with DART (material events and exchange disclosures), newest first, headlines as filed in Korean. The link opens the filing on DART. Press releases from the company's own website, newest first.
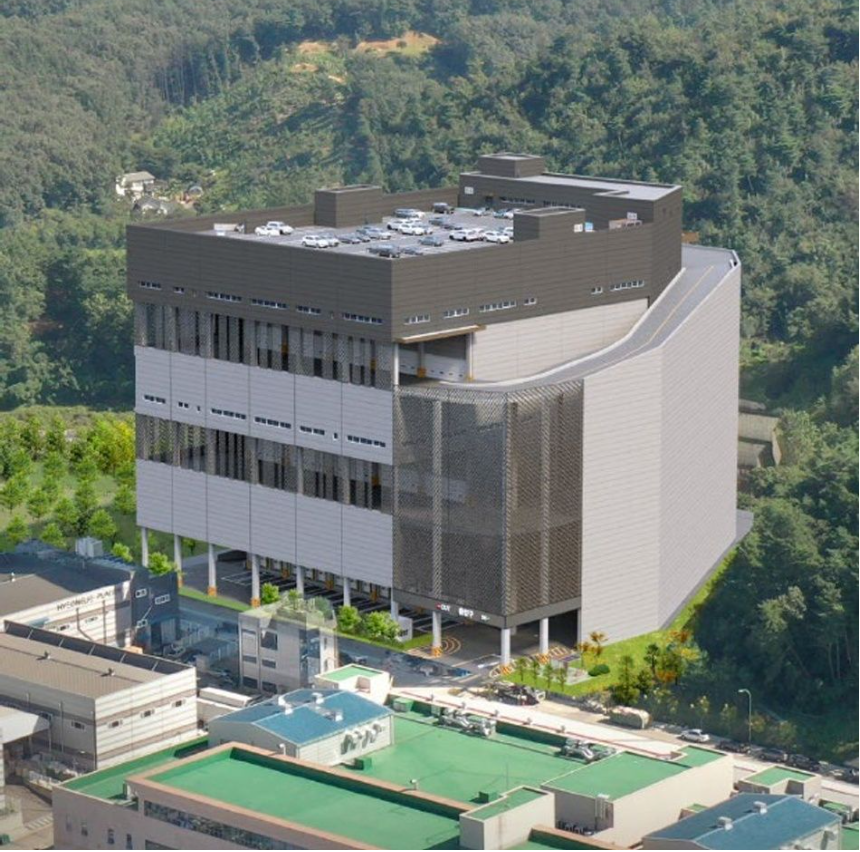 용인테크노밸리 일반산업단지실리콘투(대표 김성운)가 급증하는 글로벌 K뷰티 수요에 대응하고 물류 인프라를 강화하기 위해 경기도 용인시 소재 대형 물류센터를 매입 계약을 체결했다.



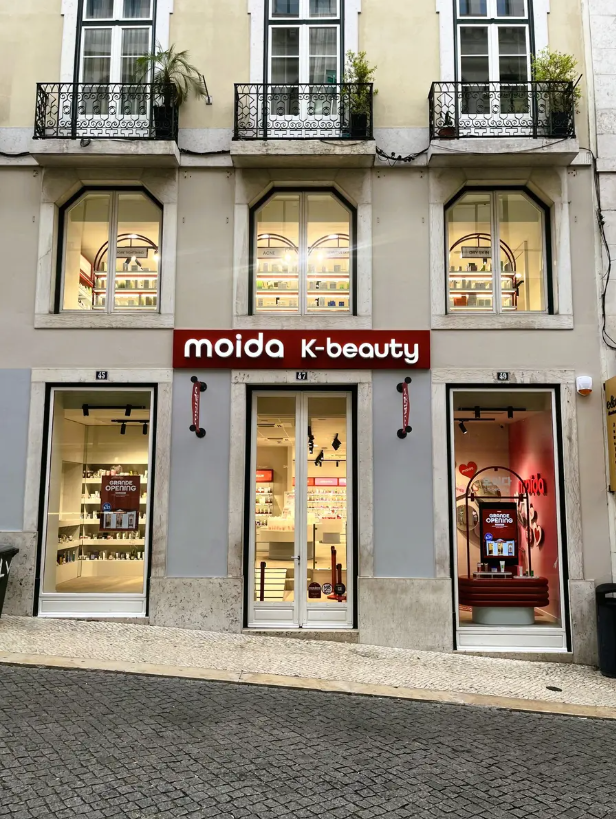
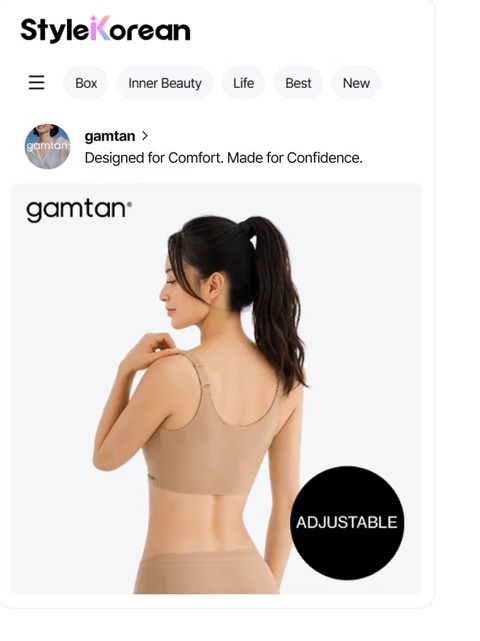 실리콘투가 글로벌 온라인 플랫폼 '스타일코리안닷컴'에 국내 언더웨어 브랜드 '감탄브라'를



 이번에 CVC로부터 3000억원을 투자유치한 실리콘투(실리콘투)
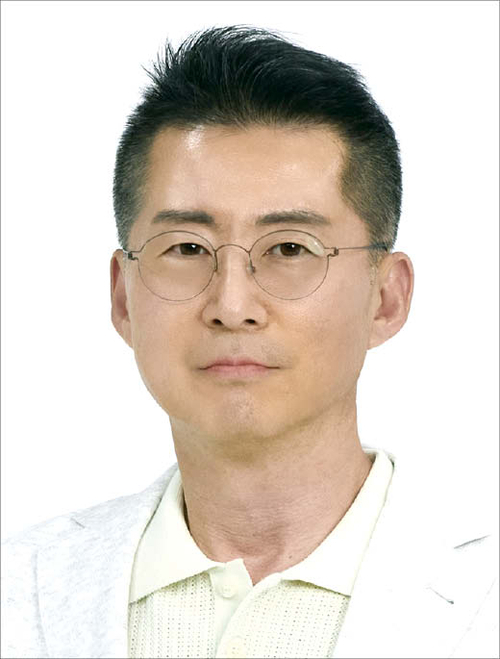 김성운 실리콘투 대표(실리콘투)

 Silicon2_FactSheet_262Q.pdf (625.6 KB)

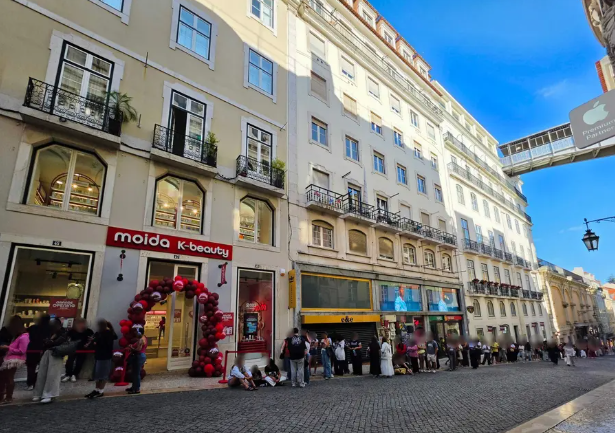
 샹젤리제 모이다 오픈. 사진=실리콘투
 샹젤리제 모이다 오픈. 사진=실리콘투


Prompts
Click prompts to add them under the company line, click again to take one out, then copy the result into your AI chat. Shared by Asian Century Stocks and Uncovered Thai Stocks. Thank you.
Silicon2 (ticker 257720), listed in South Korea.
Copied
ETFs Holding Silicon2
Exchange-traded funds whose newest published daily portfolio holds one of the company's listings, largest weight first.
| ETF | Weight in ETF | Shares | Market value | As of |
|---|---|---|---|---|
| DFSE | 0.02% | 5,919 | $ 110.777K | Nov 12, 2026 |
| DEXC | 0.01% | 1,281 | $ 23.975K | Nov 12, 2026 |
| DFEM | 0.01% | 38,449 | $ 719.591K | Nov 12, 2026 |
| DFAE | 0.01% | 25,251 | $ 472.584K | Nov 12, 2026 |
| DFAX | 0.00% | 27,653 | $ 517.539K | Nov 12, 2026 |
| DFEV | 0.00% | 1,428 | $ 26.726K | Nov 12, 2026 |
| AVXC | 0.00% | 58 | $ 1,022.82 | Nov 16, 2026 |