분기보고서 (2026.09)
Bull 0
Bear 0
Routine
248070
|
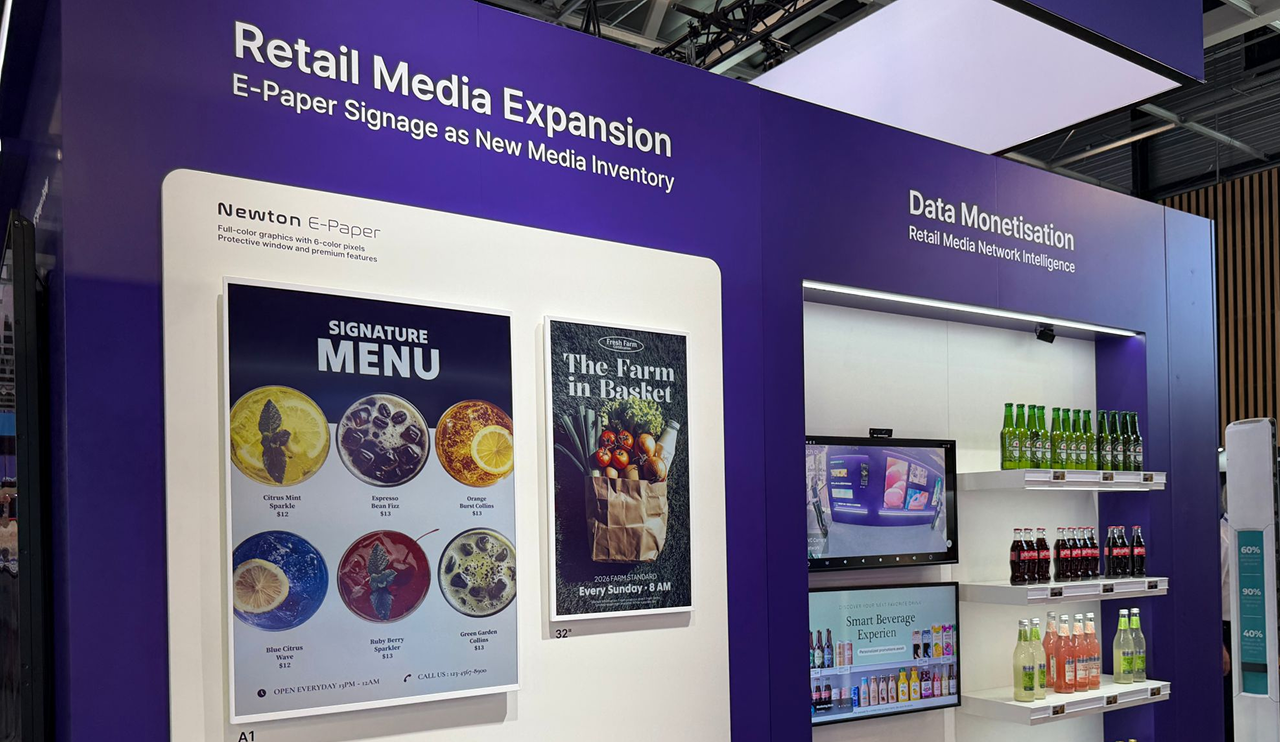
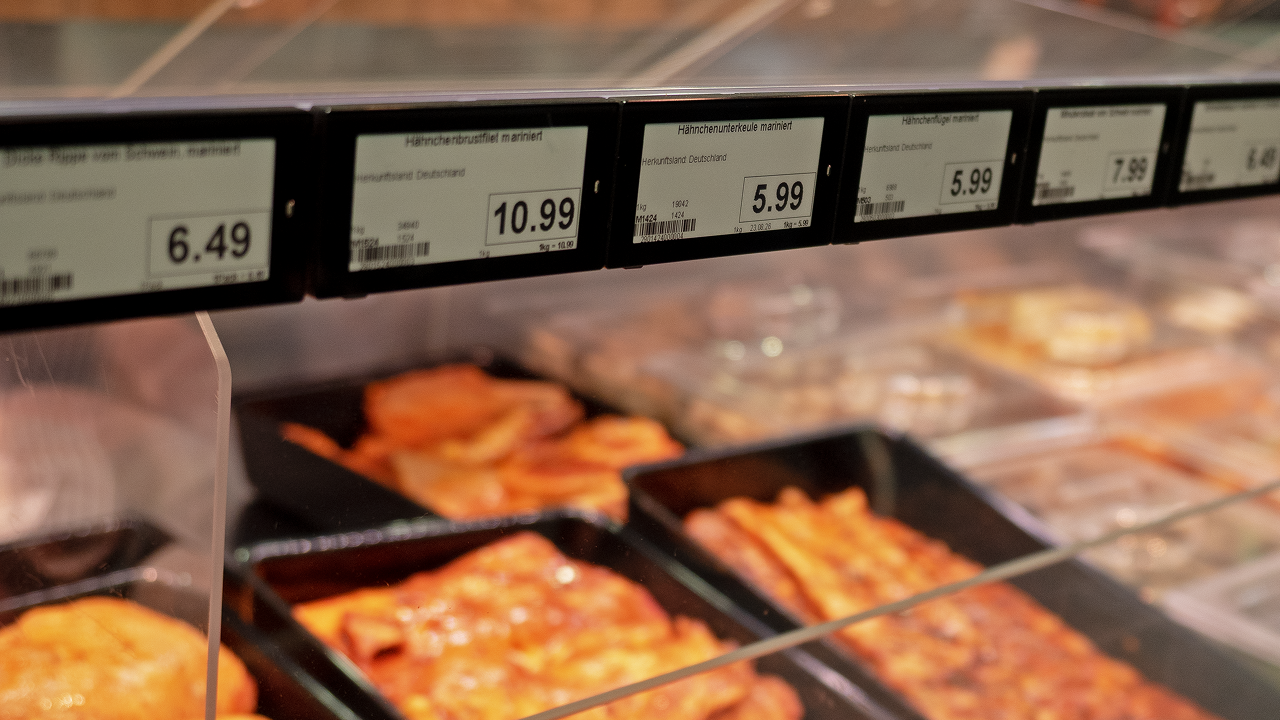
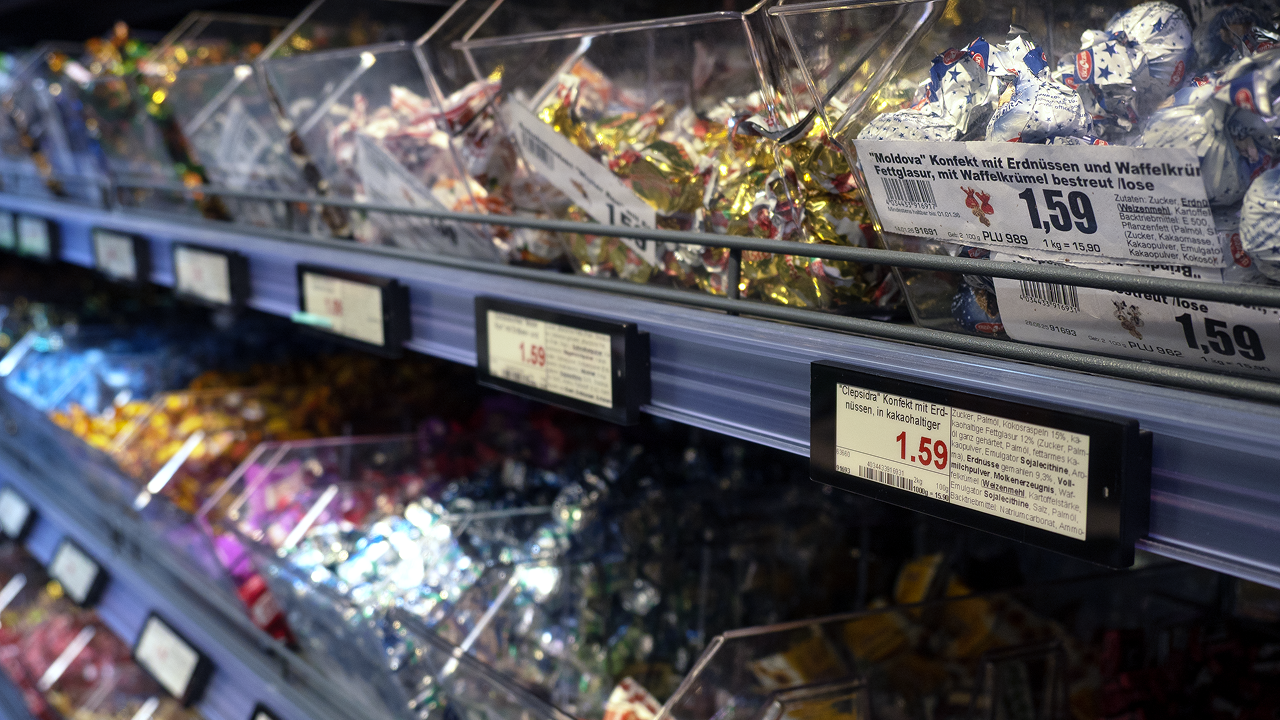
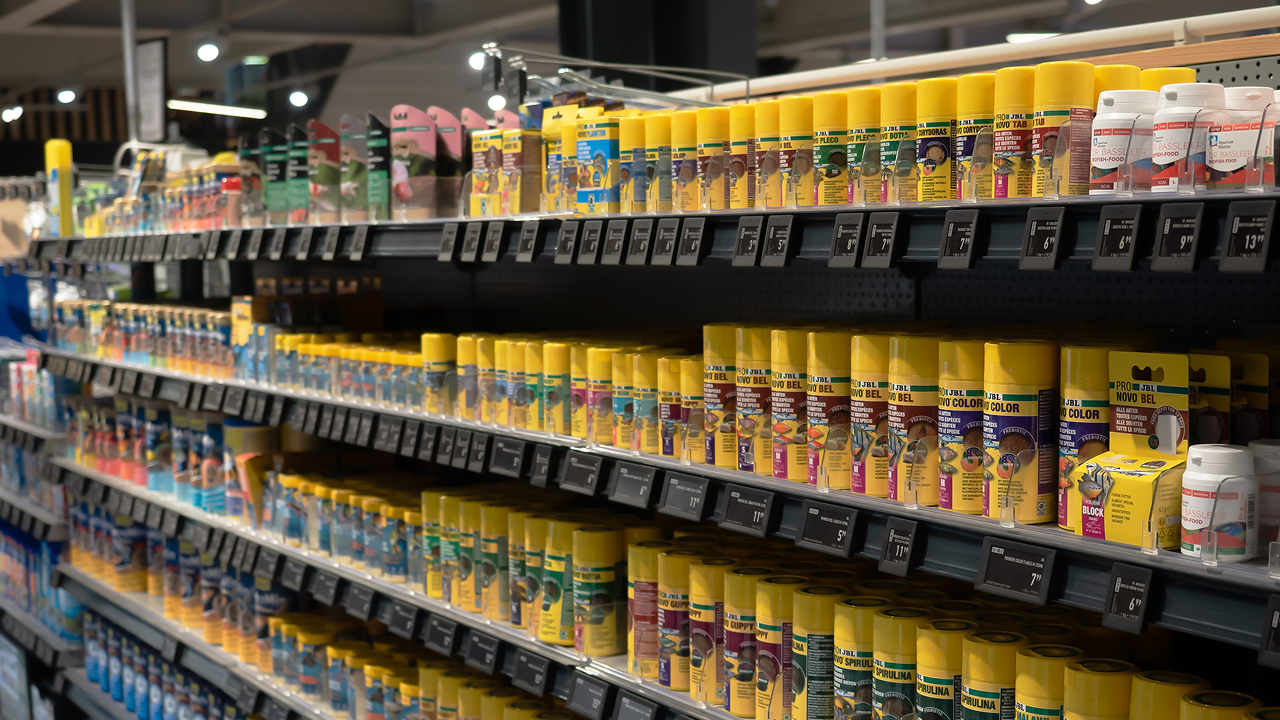
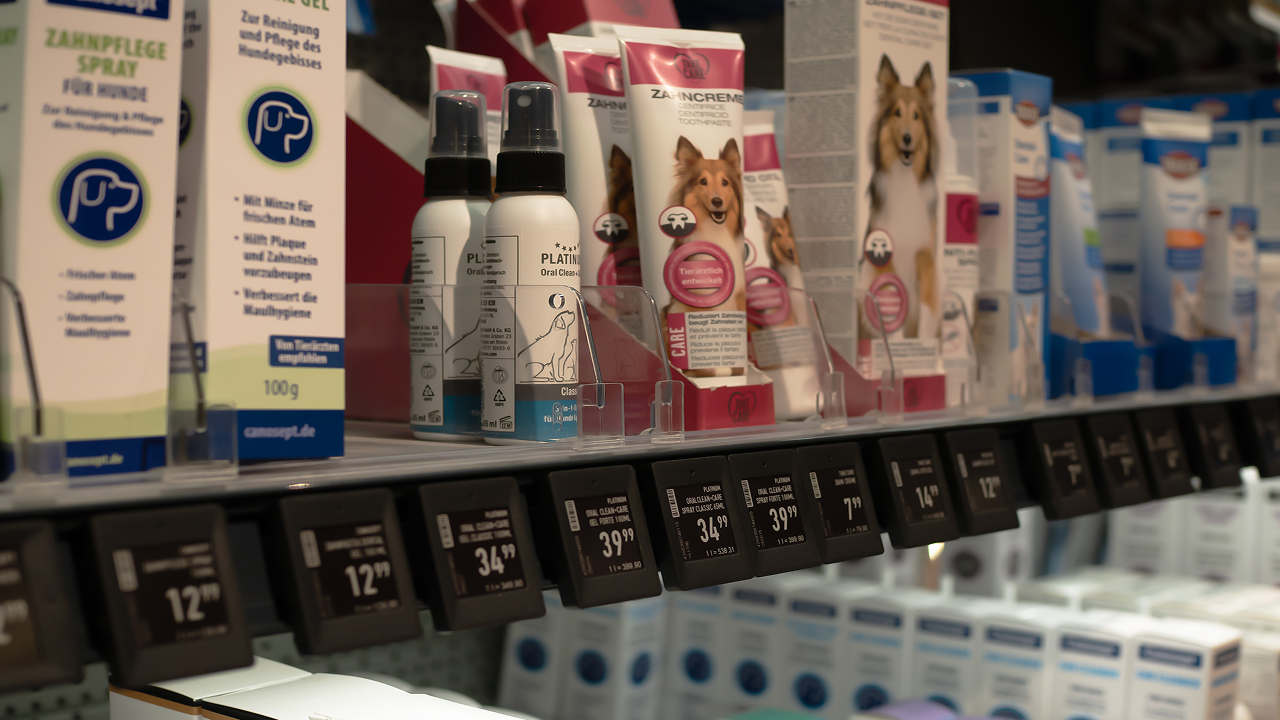
SOLUM is a South Korean manufacturer of electronic components and smart retail solutions, operating through two main business segments: electronic components and ICT. The company develops and produces power modules, including TV power supplies (SMPS), mobile and laptop adapters, server power modules, lighting power modules, and EV charger power modules. Its Visual Solution line features 3-in-1 boards that integrate power, tuner, and video board functions, as well as digital signage products. In the ICT segment, SOLUM manufactures electronic shelf labels (ESL) using e-paper technology and proprietary communication protocols, along with IoT and sensor-based solutions. The company supplies major global retailers such as Tesco, REWE, Metro, Carrefour, Lidl, and Macy's, as well as industrial clients including BMW, Volkswagen, and Bosch. SOLUM maintains production facilities in China, Vietnam, Mexico, India, and Indonesia, and sells directly to customers without intermediaries. It was spun off from Samsung Electro-Mechanics in 2015 and holds patents in transformer manufacturing and RF technology. Summarised from the company's own disclosures, fiscal year ended Mar 2026 |
Industry Electronic Components | Homepage solum-group.com |
| Sector Technology | IR page — | |
|
Tags
power modules, electronic shelf labels, 3-in-1 boards, digital signage, e-paper displays, ev charger power, server power, retail technology, iot solutions, sensor technology, SOLUM, 3IN1 board, ESL, SMPS, Tuner, IoT, Zigbee IC, E-paper, Central Server Solution, 3-Color ESL, Newton
|
Press page — |
Metrics
| Valuation | |
|---|---|
| Market cap | ₩ 702.854B |
| Market cap (USD) | $ 517.288M |
| P/E | 63.16 |
| PEG | — |
| P/BV | 1.23 |
| P/S | 0.38 |
| P/OCF | 99.13 |
| P/FCF | -10.39 |
| Dividend yield | — |
| Turnover / mcap | — |
| Returns | |
|---|---|
| ROE | 2.7% |
| ROI | 2.5% |
| ROIC | 4.2% |
| Profit margin | 0.79% |
| Growth | |
|---|---|
| Revenue growing | No |
| Profits growing | No |
| Revenue up 3y | No |
| Revenue up 5y | No |
| Earnings growth 3y (net profit CAGR) | -34.3% |
| Quality | |
|---|---|
| Profitable | Yes |
| Margin expanding | No |
| Buying back stock | No |
| Diluting (TTM) | Yes |
| Debt/Equity | — |
| Podcast bulls (TTM) | Sign up |
| Podcast bears (TTM) | Sign up |
| Podcast sentiment (TTM) | Sign up |
| Podcast sentiment % (TTM) | Sign up |
| News sentiment (TTM) | — |
| Quality score | -41.2% |
| Insiders | |
|---|---|
| Buys, 1w | Sign up |
| Buys, 1m | Sign up |
| Buys, 1y | Sign up |
| Sells, 1w | Sign up |
| Sells, 1m | Sign up |
| Sells, 1y | Sign up |
Sign up to see this company's insider trades
Filed figures
Lines the statements and their notes report beside the headline figures, read from the filings' XBRL as filed (no restatement applied), with figures computed from one filing's own lines. Cash-flow lines carry their cash direction: an outflow is negative. Each period links to its filing; a figure's period, report date and tag are in its tooltip.
| Figure | Dec 2018 | Dec 2019 | Dec 2020 | Dec 2021 | Dec 2022 | Dec 2023 | Dec 2024 | Dec 2025 |
|---|---|---|---|---|---|---|---|---|
| Balance sheet detail | ||||||||
| Trade receivables (KRW) | 90.7B | 83.4B | 126B | 157B | 166B | 125B | 174B | 185B |
| ↳ YoY growth | -8.1% | +50.7% | +24.8% | +5.8% | -24.6% | +39.0% | +6.5% | |
| ↳ 5y CAGR | +6.6% | +15.8% | +8.1% | |||||
| Borrowings, current (KRW) | 92.8B | 116B | 134B | 220B | 302B | 317B | 330B | 318B |
| Borrowings, non-current (KRW) | 63.7B | 11.9B | 14.1B | 34.1B | 57.1B | 25.3B | 542M | 110B |
| Bonds payable (KRW) | 45.2B | 38.6B | 17.7B | — | — | — | — | — |
| Lease liabilities (KRW) | — | 3.07B | 6.44B | 7.87B | 8.38B | 7.11B | 6.01B | 9.86B |
| Cash and deposits (KRW) | 29B | 59.2B | 67.3B | 52.7B | 107B | 132B | 85.9B | 157B |
| Intangible assets (KRW) | 13.2B | 11.4B | 10.6B | 15B | 12.7B | 13.3B | 15.2B | 35.4B |
| Right-of-use assets (KRW) | — | 5.34B | 8.37B | 9.9B | 10.5B | 9.34B | 7.91B | 11.7B |
| Net debt (borrowings + leases - cash) (KRW) | 127B | 71.5B | 87.4B | 209B | 260B | 218B | 251B | 281B |
| Cash flow detail | ||||||||
| Operating cash flow (KRW) | -29.9B | 90.7B | 42B | -179B | 40.9B | 337B | -5.33B | 54.6B |
| Purchases of property, plant and equipment (KRW) | -18.7B | -17.8B | -48.7B | -57.8B | -45.2B | -124B | -124B | -96.9B |
| Purchases of intangible assets (KRW) | -109M | -212M | -241M | -1.1B | -257M | -1.46B | -2.18B | -2.73B |
| Change in receivables (cash effect) (KRW) | — | — | — | -9.3B | -4.42B | -2.12B | — | — |
| Change in inventories (cash effect) (KRW) | -45.4B | 7.36B | -57.3B | -200B | -250B | 275B | — | — |
| Change in payables (cash effect) (KRW) | 40.7B | -26.9B | 63.8B | 306M | -306M | 37.2M | — | — |
| Share buybacks (cash effect) (KRW) | — | — | — | -1.55B | -21.1B | 0.00 | -17.2B | -2.61B |
| Interest paid (cash effect) (KRW) | -5.89B | -7.71B | -4.37B | -3.93B | -11.4B | -22.3B | -11B | -16.7B |
| Income taxes paid (cash effect) (KRW) | -3.65B | -2.12B | -3.15B | -3.38B | -6.94B | -13.3B | -23.5B | -13.7B |
| Share-based compensation (KRW) | 16.9M | — | — | 213M | 347M | 482M | — | — |
| Operating cash flow before change in receivables (KRW) | — | — | — | -170B | 45.4B | 339B | — | — |
| Free cash flow (OCF - PPE - intangibles) (KRW) | -48.7B | 72.7B | -6.86B | -238B | -4.51B | 212B | -131B | -45B |
| Income detail | ||||||||
| Total comprehensive income (KRW) | -17.1B | 37.7B | 34.7B | 18.3B | 41.9B | 108B | 48.5B | 13B |
| Comprehensive income to owners (KRW) | -17.1B | 37.7B | 34.7B | 18.4B | 43.7B | 109B | 50.3B | 12.3B |
| Provision for credit losses (KRW) | 287M | -52.8M | 179M | 92.5M | 6.9M | 549M | — | — |
| Credit cost ratio (credit losses / average receivables) (%) | — | 0.1% | 0.2% | 0.1% | 0.0% | 0.4% | — | — |
| Reported | Apr 21, 2021 | Apr 21, 2021 | Apr 21, 2021 | Mar 19, 2024 | Mar 19, 2024 | Aug 13, 2025 | Aug 13, 2025 | Mar 25, 2026 |
Sign up to see institutional holdings
Sign UpPodcast Mentions
Sign up to see podcast mentions and sentiment
Sign UpDisclosures filed with DART (material events and exchange disclosures), newest first, headlines as filed in Korean. The link opens the filing on DART. Press releases from the company's own website, newest first.
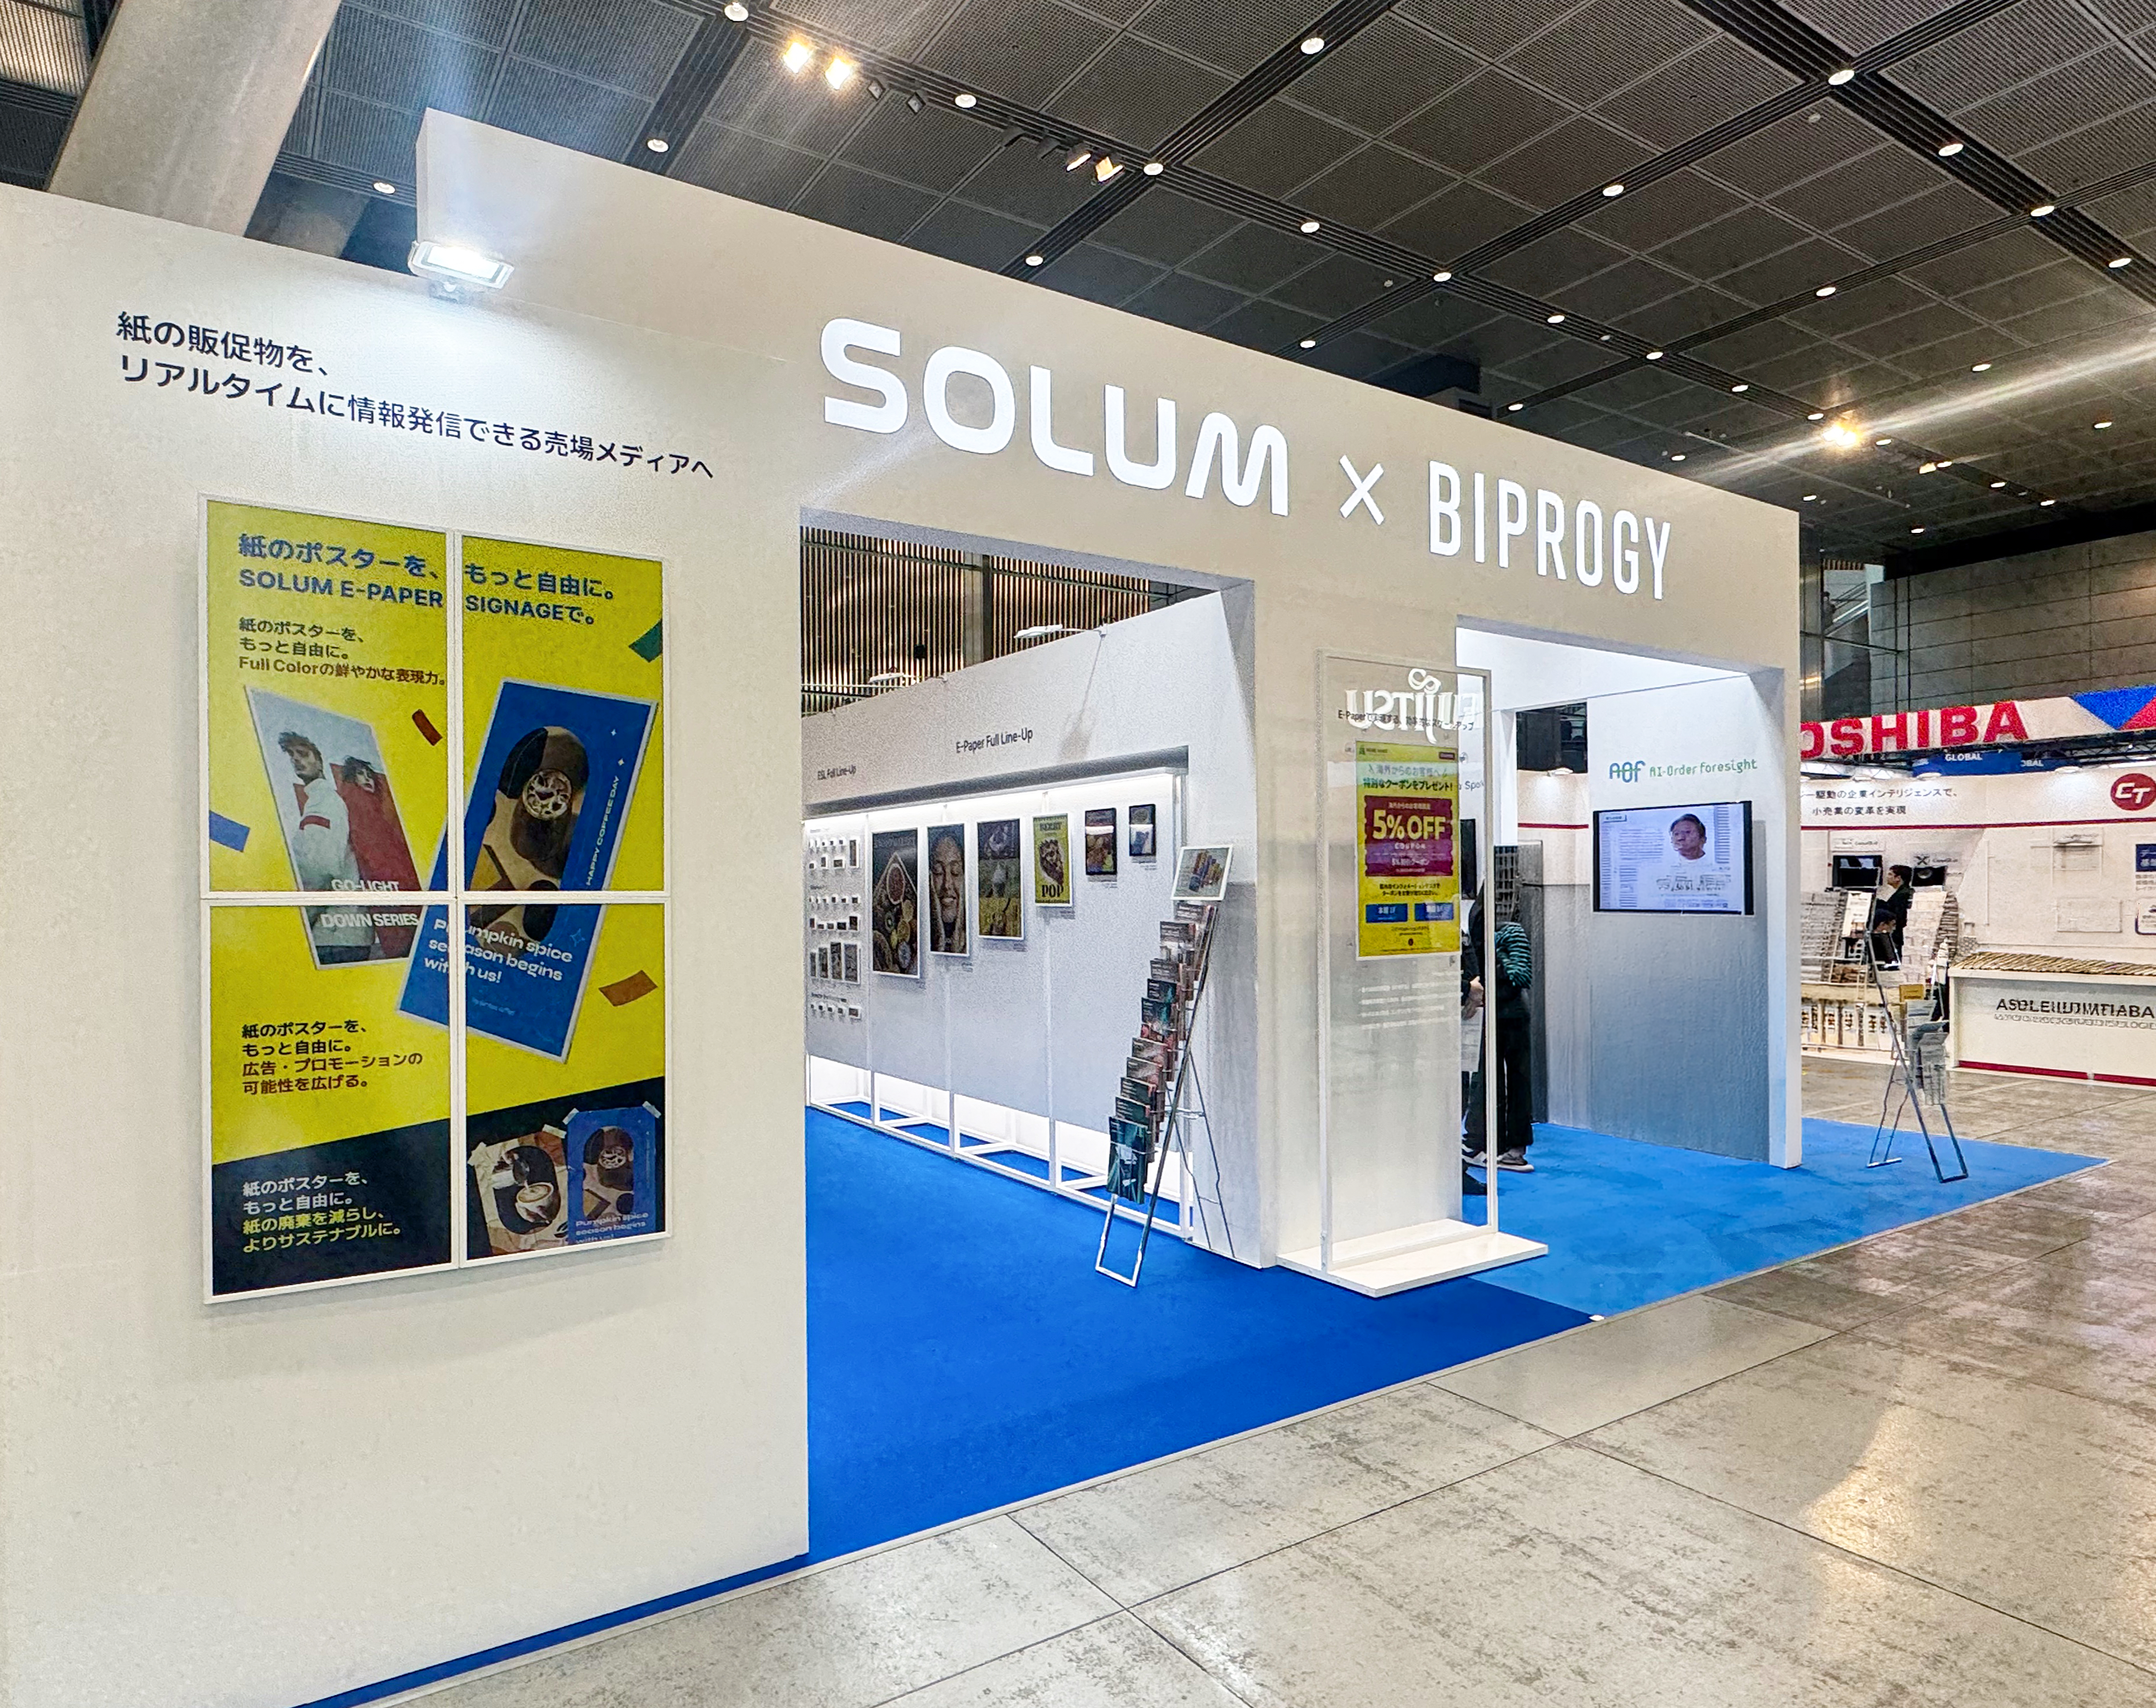
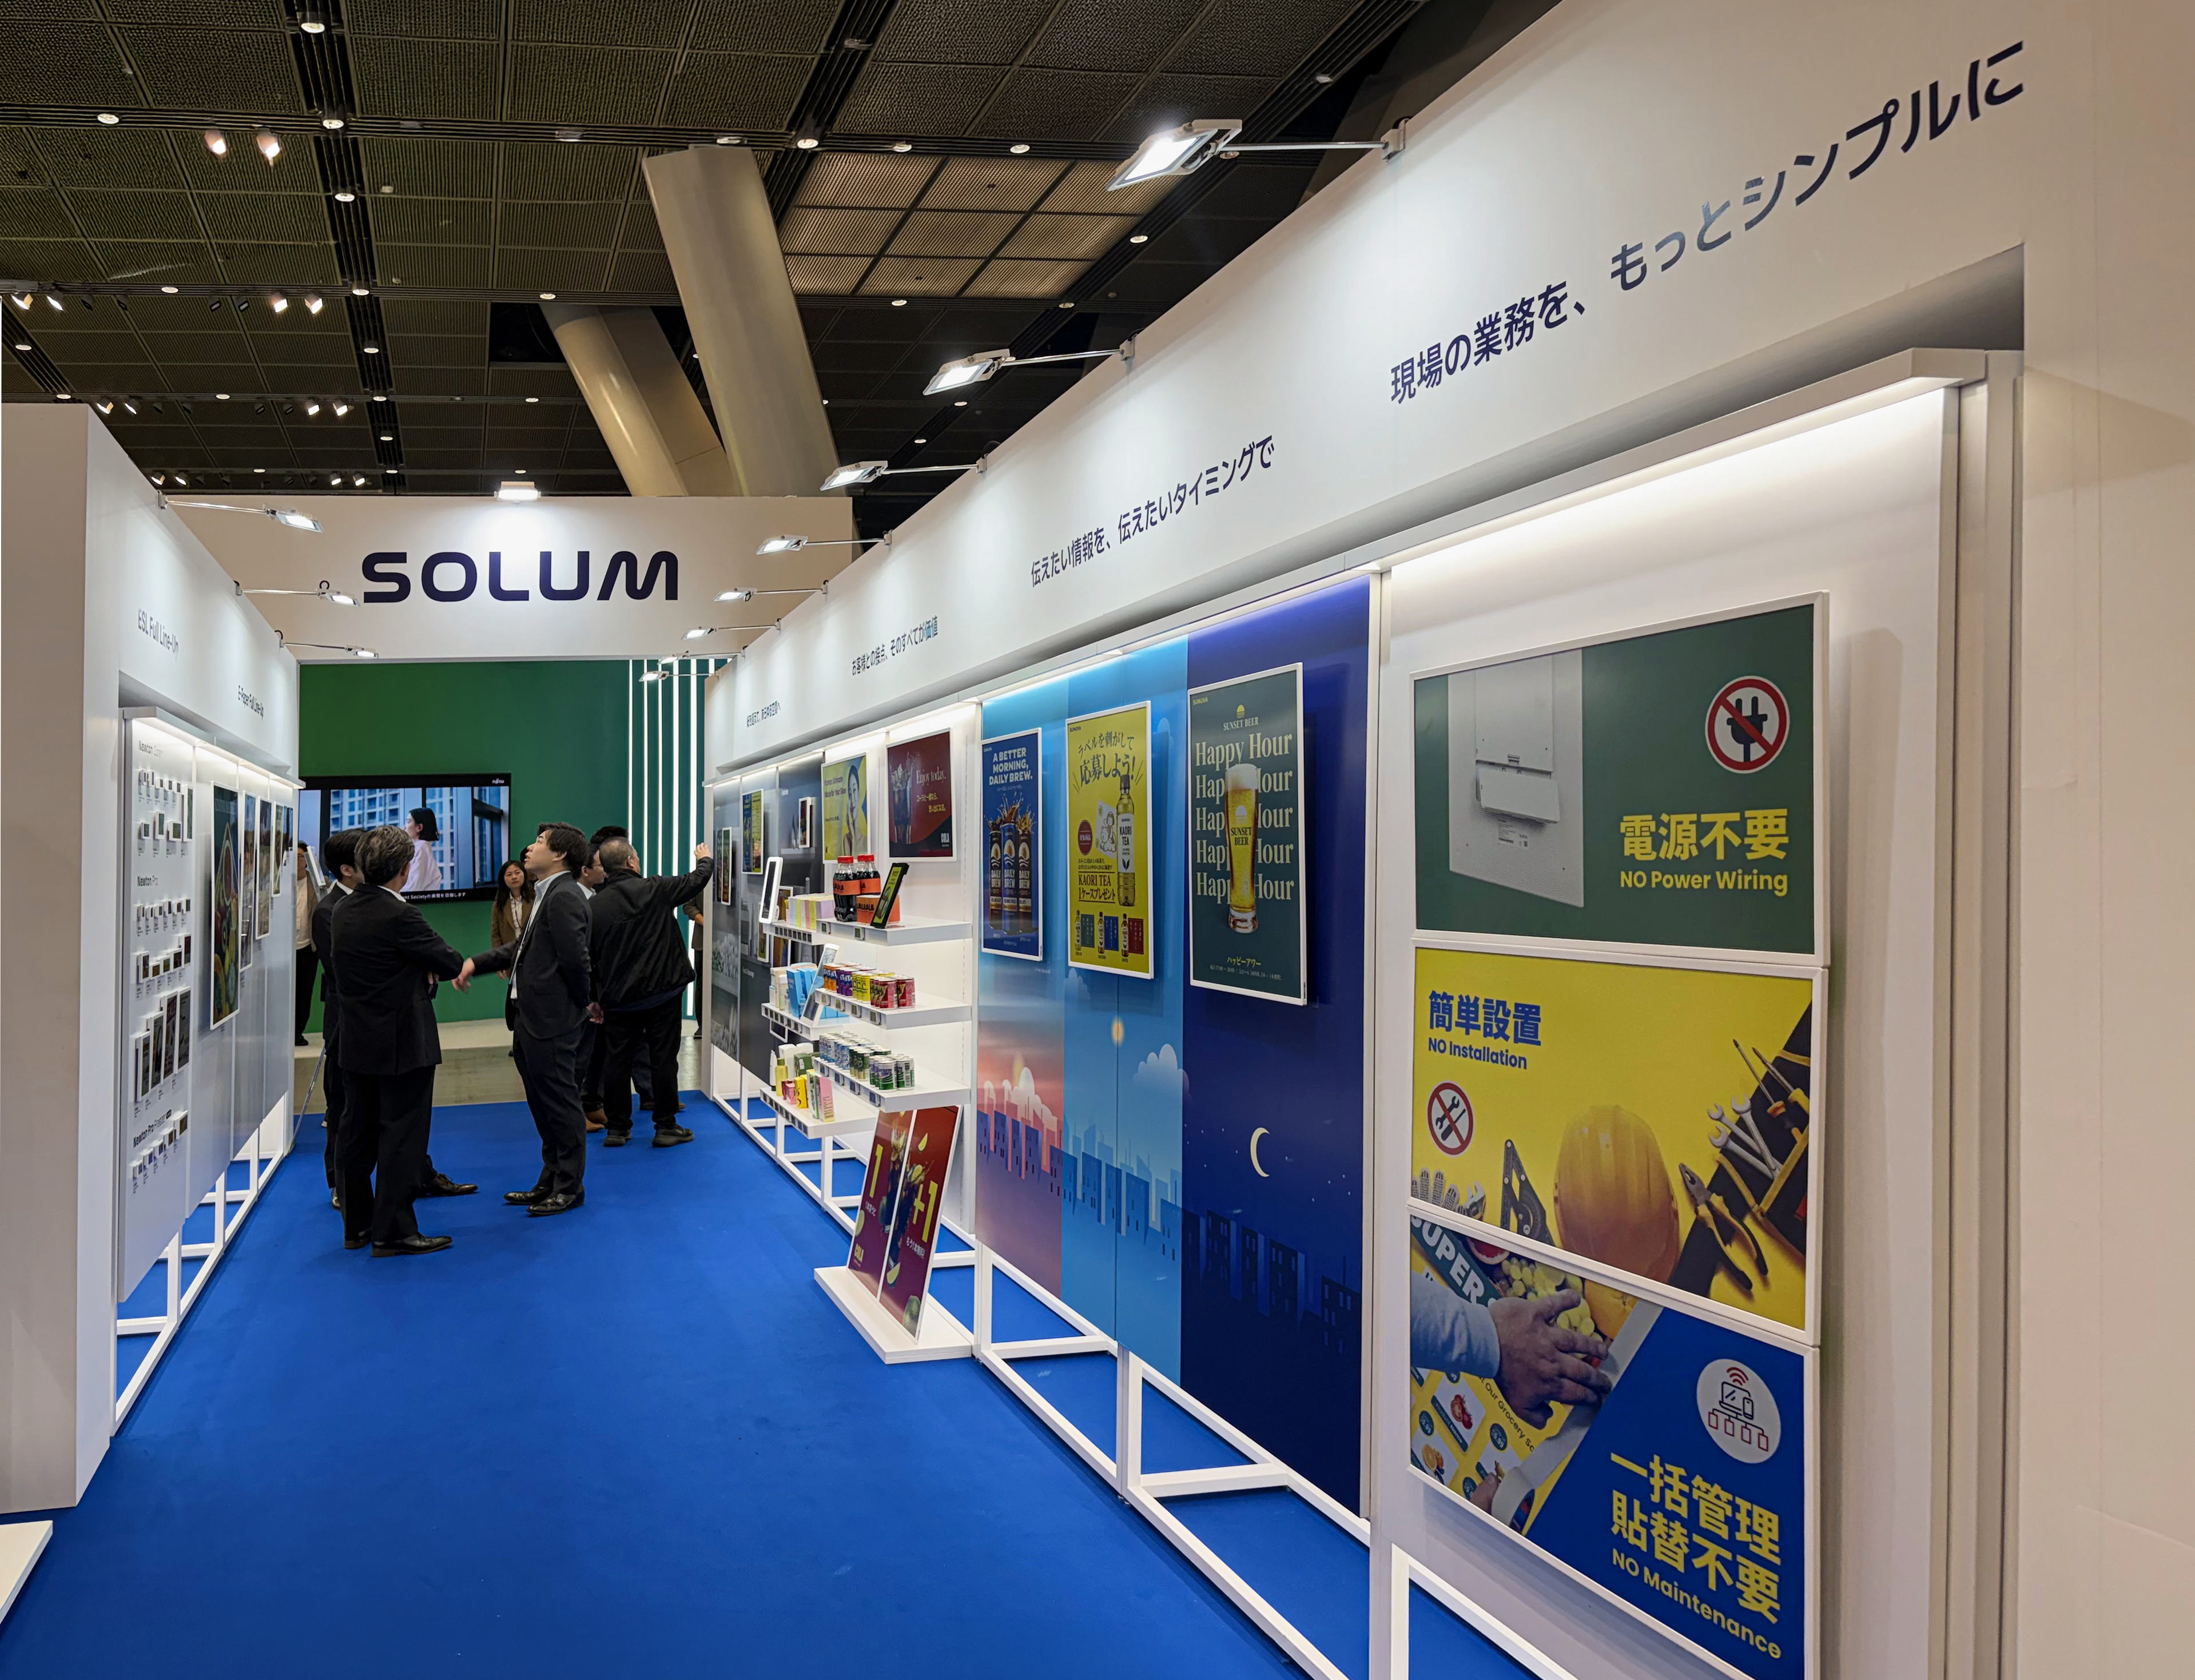
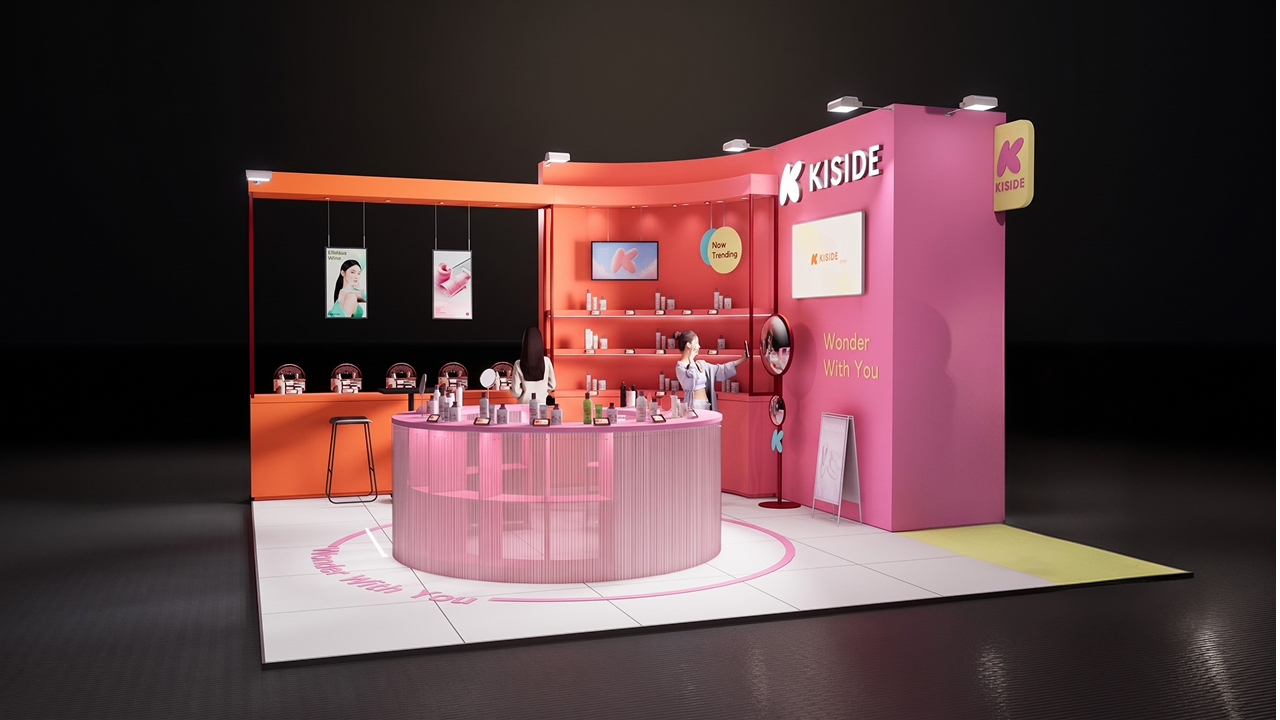
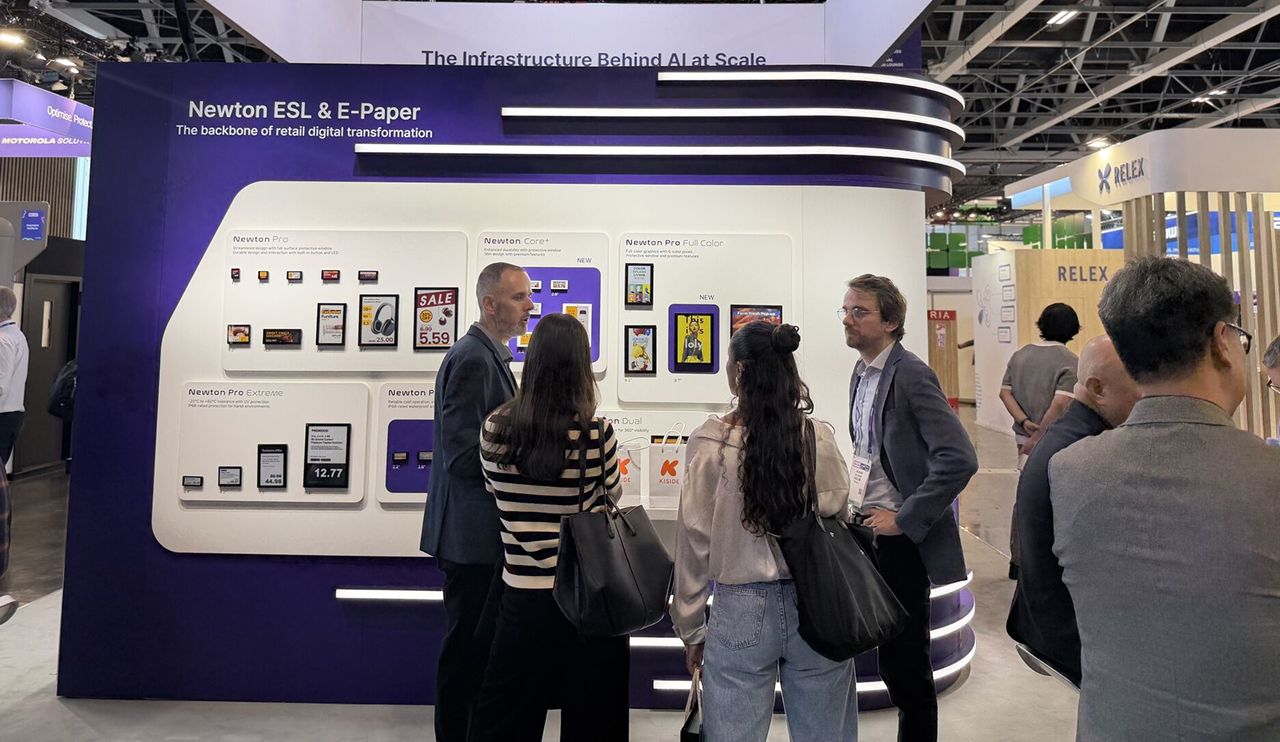
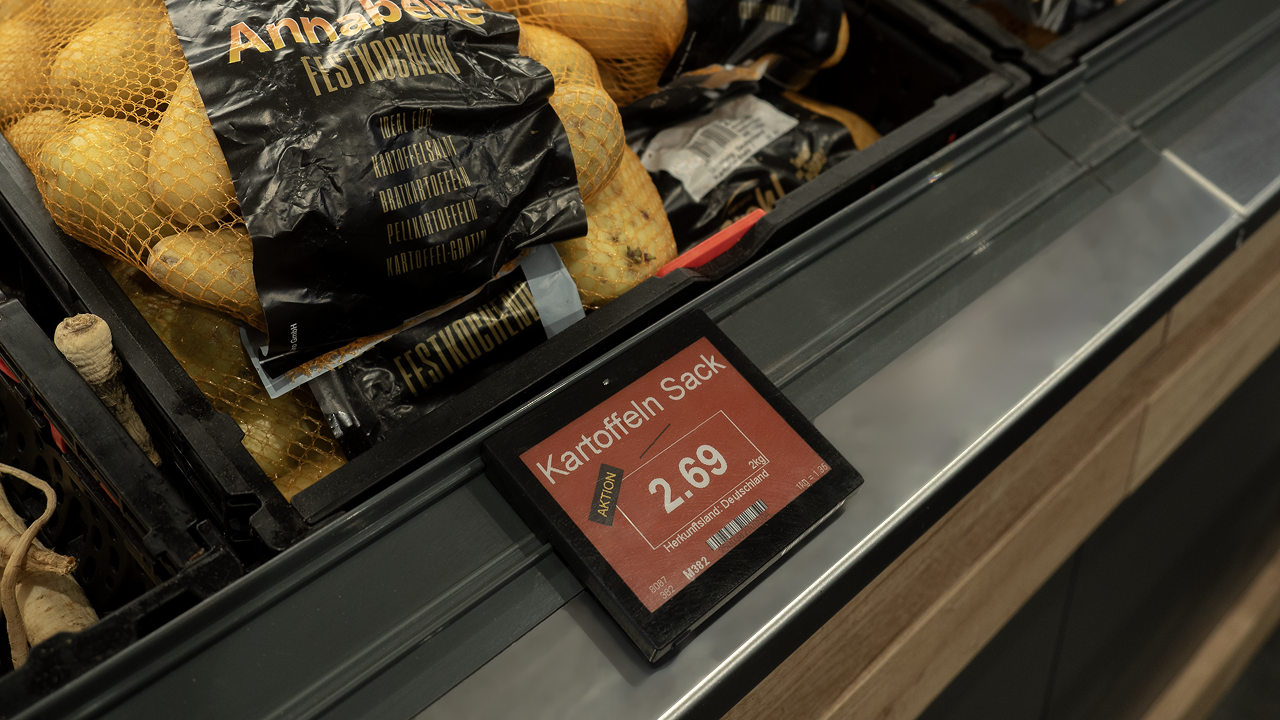
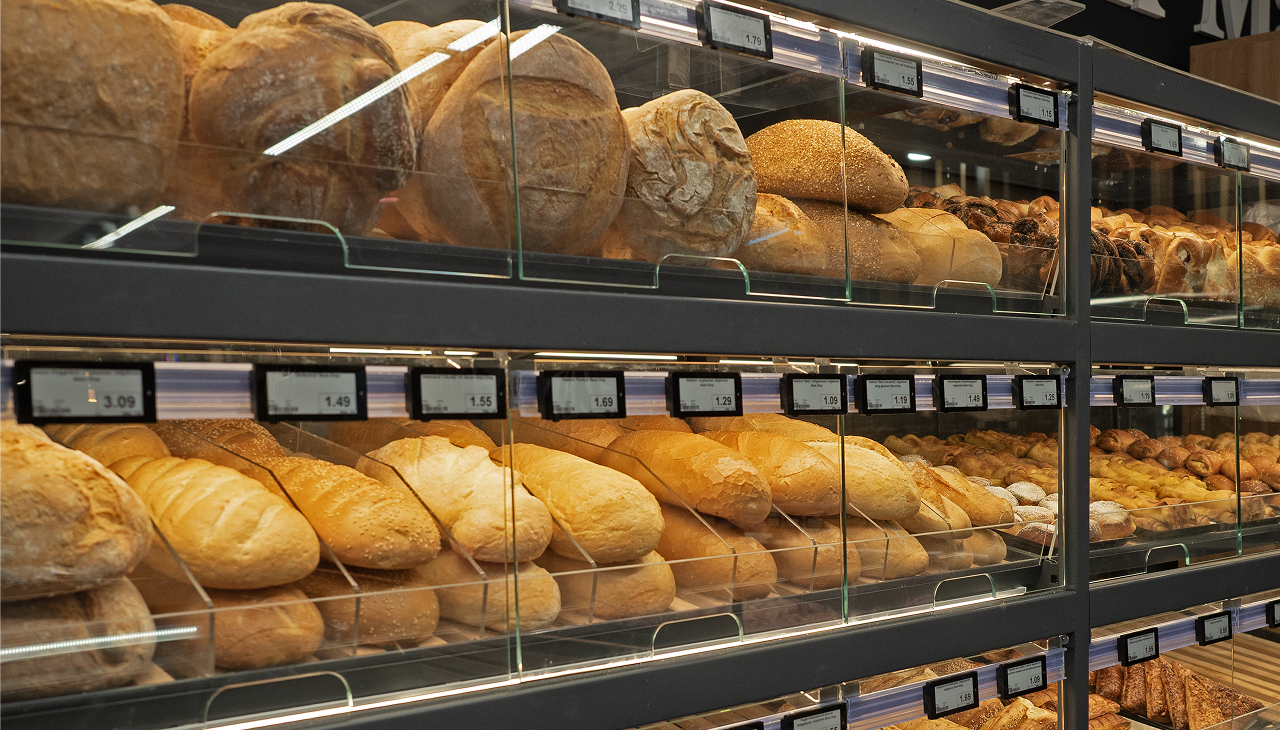
 ➤ This image is a generative AI-created visual.


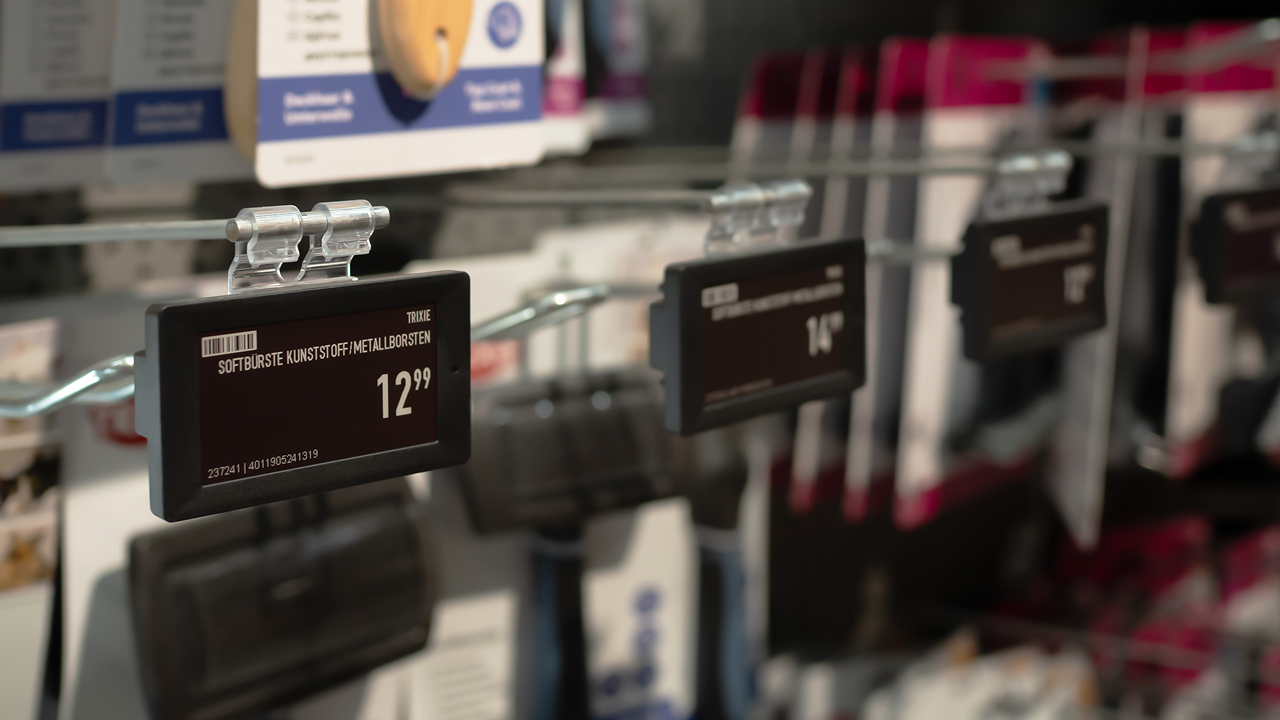
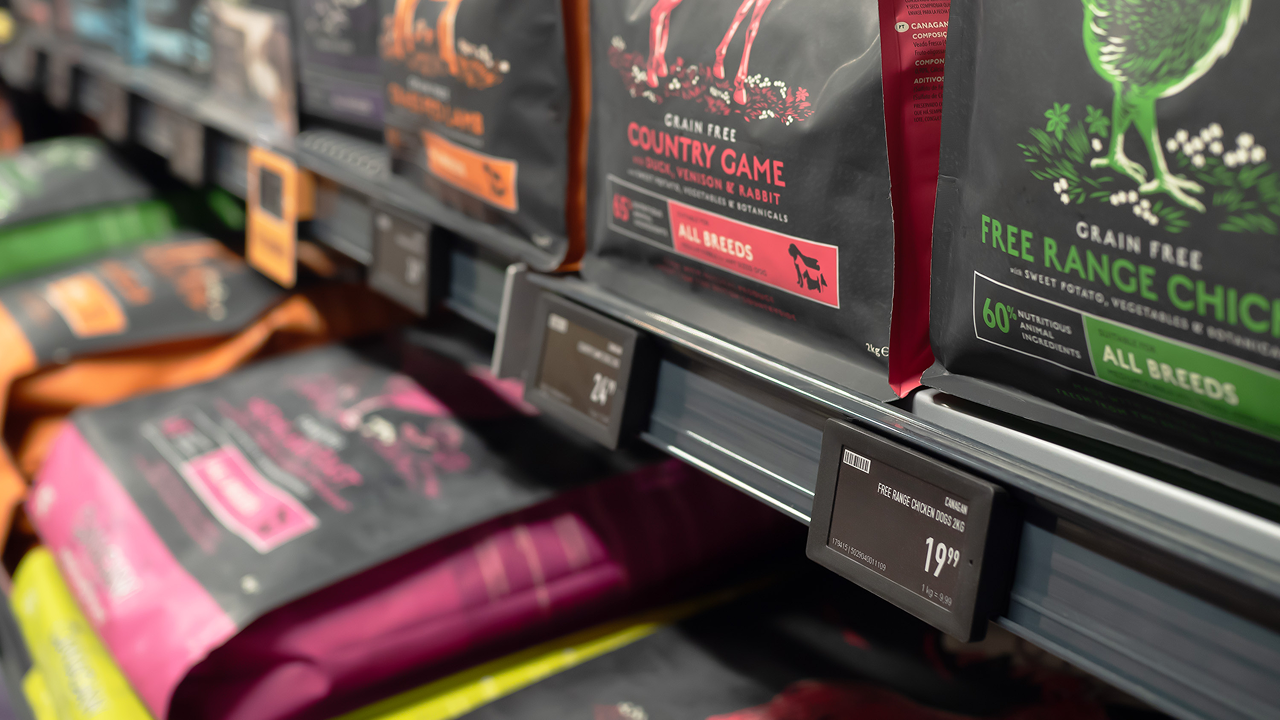
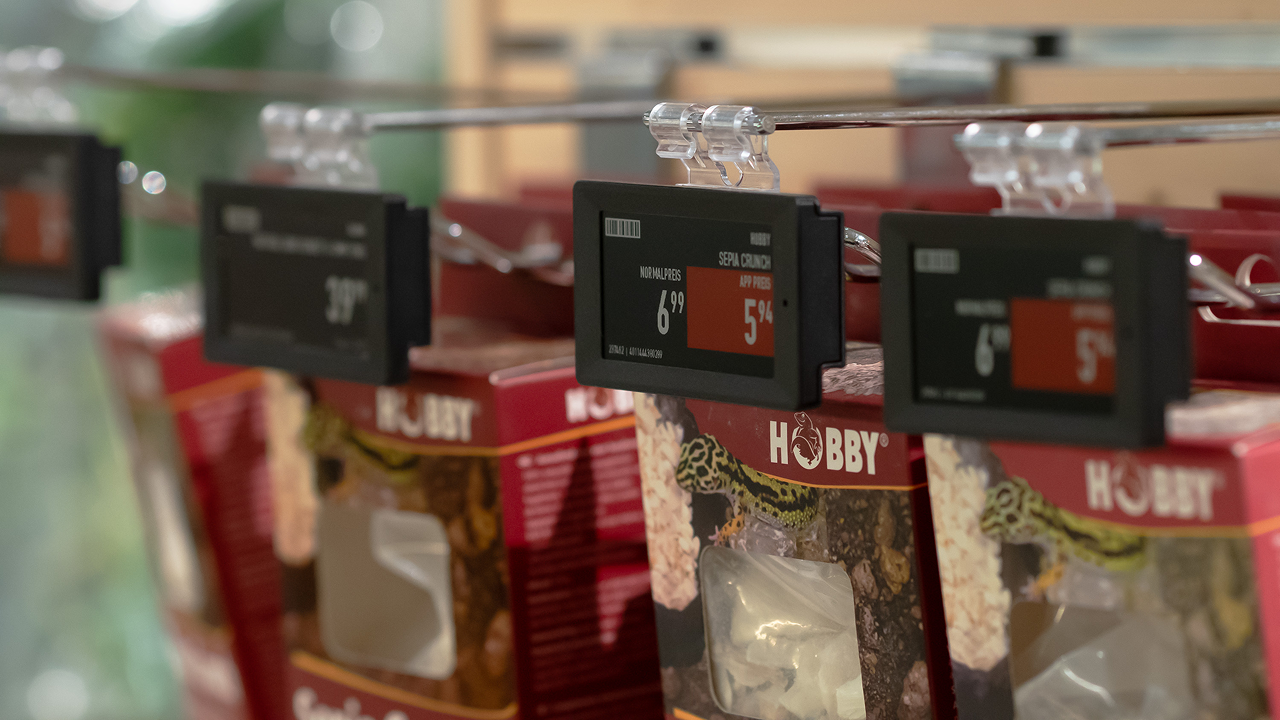
Prompts
Click prompts to add them under the company line, click again to take one out, then copy the result into your AI chat. Shared by Asian Century Stocks and Uncovered Thai Stocks. Thank you.
SOLUM (ticker 248070), listed in South Korea.
Copied
ETFs Holding SOLUM
Exchange-traded funds whose newest published daily portfolio holds one of the company's listings, largest weight first.
| ETF | Weight in ETF | Shares | Market value | As of |
|---|---|---|---|---|
| AVEE | 0.02% | 4,068 | $ 31.922K | Nov 16, 2026 |
| DFSE | 0.01% | 6,432 | $ 55.161K | Nov 12, 2026 |
| DEXC | 0.01% | 2,629 | $ 22.546K | Nov 12, 2026 |
| DFEV | 0.01% | 21,141 | $ 181.306K | Nov 12, 2026 |
| DFEM | 0.01% | 60,791 | $ 521.346K | Nov 12, 2026 |
| DFAE | 0.00% | 26,077 | $ 223.638K | Nov 12, 2026 |
| DFAX | 0.00% | 22,620 | $ 193.99K | Nov 12, 2026 |