Back to articles Share Can a solid-state architecture truly match the raw peak power of a traveling wave tube while eliminating the thermal throttling that often limits a pulsed RF power amplifier in high-duty-cycle radar? For decades, engineering…
Back to articles
Share


Can a solid-state architecture truly match the raw peak power of a traveling wave tube while eliminating the thermal throttling that often limits a pulsed RF power amplifier in high-duty-cycle radar? For decades, engineering teams in the defense and aerospace sectors accepted the excessive weight and frequent maintenance cycles of legacy vacuum tubes as an unavoidable trade-off. It's a persistent challenge to maintain system reliability when your hardware is prone to failure and requires complex, bulky cooling systems to stay operational.
This guide explores how GaN-on-SiC technology is fundamentally redefining modern transmitter design by delivering unmatched thermal conductivity and pulse fidelity. With GaN-on-SiC technology projected to hold a 70% share of the GaN RF market in 2026, the industry is rapidly pivoting toward these more resilient, solid-state architectures. You'll learn how to leverage GaN-on-SiC to achieve superior SWaP-C efficiency and improve Mean Time Between Failures (MTBF) in high-stakes environments. We provide a technical breakdown of precise pulse shaping for digital radar, showing you how to move beyond the limitations of legacy systems to secure a decisive performance advantage.
Key Takeaways
- Understand why high peak power and short duty cycles are critical for meeting 2026 requirements in long-range detection and high-resolution imaging.
- Analyze the thermal management advantages of GaN-on-SiC substrates in mitigating the extreme heat spikes associated with microsecond pulses.
- Compare the operational readiness and reliability of solid-state transmitters against legacy TWT systems, emphasizing instant-on capability and improved MTBF.
- Master the technical requirements for integrating a pulsed RF power amplifier into digital radar suites, focusing on precise pulse shape fidelity and waveform duplication.
Table of Contents
What is a Pulsed RF Power Amplifier and Why Does It Matter in 2026?
A pulsed RF power amplifier is a specialized electronic component engineered to amplify radio frequency signals in short, intense bursts rather than a continuous stream. Unlike continuous wave (CW) amplifiers that provide a steady output, pulsed systems concentrate energy into microsecond or millisecond intervals. This operational mode is foundational for modern detection systems. By delivering massive peak power during the "on" state and remaining silent during the "off" state, these amplifiers allow sensitive receivers to capture faint return signals without interference from the transmitter itself.
In 2026, the technology has reached a critical inflection point. The global industry is rapidly moving away from legacy magnetrons and Traveling Wave Tubes (TWTs) in favor of Solid-State Power Amplifiers (SSPAs). This shift is driven by the requirement for higher resolution and longer range in contested electromagnetic environments. An RF power amplifier
optimized for pulsed operation is now essential across multiple high-stakes sectors. Defense agencies utilize them for Electronic Warfare (EW) and jamming; aerospace firms integrate them into satellite communications; and scientific institutions rely on them to drive particle accelerators with extreme precision.
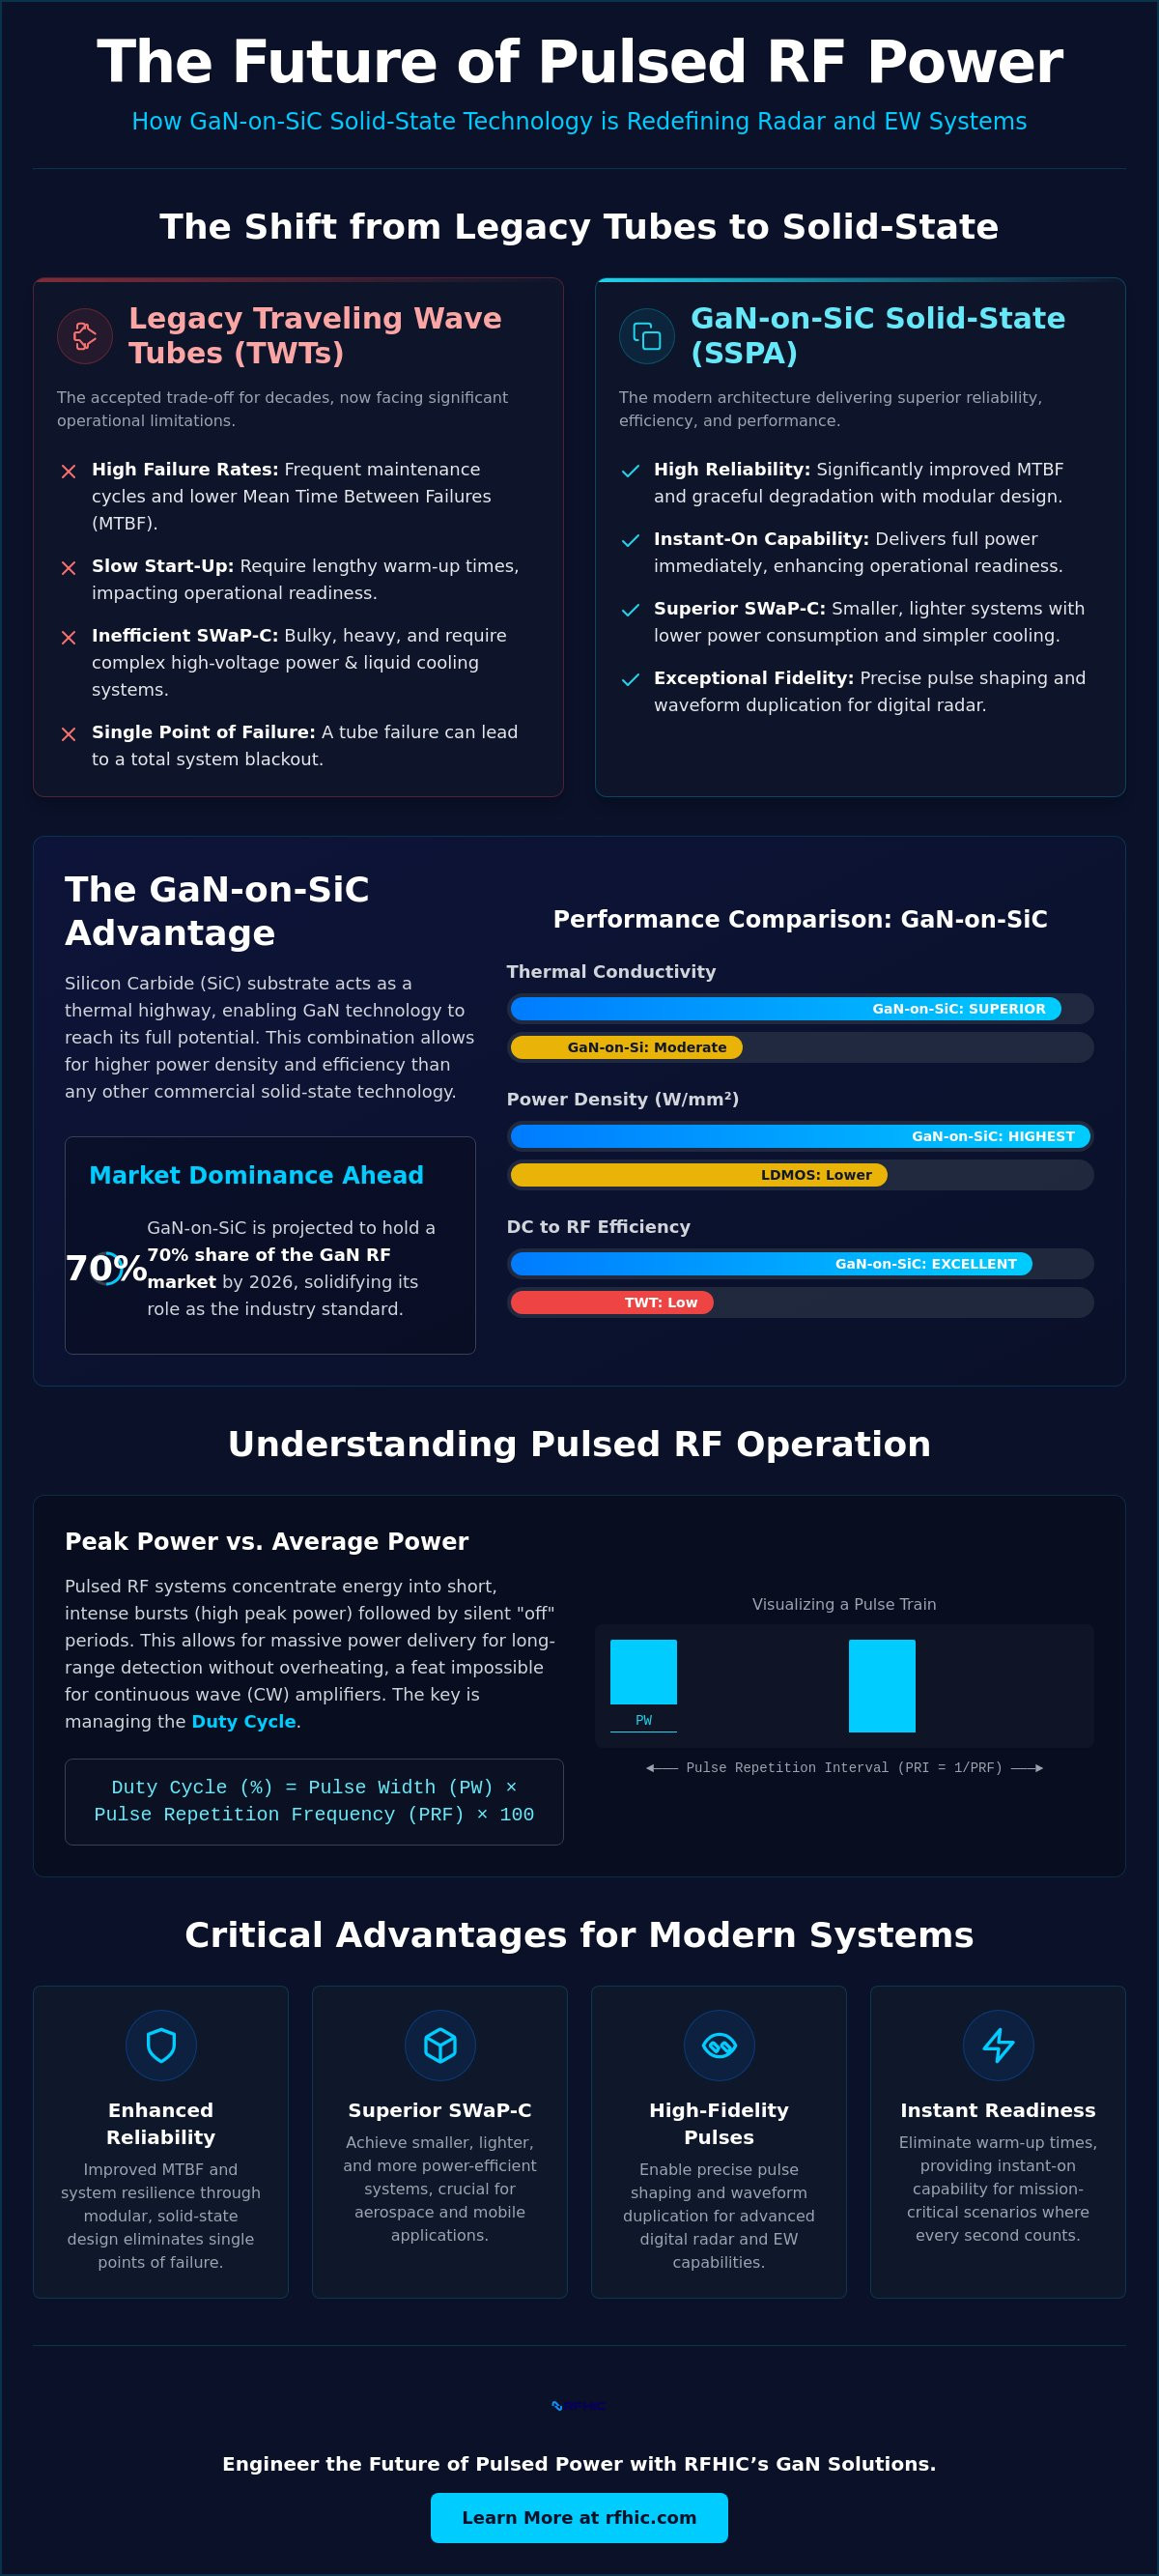
Peak Power vs. Average Power: The Pulsed Metric
The performance of a pulsed system isn't measured by its average output alone. Instead, engineers focus on peak power density. The relationship between the "on" time and the total cycle is defined as the Duty Cycle. It's calculated using the Pulse Width (PW) and the Pulse Repetition Frequency (PRF). A low duty cycle allows the system to reach much higher peak power levels than would be possible in CW mode without damaging the internal circuitry. In modern radar, mastering this balance is the primary KPI for achieving maximum target detection range while maintaining thermal stability. It's no longer just about raw energy; it's about how effectively that energy is partitioned.
The Rise of Solid-State Pulsed Technology
The evolution from Silicon LDMOS to Gallium Nitride (GaN) has fundamentally changed the preferred architecture for S-band and X-band radar. Solid-state technology offers a significant reliability advantage by eliminating the need for high-voltage power supplies and fragile vacuum seals found in legacy tubes. Because GaN-on-SiC devices provide superior power density and thermal conductivity, they've become the standard for high-performance systems. These amplifiers don't require lengthy warm-up times. They deliver instant-on capability and modularity, ensuring that a single component failure doesn't result in a total system blackout. This transition to solid-state is a total reimagining of system uptime and operational readiness.
The GaN-on-SiC Advantage: Mastering Pulsed Performance
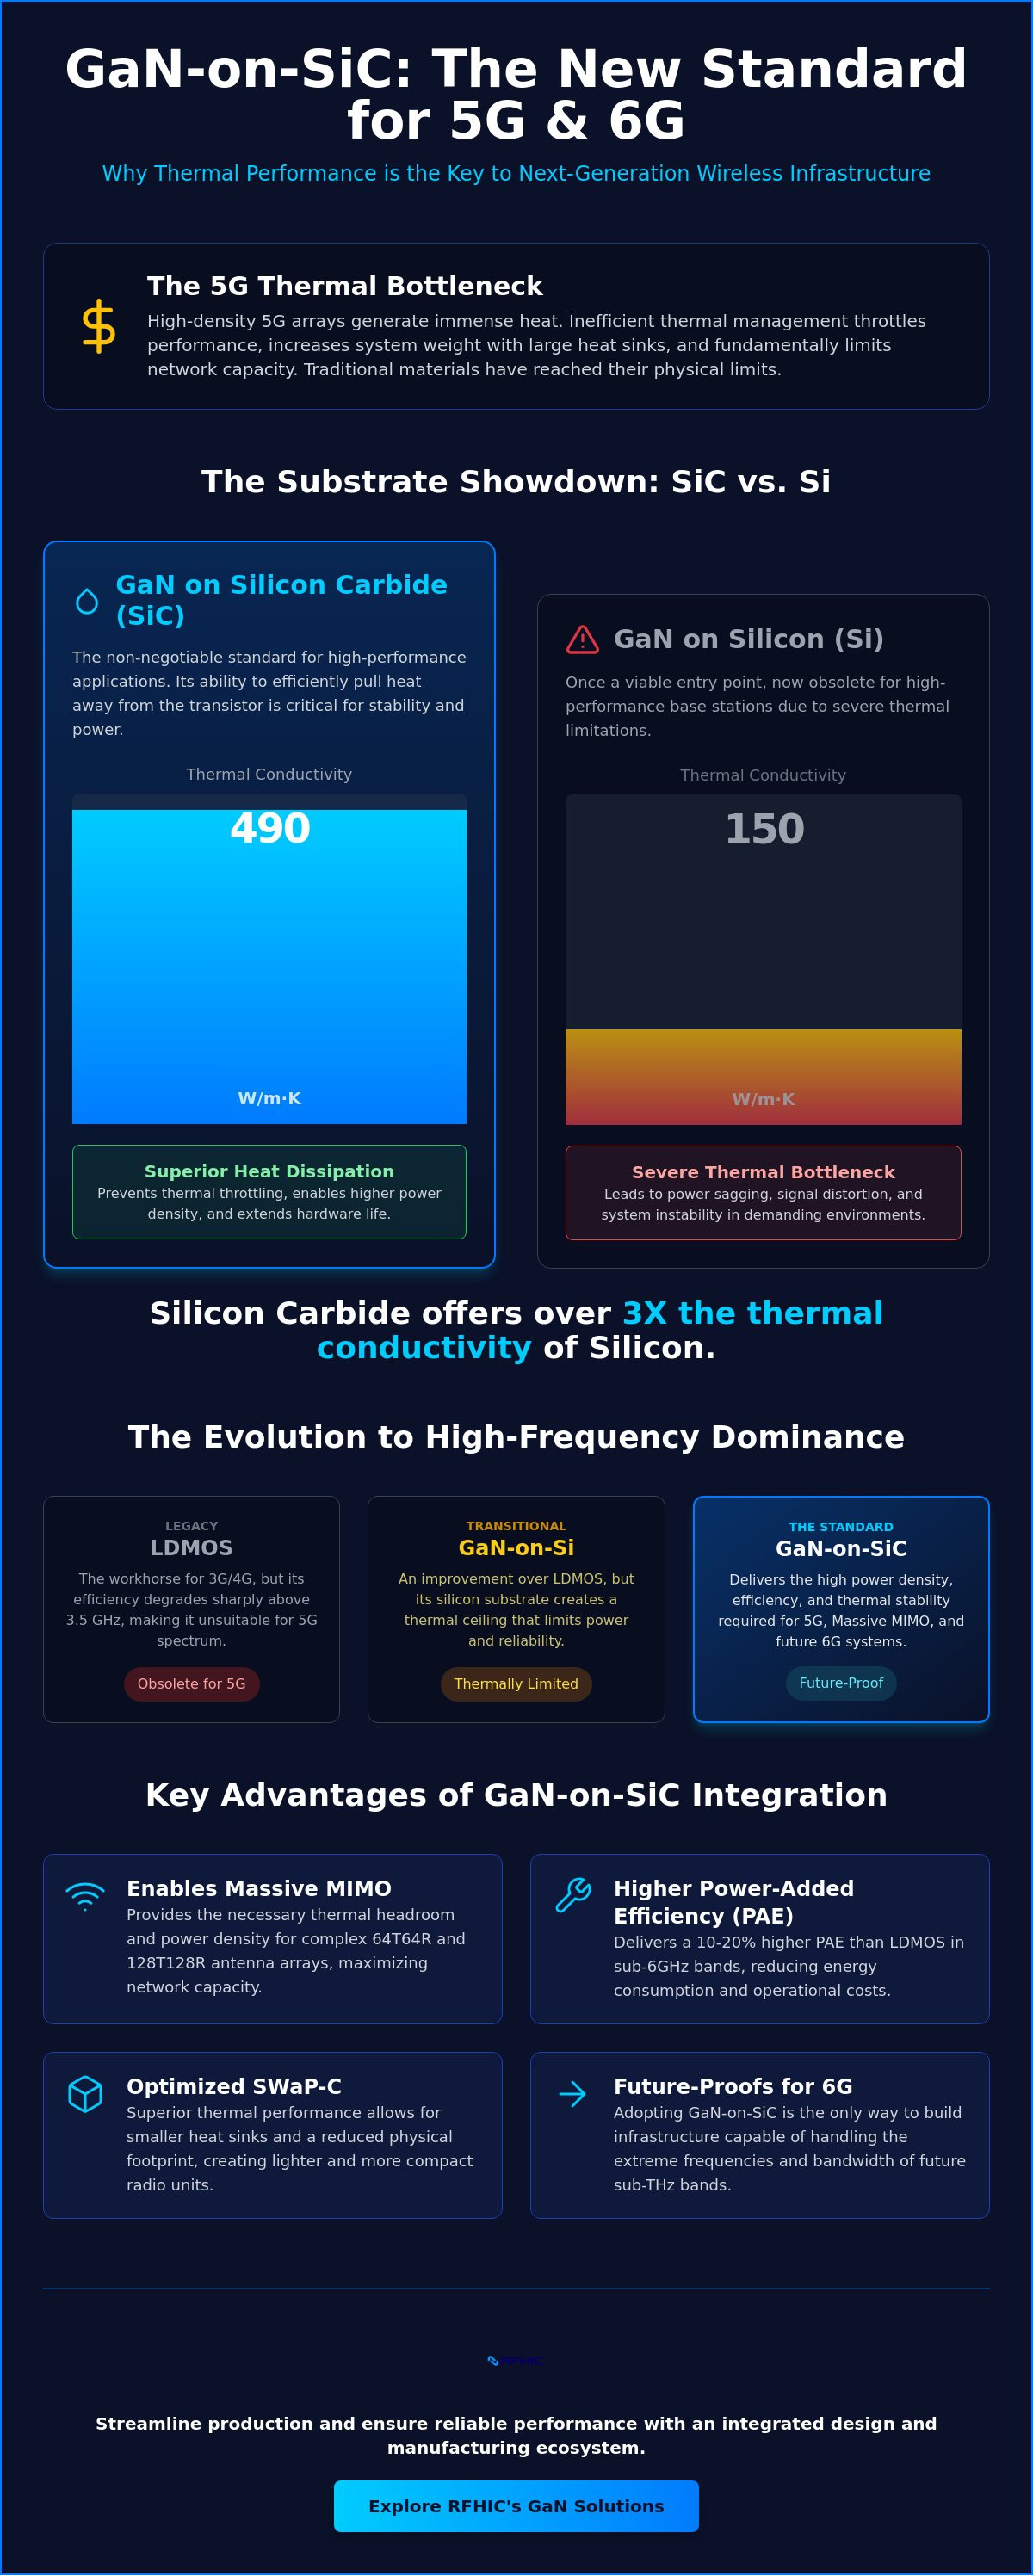
Material properties dictate the performance boundaries of any high-frequency system. While Gallium Nitride (GaN) provides the high breakdown voltage and electron mobility required for amplification, the substrate beneath it determines how well the device survives extreme stress. Silicon Carbide (SiC) has emerged as the superior substrate for a pulsed RF power amplifier because it acts as a thermal highway. Unlike GaN-on-Silicon or legacy LDMOS, GaN-on-SiC allows for significantly higher power density, often achieving more Watts per square millimeter than any other commercially available solid-state technology. This density isn't just a vanity metric; it enables engineers to shrink the overall system footprint while reducing the complexity of liquid or forced-air cooling infrastructures.
The efficiency gains realized through this architecture are substantial. By converting a higher percentage of DC power into RF energy, GaN-on-SiC minimize wasted heat. This is particularly vital when generating complex Pulsed RF waveforms
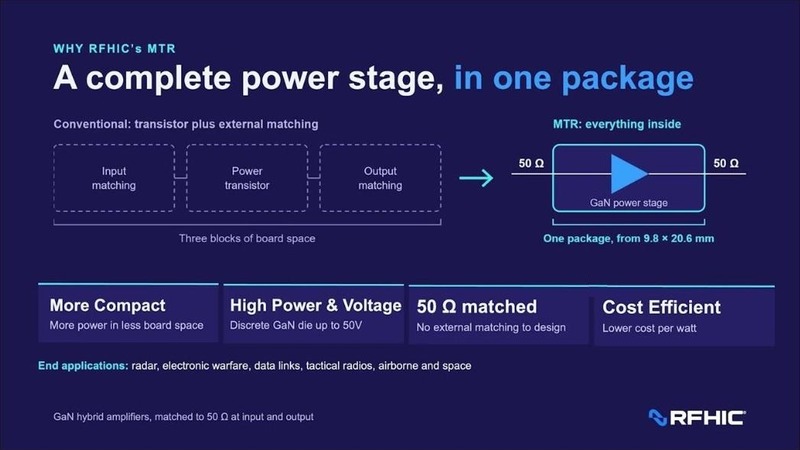
that require rapid switching and high peak output. For teams designing modern radar suites, these advancements mean smaller, lighter, and more mobile units that don't sacrifice range or sensitivity. To see how these material benefits translate into hardware, explore our range of GaN-on-SiC transistors
designed for high-power defense applications.
Thermal Management in High-Duty-Cycle Applications
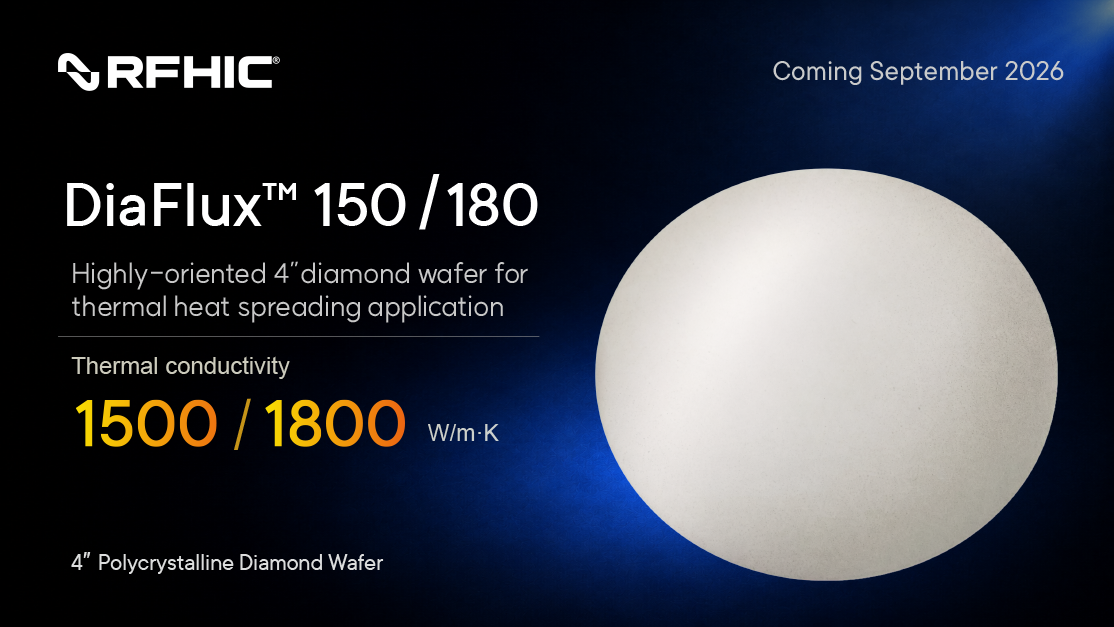
In high-duty-cycle radar, the primary enemy is the junction temperature spike. During a long pulse, heat builds up rapidly within the High Electron Mobility Transistor (HEMT) structure. If this heat isn't evacuated instantly, thermal resistance leads to performance degradation or catastrophic failure. Silicon Carbide offers a thermal conductivity nearly three times higher than traditional Silicon, enabling rapid heat dissipation away from the active device region. This superior thermal management ensures long-term HEMT reliability even when the system is pushed to its absolute operational limits.
Wideband Performance and Signal Purity
Modern electronic warfare requires amplifiers that maintain strict linearity across broad frequency ranges. GaN-on-SiC excels here by minimizing pulse droop, a phenomenon where the power level sags during the duration of a single pulse. For high-resolution Synthetic Aperture Radar (SAR), maintaining phase noise stability and signal purity is non-negotiable. Custom GaN designs allow for precise control over these variables, ensuring that the amplified waveform is a near-perfect duplicate of the input signal. This fidelity is what allows digital radar systems to distinguish between closely spaced targets in cluttered environments.
Solid-State (SSPA) vs. TWT: The Technical Decision Framework
Choosing between a Solid-State Power Amplifier (SSPA) and a Traveling Wave Tube (TWT) is no longer a simple question of raw wattage. For decades, TWTs were the only viable option for a pulsed RF power amplifier requiring high peak power at microwave frequencies. However, the maturation of GaN-on-SiC technology has shifted the decision framework toward solid-state architectures. This transition isn't just about replacing a component; it's about moving from a vacuum-based, high-maintenance system to a modular, semiconductor-driven platform that offers vastly superior longevity.
Reliability metrics highlight the most stark contrast. TWTs rely on thermionic emission, which involves heating a cathode to extreme temperatures within a vacuum. This process is inherently life-limited. In contrast, GaN-on-SiC SSPAs utilize semiconductor physics, offering a Mean Time Between Failures (MTBF) that often exceeds TWTs by an order of magnitude. While a vacuum tube might fail catastrophically due to a seal breach or cathode exhaustion, a solid-state system continues to perform reliably for years without the need for scheduled replacements.
Operational readiness is another critical differentiator in defense environments. TWT systems require significant warm-up times, often several minutes, to reach thermal equilibrium before they can transmit. In a mission-critical radar application, this delay is unacceptable. Solid-state amplifiers provide instant-on capability for any pulsed RF power amplifier configuration. They're ready to transmit the moment they receive power. When you factor in the energy efficiency of GaN, the Total Cost of Ownership (TCO) begins to favor SSPAs. Reduced energy consumption and the elimination of frequent downtime for tube swaps make solid-state the more economical choice over the system's full lifecycle.
Graceful Degradation: The SSPA Safety Net
The most significant engineering advantage of solid-state systems is their modularity. TWTs are binary; if the tube fails, the entire transmitter goes dark. SSPA architectures utilize multiple combined modules. If a single GaN-on-SiC MMIC
or power module fails, the system experiences "graceful degradation." The output power drops slightly, but the radar remains operational. This soft failure mode provides a critical safety net in mission-critical defense environments where total system failure isn't an option.
SWaP-C Optimization in 2026
Size, weight, and power (SWaP) are the primary constraints for mobile radar units. GaN-on-SiC technology enables a reduction in footprint by eliminating the bulky, high-voltage power supplies required by TWTs. Because these devices operate at higher efficiencies, they generate less waste heat per watt of RF output. This allows for the transition from complex, heavy liquid-cooled systems to streamlined, air-cooled designs. In 2026, this optimization is essential for deploying high-power radar on smaller, agile platforms without compromising on performance.
Optimising System Architecture for Pulsed RF Applications
Integrating a pulsed RF power amplifier into a modern digital radar or Electronic Warfare (EW) suite demands a shift from component-level selection to holistic system architecture. In these high-stakes environments, the amplifier must act as a transparent conduit for complex waveforms. Any distortion in the pulse shape directly degrades target resolution and range accuracy. Achieving high pulse fidelity requires meticulous attention to the matching networks and biasing circuits that support the GaN-on-SiC transistors. It's not just about the peak power; it's about the precision of the delivery.
Scalability is a core advantage of the modular solid-state approach. By combining multiple GaN-on-SiC modules, engineers can build kilowatt-level systems that were previously the exclusive domain of TWTs. For example, high-power GaN solid-state transmitter systems are now capable of delivering 5kW of output power in the X-band, as documented in 2026 defense-grade hardware specifications. This modularity allows for precise power scaling while maintaining the thermal management benefits inherent in Silicon Carbide substrates. It also ensures that the system can grow with the mission requirements without a total redesign of the power distribution network.
High-power pulsed environments present unique EMI/EMC challenges. The rapid switching of high currents can generate significant electromagnetic interference that threatens sensitive receiver electronics located nearby. Modern architectures mitigate this through advanced shielding and localized filtering integrated directly into the amplifier housing. Addressing these interference issues at the module level ensures the system remains compliant with rigorous defense standards. For mission-critical requirements, our High Power GaN Solid-State Transmitter Systems
provide the integrated solution needed for next-generation radar platforms.
Pulse Shaping and Digital Control
Fast rise and fall times are essential for precision timing in modern radar. High-speed switching within the pulsed RF power amplifier allows for the creation of sharp, well-defined pulses that minimize timing jitter. Software-defined control interfaces enable adaptive pulse widths. This allows the system to switch between long-range search modes and high-resolution tracking modes on the fly. This flexibility is critical for multi-mission platforms that must adapt to evolving threats in real-time.
Ruggedisation for Extreme Environments
Solid-state components offer inherent advantages in vibration and shock resistance compared to the fragile glass and vacuum seals of legacy tubes. Designing for MIL-STD compliance involves rigorous testing of the thermal cycling resilience of the GaN-on-SiC bond. Whether deployed in high-altitude aerospace applications or salt-heavy maritime environments, these systems maintain performance despite extreme temperature fluctuations. The robust nature of the semiconductor architecture ensures the hardware survives mechanical stresses without requiring the frequent recalibration typical of vacuum-based systems.
RFHIC’s GaN Solutions: Engineering the Future of Pulsed Power
RFHIC stands as a global leader by maintaining total control over the design and manufacturing lifecycle. This vertical integration, from the initial GaN HEMT epitaxial growth to the final integration of high-power GaN solid-state transmitter systems, ensures every pulsed RF power amplifier meets the stringent demands of modern defense. We don't just supply hardware. We engineer performance. By managing the entire supply chain, we provide a singular, dependable source of truth for clients who cannot afford the risks associated with fragmented vendor ecosystems.
Our custom OEM services allow for the precise tailoring of pulsed performance to unique mission specifications. Whether you require specific waveform fidelity for a proprietary radar project or a specialized wideband configuration for EW and jamming, our engineering team works as a proactive partner. With proven reliability in the most demanding sectors, including aerospace and particle physics, RFHIC provides the technical mastery needed to transition away from legacy vacuum tubes. We focus on the practicalities of production and supply chain efficiency to ensure your system is deployed on time and on budget.
Industry-Leading GaN-on-SiC Transistors and MMICs
Our proprietary GaN HEMT technology serves as the foundation for every high-performance system we build. By maximizing power density for X-band and S-band applications, these components enable the development of more compact, efficient hardware. Our GaN on SiC Transistors are engineered to handle the extreme thermal stresses of high-duty-cycle operation. This is achieved through meticulous material science, ensuring that the junction temperature remains well within safe limits even during microsecond pulses at peak output. This reliability is why our transistors are the preferred choice for wireless infrastructure and RF energy applications worldwide.
Complete Pulsed Transmitter Systems
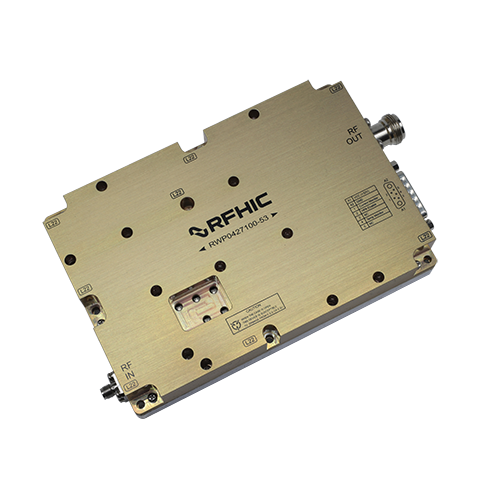
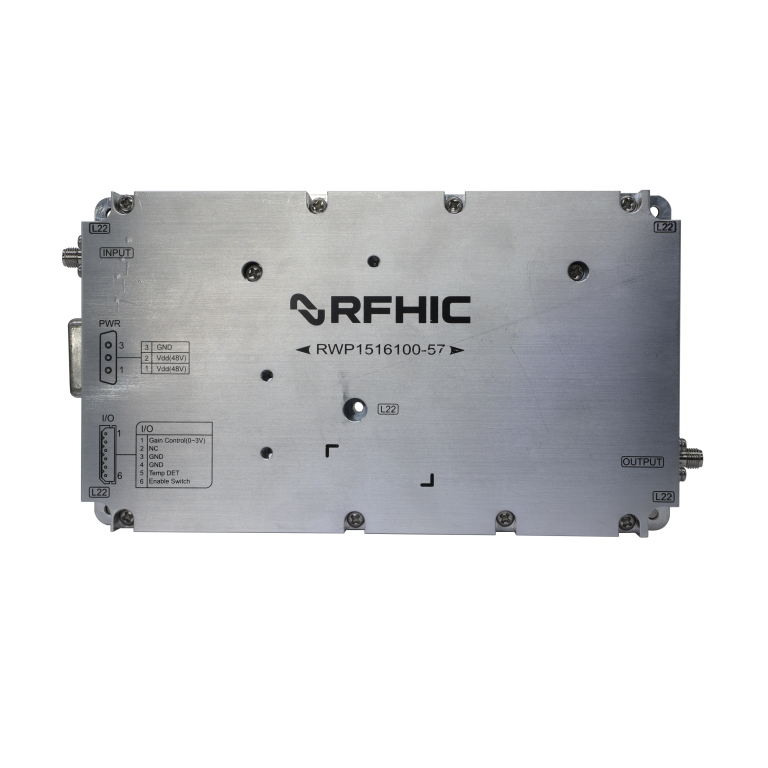
For organizations requiring turnkey solutions, we offer high-power GaN solid-state transmitter systems designed for both defense and commercial radar. These systems incorporate advanced liquid and air-cooled architectures to support maximum duty cycles without thermal throttling. Our 5kW X-band transmitters, featured in our 2026 defense catalog, represent the pinnacle of solid-state power. They deliver the raw energy of a TWT with the reliability and "instant-on" capability of modern semiconductor technology. Each system is built for longevity and ease of maintenance. To see how our hardware can optimize your next project, contact our engineering team
to discuss your pulsed RF requirements.
Advancing Mission Success with GaN-on-SiC Innovation
The transition toward GaN-on-SiC is not just a technical upgrade; it's a strategic necessity for maintaining a tactical advantage in the modern electromagnetic landscape. By prioritizing superior thermal conductivity and modular resilience, engineering teams can finally eliminate the inherent vulnerabilities of legacy vacuum tubes while achieving unprecedented peak power. This architectural shift ensures that your radar and electronic warfare systems remain operational in the most contested environments, providing the reliability that mission-critical applications demand.
RFHIC brings over 25 years of RF innovation to every pulsed RF power amplifier we design. As a KOSDAQ listed company (218410) with ISO 9001 and 14001 certified manufacturing facilities, we provide the industrial scale and quality assurance required for global defense and aerospace programs. We invite you to Explore RFHIC's GaN Solid-State Pulsed Amplifiers and discover how our vertical integration can streamline your next transmitter project. Our engineering expertise is at your disposal to help you master the complexities of modern radar performance and secure a decisive operational edge.
Frequently Asked Questions
What is the difference between a pulsed RF amplifier and a CW amplifier?
A pulsed RF amplifier delivers energy in discrete, high-power intervals rather than a continuous stream. This architecture allows for significantly higher peak power output while maintaining a lower average power level. Continuous wave (CW) amplifiers operate at a constant power level, which limits their peak output due to thermal constraints. In radar applications, pulsed signals are essential for preventing the transmitter from saturating the sensitive receiver during signal return.
Why is GaN-on-SiC preferred over GaN-on-Si for pulsed applications?
GaN-on-SiC is preferred because Silicon Carbide (SiC) offers approximately three times the thermal conductivity of Silicon (Si). In a pulsed RF power amplifier, microsecond bursts generate intense localized heat within the transistor junction. SiC acts as an efficient thermal highway, evacuating heat rapidly to prevent performance degradation. This material advantage enables higher power density and improved long-term reliability in high-duty-cycle defense applications compared to GaN-on-Si.
Can solid-state amplifiers replace high-power TWTs in radar systems?
Solid-state power amplifiers (SSPAs) are increasingly replacing high-power TWTs by utilizing modular combining techniques. While a single TWT can produce kilowatts of power, modern GaN-on-SiC architectures combine multiple SSPA modules to achieve comparable kilowatt-level outputs. This shift offers superior reliability through graceful degradation. If one module fails, the system remains operational at a slightly reduced power level, whereas a TWT failure results in a total system blackout.
What are the typical pulse widths for X-band pulsed RF power amplifiers?
Typical pulse widths for X-band radar systems generally range from 1 microsecond to 100 microseconds, depending on the specific mission requirements. Shorter pulses provide higher range resolution for target identification; longer pulses are often utilized to increase the total energy on target for long-range detection. The amplifier must maintain strict pulse fidelity across these varying widths to ensure the digital radar processor can accurately interpret the return signals.
How does duty cycle affect the design of a pulsed RF power amplifier?
The duty cycle determines the total thermal load and the power supply requirements of the amplifier. A higher duty cycle increases the average power, necessitating more robust cooling systems to manage the heat generated during the "on" state. Engineers must balance the peak power requirements with the duty cycle to ensure the junction temperature stays within safe operating limits. This calculation directly influences the selection of the substrate material and the complexity of the thermal housing.
What is 'pulse droop' and how is it managed in GaN amplifiers?
Pulse droop refers to the gradual decrease in output power that occurs during the duration of a single pulse. This is typically caused by a drop in the drain voltage or an increase in the junction temperature. In GaN amplifiers, this is managed through optimized energy storage in the decoupling capacitors and precise biasing control. Maintaining a flat pulse is critical for high-resolution imaging where phase and amplitude stability are required throughout the entire pulse duration.
Are solid-state pulsed amplifiers more efficient than vacuum tubes?
Solid-state pulsed amplifiers offer higher system-level efficiency by eliminating the significant overhead associated with vacuum tubes. TWTs require high-voltage power supplies and lengthy warm-up cycles that consume energy even when the system isn't transmitting. GaN-on-SiC technology provides high power-added efficiency (PAE) and instant-on capability. This reduces the overall power draw and simplifies the cooling requirements, making solid-state the more efficient choice for modern mobile radar platforms.
How do I choose the right pulsed RF amplifier for an EW jamming application?
Selecting the right pulsed RF power amplifier for EW jamming requires a focus on wideband performance and signal linearity. The amplifier must maintain high peak power across a broad frequency spectrum to counter diverse threats effectively. You should evaluate the 1dB compression point and the harmonic distortion levels to ensure the jamming signal remains effective without interfering with friendly communications. Choosing a vertically integrated partner ensures the amplifier is optimized for the specific waveforms used in modern electronic warfare.

News
2023-06-14

Product/Technology
2024-06-18

News
2024-06-27

Events
2025-02-26

News
2023-01-10

News
2026-06-24

Events
2023-07-20

News
2026-06-23

Product/Technology
2024-06-03
News
2023-06-14
Product/Technology
2024-06-18
News
2024-06-27
Events
2025-02-26
News
2023-01-10
News
2026-06-24
Events
2023-07-20
News
2026-06-23
Product/Technology
2024-06-03
News
2023-06-14
Product/Technology
2024-06-18
News
2024-06-27
Events
2025-02-26
News
2023-01-10
News
2026-06-24
Events
2023-07-20
News
2026-06-23
Product/Technology
2024-06-03
Stay up to date with the latest product and company news
Email
This field is for validation purposes and should be left unchanged.
RFHIC Corporation HQ
RFHIC Bldg., 110 Gwacheon-daero 12-gil, Gwacheon-si, Gyeonggi-do, 13824,
South Korea
Tel: +82-31-8069-3000
RFHIC Corporation Manufacturing Facility
41-14, Burim-ro 170 Beon-gil Dongan-gu, Anyang-si, Gyeonggi-do, 14055,
South Korea
Tel: +82-31-8069-3000
RFHIC US Corporation
920 Morrisville Parkway, Morrisville, NC 27560
USA
Tel: +1 (919)-677-8780
Fax: +1 (919)-342-5406
Copyright 2022 RFHIC Corporation