분기보고서 (2026.09)
Bull 0
Bear 0
Routine
214370
|
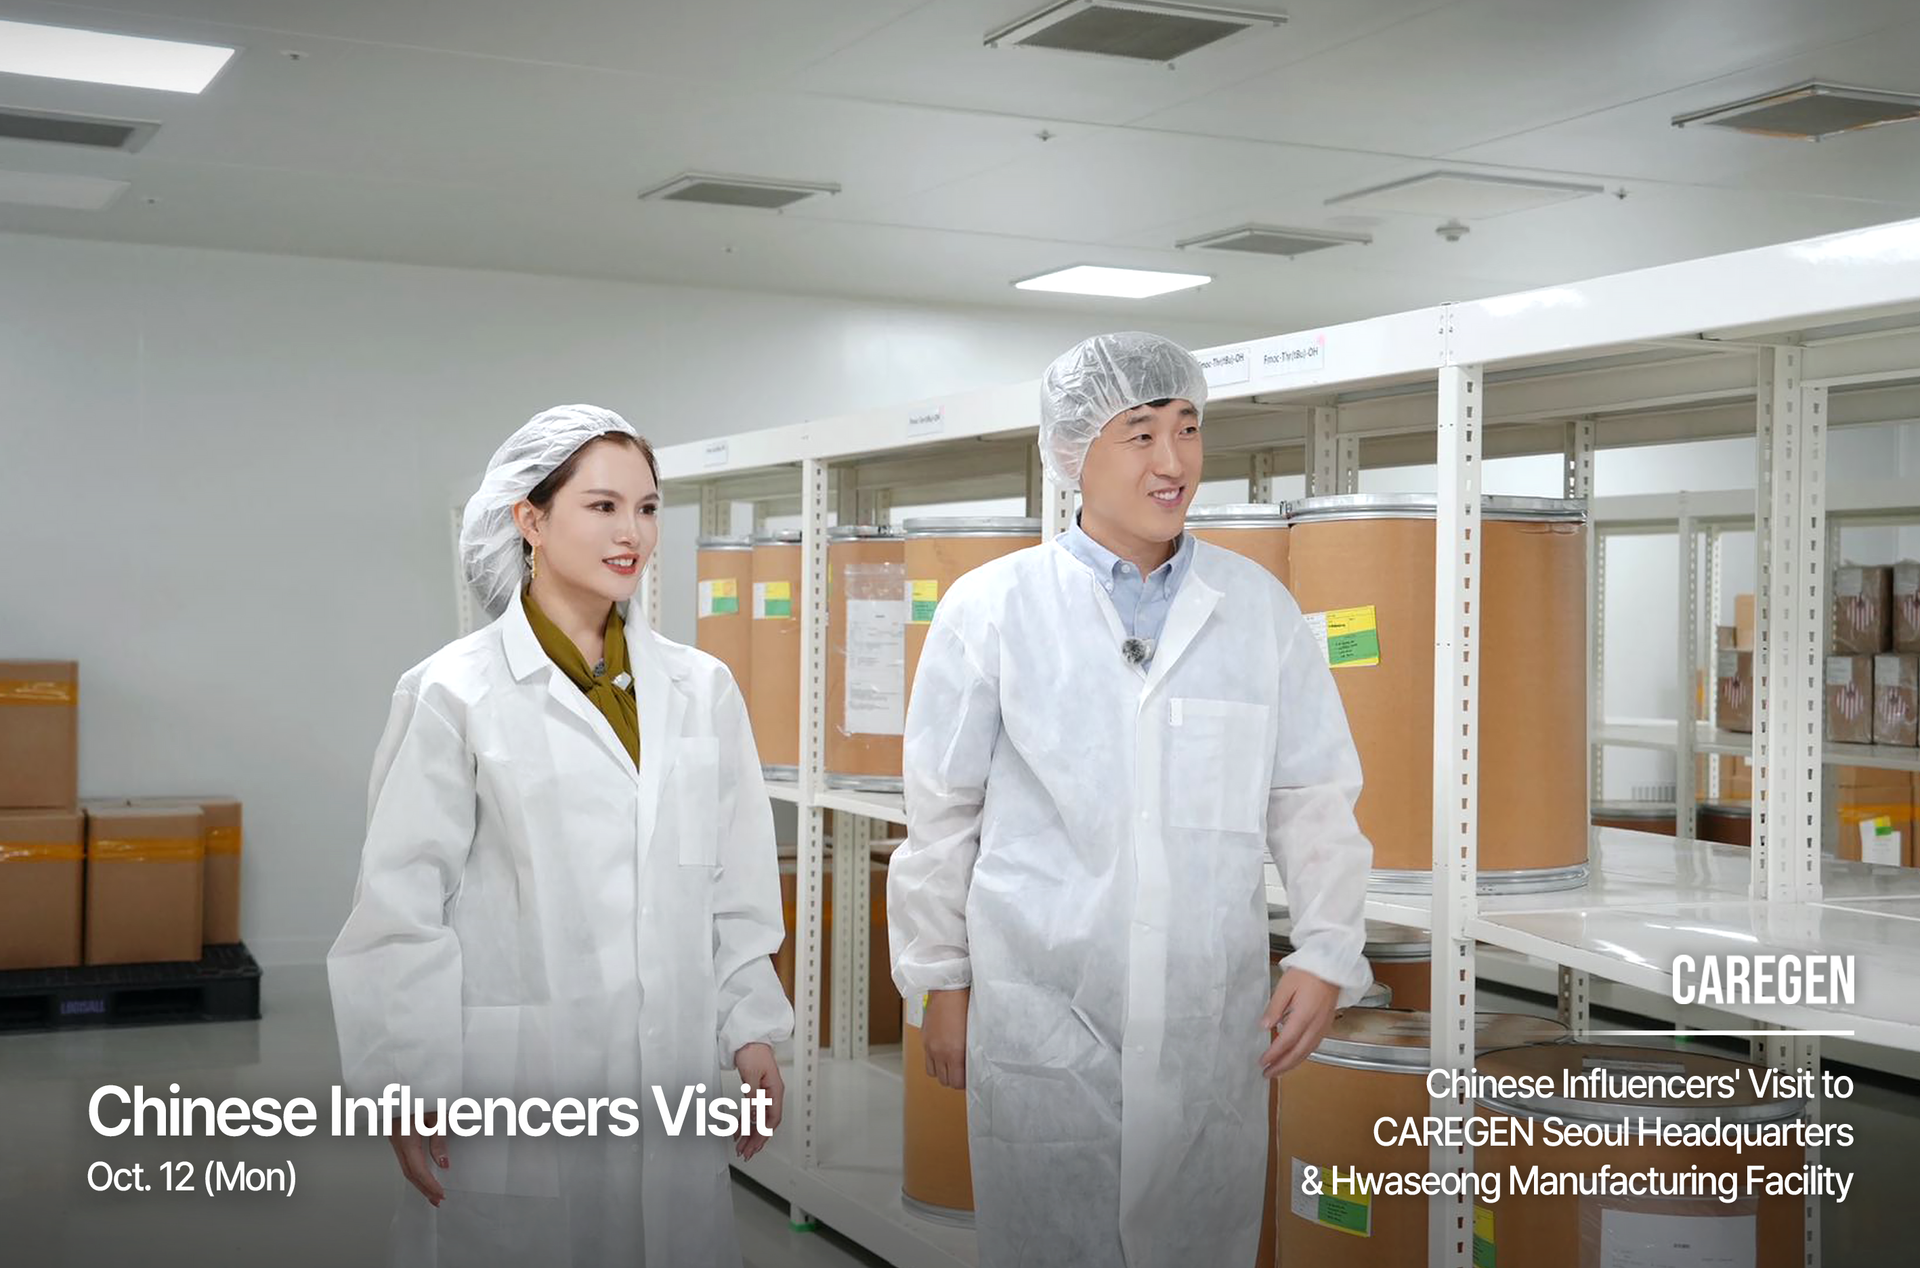
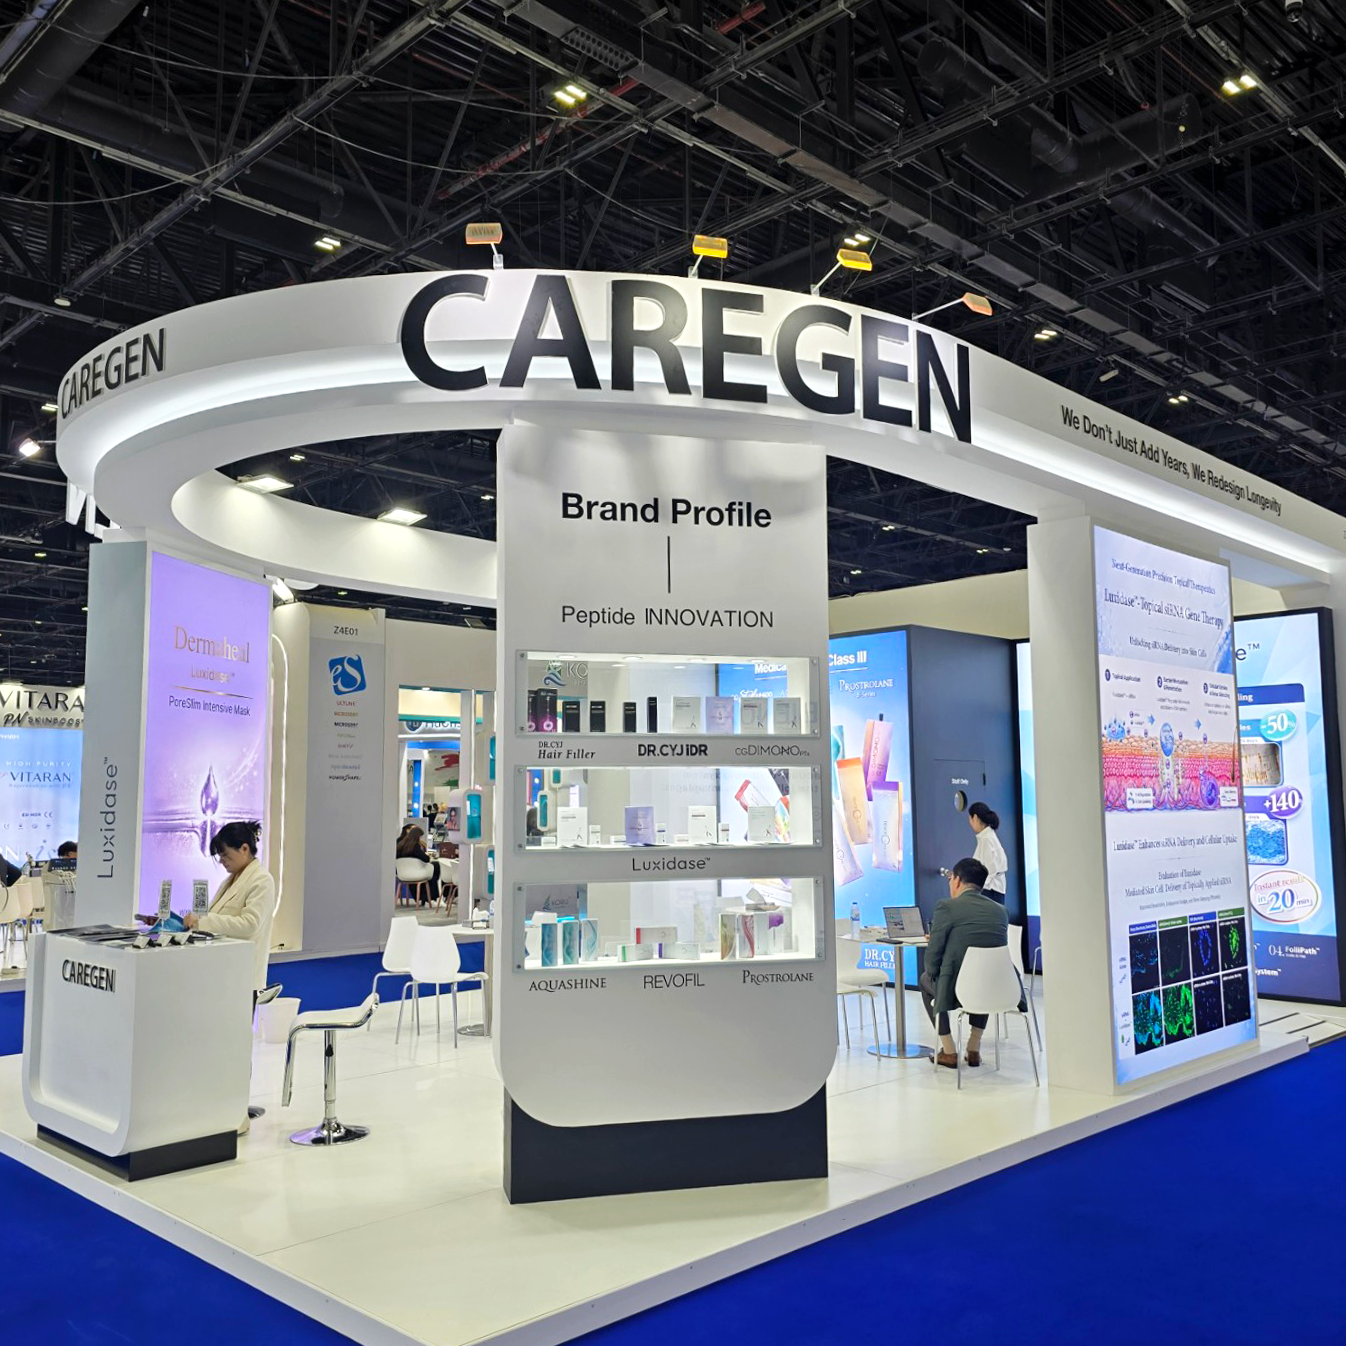
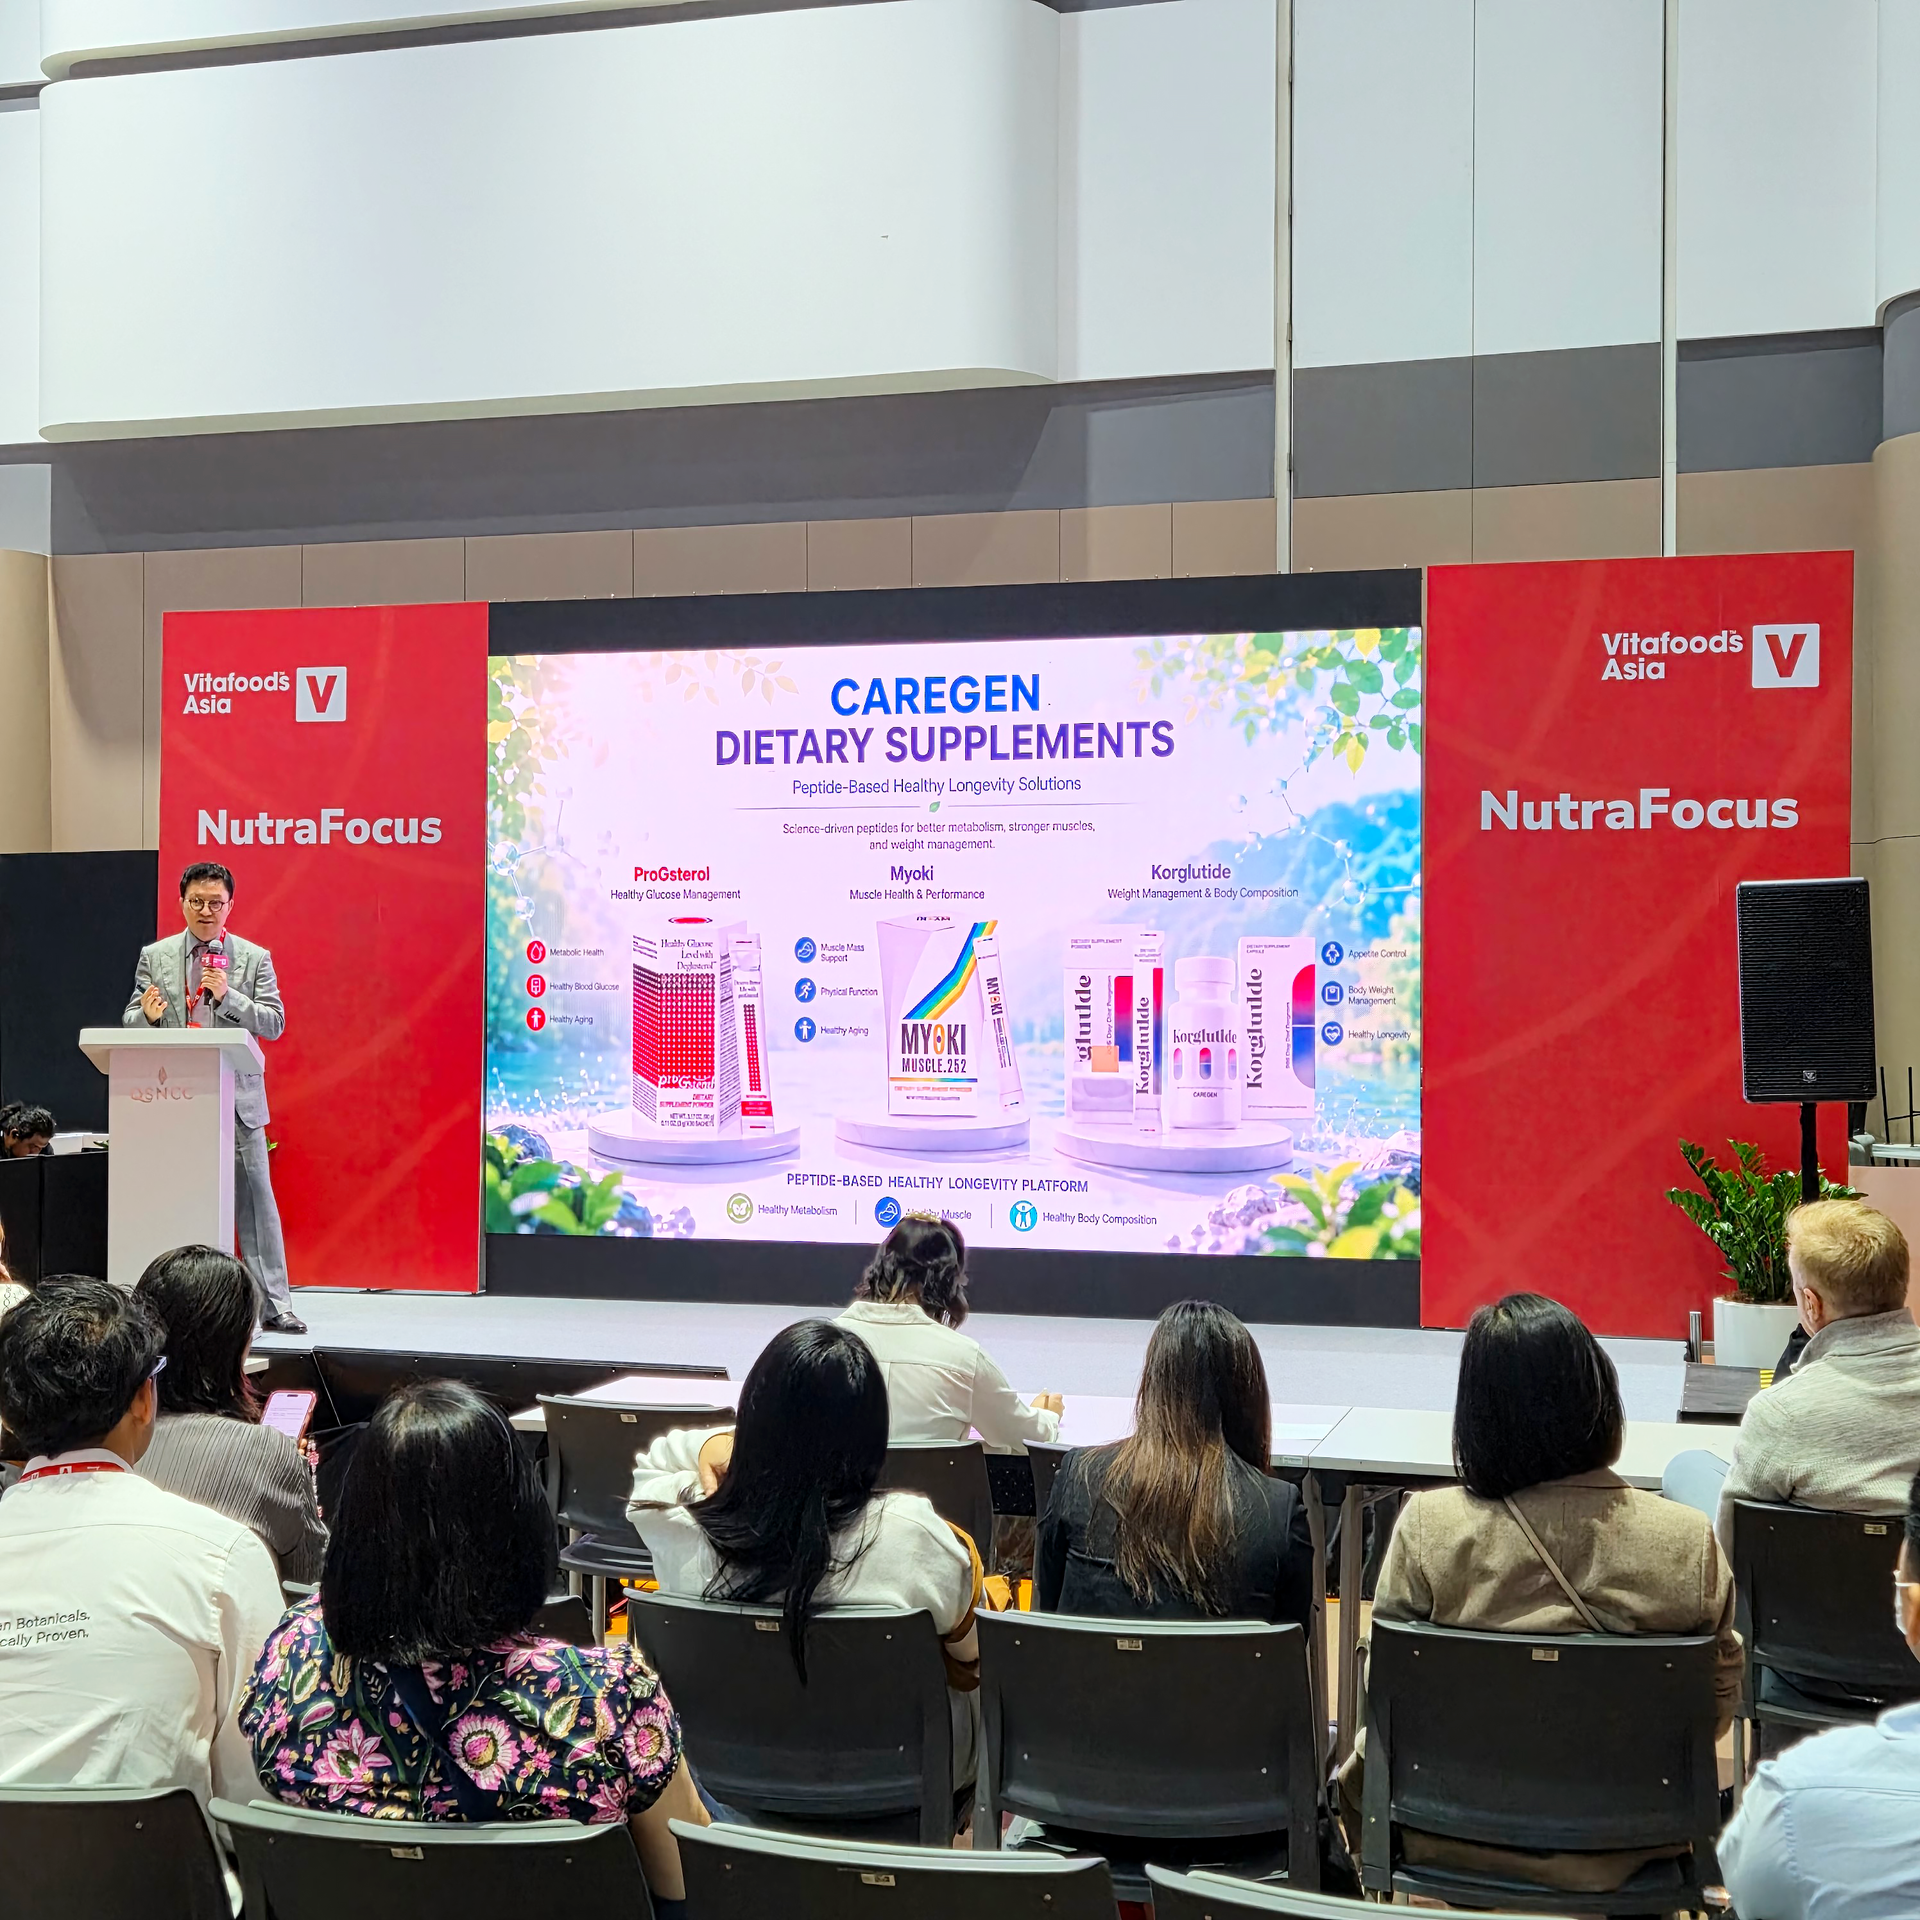
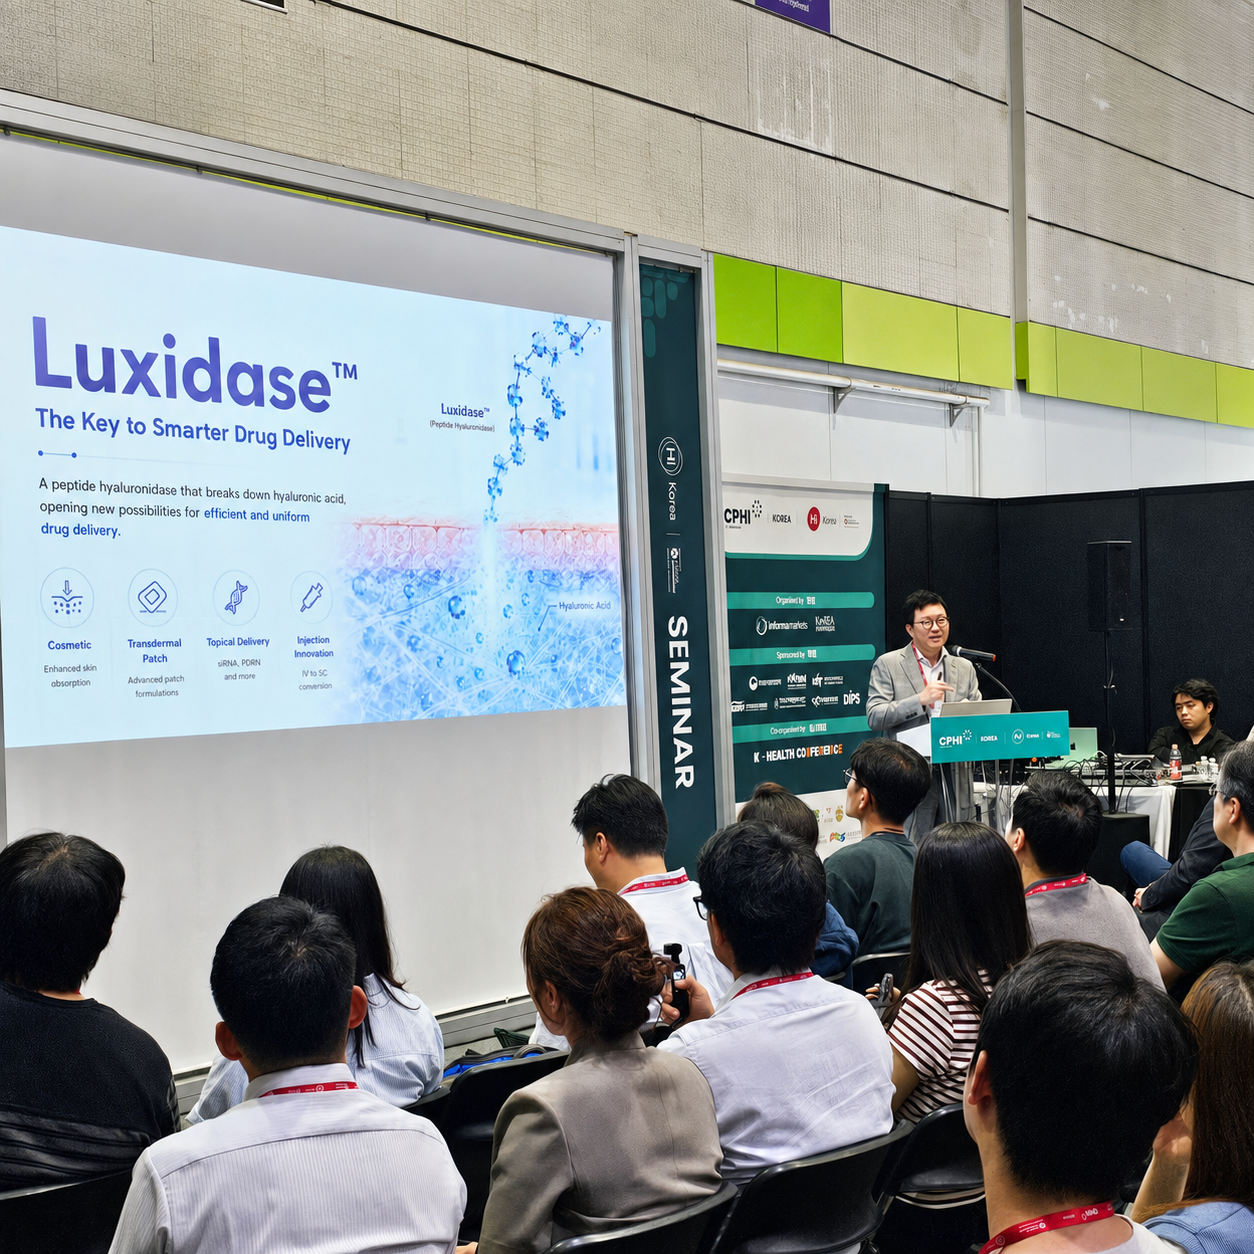
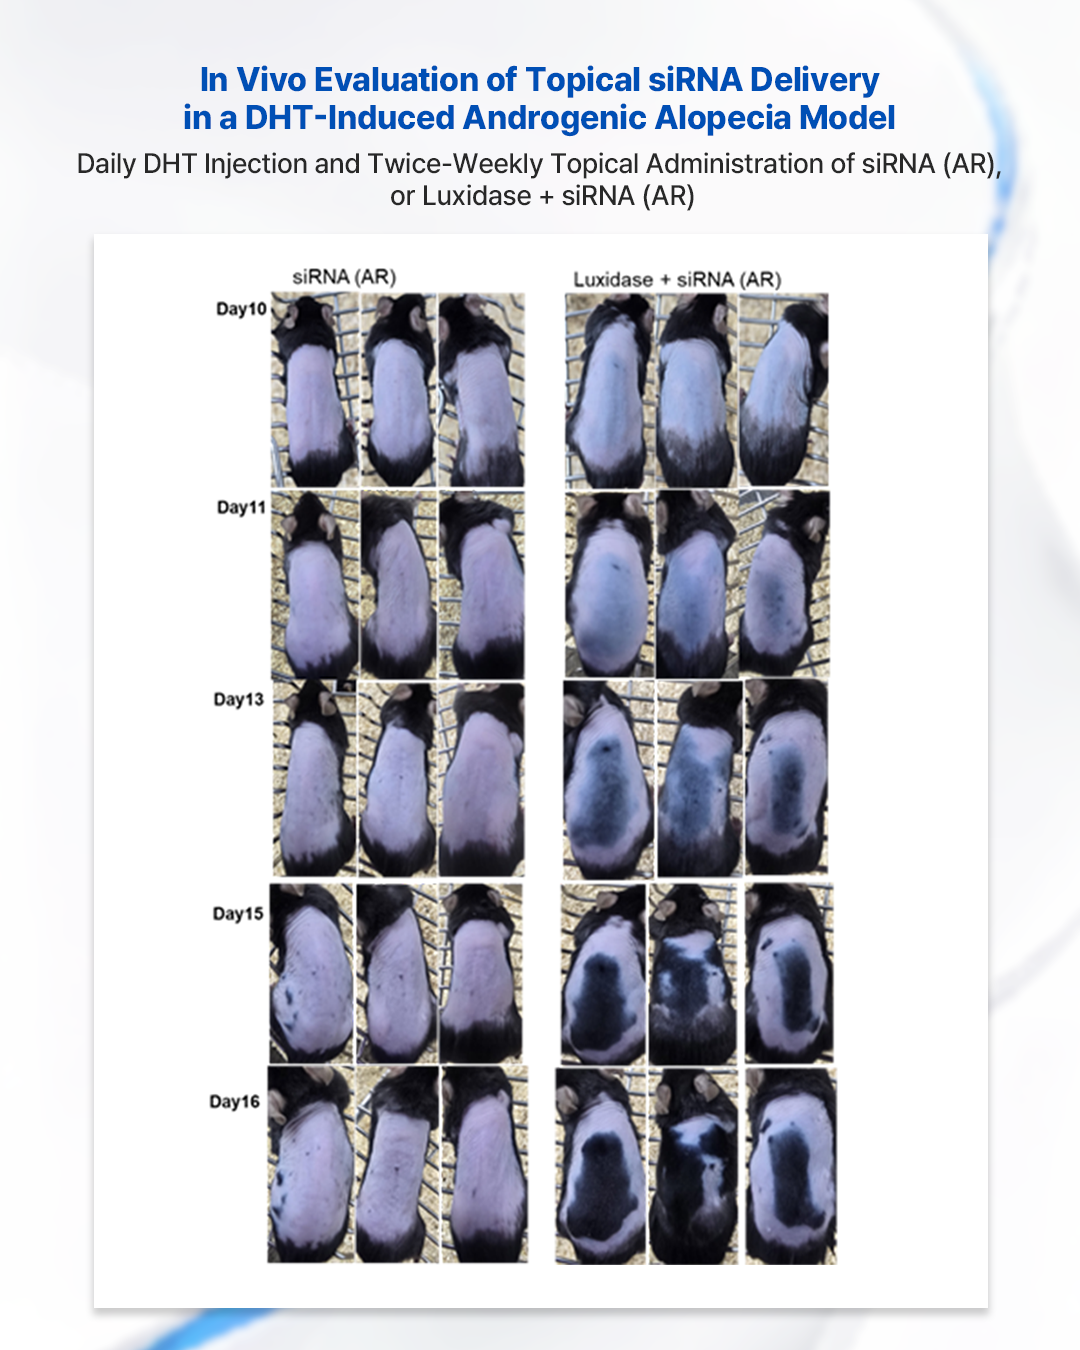
CAREGEN is a biotechnology company that researches, develops, and manufactures biomimetic peptides and growth factor proteins. The company applies these bioactive ingredients across four main business segments: health functional foods, medical devices, cosmeceuticals, and pharmaceuticals. In the health food sector, CAREGEN produces peptide-based supplements for blood sugar regulation, muscle health, and weight management, including products like ProGsterol, MyoKi, and Korglutide. Its medical device portfolio consists of Class III medical devices for medical aesthetics, such as dermal fillers, hair fillers, and mesotherapy products under brands like REVOFIL, Dermaheal, and DR.CYJ. The cosmeceutical division offers functional skincare and haircare products targeting skin aging, pigmentation, and hair loss. CAREGEN is also developing peptide-based pharmaceutical candidates for ophthalmic diseases, including CG-P5 for wet age-related macular degeneration and CG-T1 for dry eye disease. The company supplies functional peptide raw materials to global partners, including an exclusive supply agreement with BASF. CAREGEN sells its products globally through exclusive and non-exclusive distributors, with a significant portion of revenue derived from exports. The company was founded in 2001 and maintains a large peptide library with numerous registered patents. Summarised from the company's own disclosures, fiscal year ended Mar 2026 |
Industry Biotechnology | Homepage caregen.co.kr |
| Sector Healthcare | IR page caregen.co.kr | |
|
Tags
biomimetic peptides, growth factors, health functional foods, medical aesthetics, dermal fillers, mesotherapy, cosmeceuticals, ophthalmic therapeutics, peptide raw materials, metabolic health, hair care, skin care, ProGsterol, MyoKi, Korglutide, Deglusterol, CG-P5, CG-T1, CG-EGF, CG-Purilux, REVOFIL, Dermaheal, DR.CYJ, Prostrolane, Intracisc, Linevisc, Aquashine, Pelo Baum, Luxidase, BASF
|
Press page — |
Metrics
| Valuation | |
|---|---|
| Market cap | ₩ 2.149T |
| Market cap (USD) | $ 923.102M |
| P/E | 49.89 |
| PEG | — |
| P/BV | 9.83 |
| P/S | 28.69 |
| P/OCF | 82.18 |
| P/FCF | 96.77 |
| Dividend yield | — |
| Turnover / mcap | — |
| Returns | |
|---|---|
| ROE | 9.2% |
| ROI | 9.5% |
| ROIC | 8.6% |
| Profit margin | 27.6% |
| Growth | |
|---|---|
| Revenue growing | No |
| Profits growing | No |
| Revenue up 3y | No |
| Revenue up 5y | No |
| Earnings growth 3y (net profit CAGR) | -9.7% |
| Quality | |
|---|---|
| Profitable | Yes |
| Margin expanding | No |
| Buying back stock | No |
| Diluting (TTM) | No |
| Debt/Equity | — |
| Podcast bulls (TTM) | Sign up |
| Podcast bears (TTM) | Sign up |
| Podcast sentiment (TTM) | Sign up |
| Podcast sentiment % (TTM) | Sign up |
| News sentiment (TTM) | — |
| Quality score | -17.6% |
| Insiders | |
|---|---|
| Buys, 1w | Sign up |
| Buys, 1m | Sign up |
| Buys, 1y | Sign up |
| Sells, 1w | Sign up |
| Sells, 1m | Sign up |
| Sells, 1y | Sign up |
Sign up to see this company's insider trades
| Figure | FY 2025 | FY 2024 | FY 2023 | FY 2022 | FY 2021 | FY 2020 | FY 2019 | FY 2018 | FY 2017 | FY 2016 | FY 2015 | FY 2013 |
|---|---|---|---|---|---|---|---|---|---|---|---|---|
| Revenue | 72.808B | 82.586B | 79.21B | 69.098B | 59.088B | 60.295B | 64.699B | 51.211B | 46.531B | 30.905B | 30.234B | — |
| Net profit | 20.099B | 32.314B | 39.93B | 27.267B | 25.318B | 31.478B | 28.07B | 16.491B | 18.426B | 11.569B | 12.811B | — |
| Free cash flow | 14.729B | -52.38B | 20.447B | -29.225B | 47.97B | 9.696B | 63.5B | -9.097B | 42.307B | -19.955B | — | — |
Filed figures
Lines the statements and their notes report beside the headline figures, read from the filings' XBRL as filed (no restatement applied), with figures computed from one filing's own lines. Cash-flow lines carry their cash direction: an outflow is negative. Each period links to its filing; a figure's period, report date and tag are in its tooltip.
| Figure | Dec 2016 | Dec 2017 | Dec 2018 | Dec 2019 | Dec 2020 | Dec 2021 | Dec 2022 | Dec 2023 | Dec 2024 | Dec 2025 |
|---|---|---|---|---|---|---|---|---|---|---|
| Balance sheet detail | ||||||||||
| Trade receivables (KRW) | 2.42B | 3.47B | 2.14B | 2.55B | 4.88B | 5.54B | 6.95B | 13.1B | 33B | 30B |
| ↳ YoY growth | -43.0% | +43.4% | -38.3% | +19.2% | +91.1% | +13.5% | +25.5% | +89.1% | +150.8% | -9.0% |
| ↳ 5y CAGR | -10.9% | -7.0% | +2.8% | +18.0% | +14.9% | +43.8% | +66.8% | +43.8% | ||
| Cash and deposits (KRW) | 70.5B | 50B | 17.5B | 21.7B | 16B | 22.2B | 5.18B | 31.5B | 5.07B | 8.86B |
| Intangible assets (KRW) | 1.24B | 1.34B | 1.42B | 1.76B | 2.22B | 3.06B | 3.92B | 4.69B | 4.95B | 5.06B |
| Cash flow detail | ||||||||||
| Operating cash flow (KRW) | -16B | 47.9B | -6.82B | 69.7B | 30.8B | 51.9B | -27.7B | 28.6B | 13.5B | 18.6B |
| Purchases of property, plant and equipment (KRW) | -4B | -5.57B | -2.28B | -6.16B | -21.1B | -3.89B | -1.54B | -8.16B | -65.9B | -3.86B |
| Purchases of intangible assets (KRW) | -302M | -337M | -515M | -1.34B | -740M | -1.38B | -1.48B | -1.54B | -1.1B | -1.06B |
| Dividends paid (cash effect) (KRW) | -6.43B | -16.4B | -12.3B | 0.00 | -34.7B | -20.6B | -24.5B | -28.5B | -31.4B | -31.1B |
| Share buybacks (cash effect) (KRW) | -33.5B | -6.13B | -6.19B | -14.3B | -8.58B | — | — | — | -5.03B | — |
| Interest paid (cash effect) (KRW) | — | — | 0.00 | 0.00 | -4.44M | — | — | — | — | — |
| Income taxes paid (cash effect) (KRW) | -6.03B | -7.69B | -8.23B | -10.4B | -5.91B | -2.17B | -8.68B | -6.45B | -12.1B | -5.77B |
| Free cash flow (OCF - PPE - intangibles) (KRW) | -20.3B | 42B | -9.61B | 62.2B | 8.96B | 46.6B | -30.7B | 18.9B | -53.5B | 13.7B |
| Income detail | ||||||||||
| Total comprehensive income (KRW) | — | 13.7B | 17.7B | 26.5B | 31.4B | 25B | 28.1B | 39.7B | 32.2B | 20.6B |
| Comprehensive income to owners (KRW) | 13.2B | 14.3B | 18B | -50.7M | 31.5B | 25.1B | 28.1B | 39.7B | 32.2B | 20.6B |
| Reported | Apr 29, 2020 | Apr 29, 2020 | Mar 19, 2021 | Mar 19, 2021 | Mar 19, 2021 | Mar 11, 2024 | Mar 11, 2024 | Mar 11, 2024 | Mar 17, 2025 | Mar 16, 2026 |
Sign up to see institutional holdings
Sign UpPodcast Mentions
Sign up to see podcast mentions and sentiment
Sign UpDisclosures filed with DART (material events and exchange disclosures), newest first, headlines as filed in Korean. The link opens the filing on DART. Press releases from the company's own website, newest first.


 한국어











Prompts
Click prompts to add them under the company line, click again to take one out, then copy the result into your AI chat. Shared by Asian Century Stocks and Uncovered Thai Stocks. Thank you.
CAREGEN (ticker 214370), listed in South Korea.
Copied
ETFs Holding CAREGEN
Exchange-traded funds whose newest published daily portfolio holds one of the company's listings, largest weight first.
| ETF | Weight in ETF | Shares | Market value | As of |
|---|---|---|---|---|
| AVEE | 0.03% | 1,833 | $ 37.674K | Nov 16, 2026 |
| DEXC | 0.02% | 2,087 | $ 44.314K | Nov 12, 2026 |
| DFSE | 0.01% | 1,850 | $ 39.282K | Nov 12, 2026 |
| DFEM | 0.00% | 17,623 | $ 374.197K | Nov 12, 2026 |
| DFAX | 0.00% | 9,011 | $ 191.334K | Nov 12, 2026 |
| DFAE | 0.00% | 6,450 | $ 136.956K | Nov 12, 2026 |
| AVEM | 0.00% | 12,678 | $ 260.57K | Nov 16, 2026 |