skip to main contants skip to main menu About Us Company Our DNA ExellenS™ Samsung Biologics Way Fact Sheet Milestones Leadership Key Executives CEO Message Locations Overview Bio Campus I Bio Campus II Rockville Campus C-Lab Outside Our Services…
skip to main contants
skip to main menu

Contact Us
search
Contact Us
mobile menu button
- What can we help you find?
- delete
Quick Links
home
Newsroom
Our Story
CONTACT US
UPDATE | September 9, 2026
The Power of Partnership: How Cartography Biosciences Reached IND with Its Bispecific T-Cell Engager
-
LINKEDIN
-
FACEBOOK
-
MAIL
-
COPY
For biotech companies, time is a critical consideration, making reliable, on-time delivery a top priority when selecting a drug development partner. That is especially true for companies developing bispecific therapeutics, where the molecular complexity can create additional development challenges and place greater pressure on already demanding timelines.
Cartography Biosciences (Cartography)
is a therapeutics company building a pipeline of antibody-based therapies, including bispecifics, to advance new immunotherapies for patients with cancer. When progressing its lead program, a T-cell engager for colorectal cancer, finding a partner with the right level of technical expertise, flexibility, and commitment to timelines was essential. We recently sat down with Cartography to learn how the partnership with Samsung Biologics helped the company deliver on its commitment to advancing cancer therapies and achieve IND approval on time.
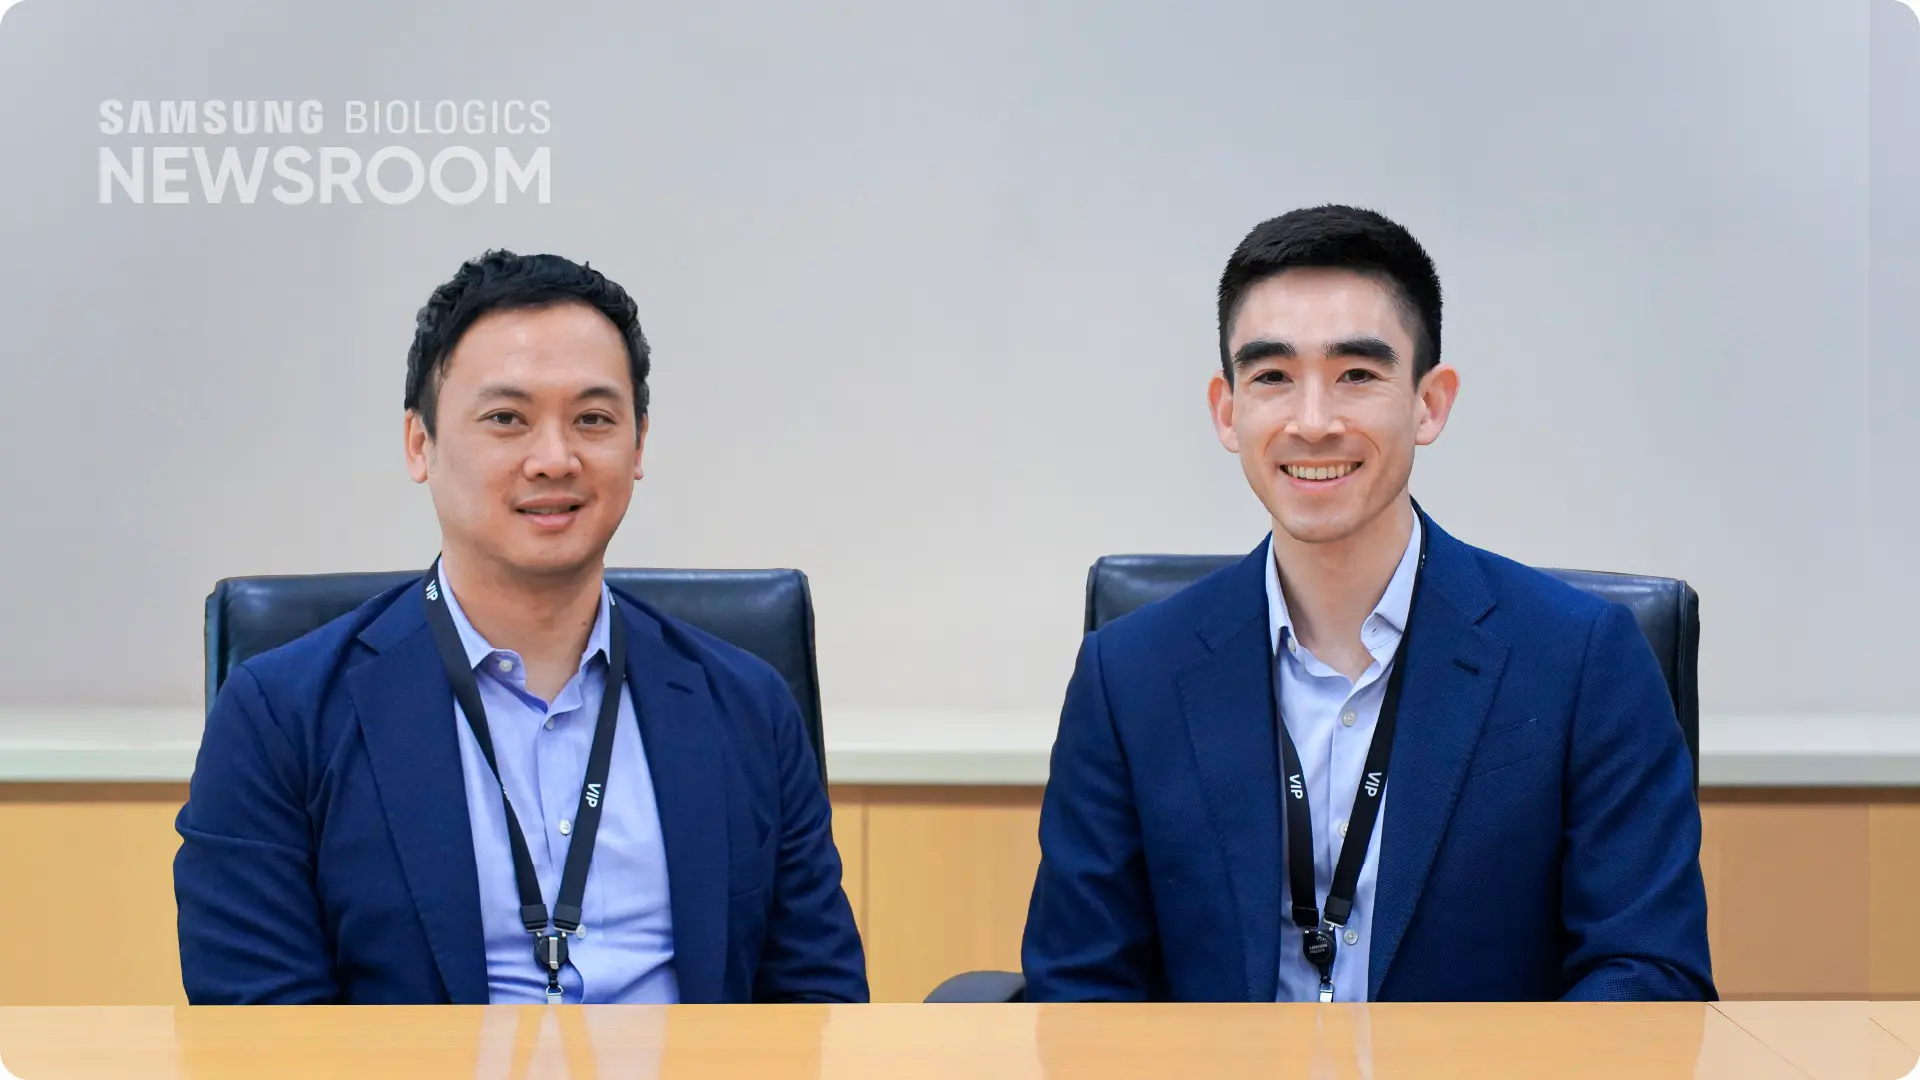
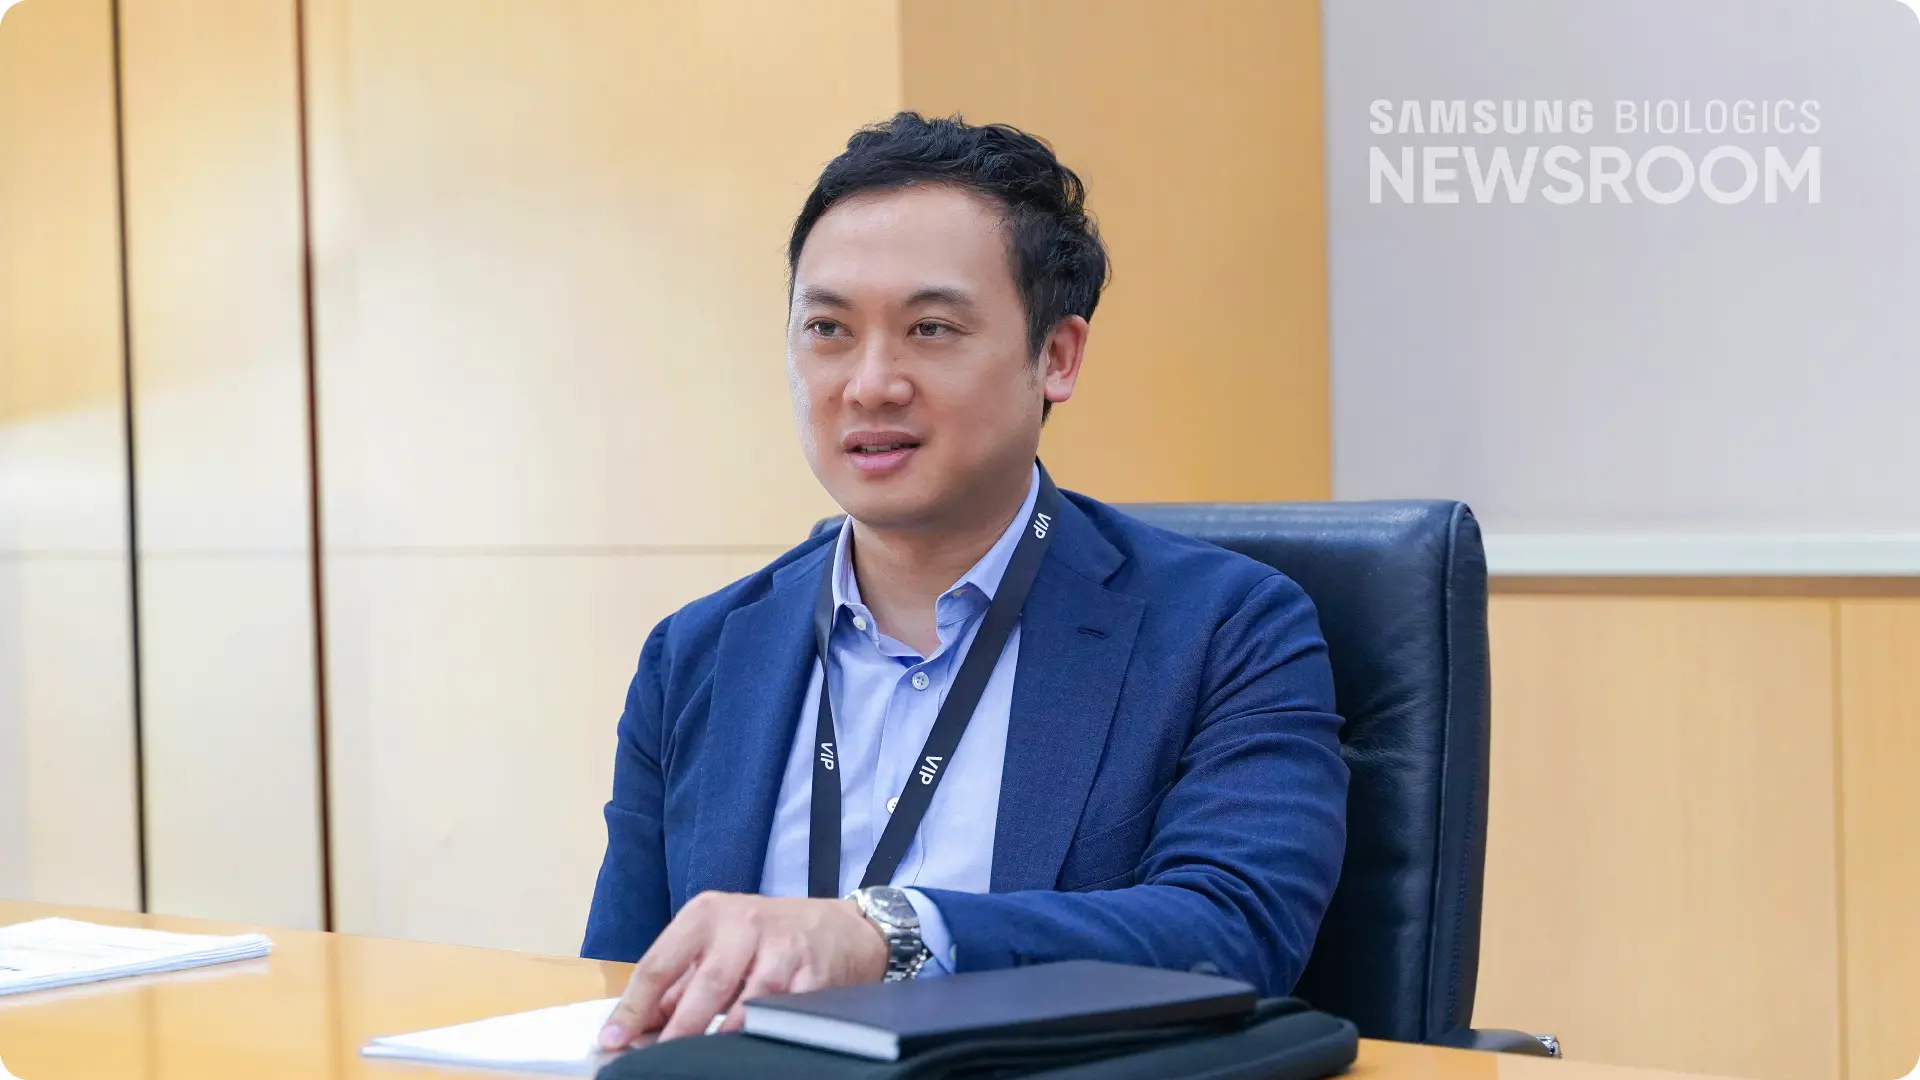
Chester Wong (SVP of Business Development) and Kevin Parker (CEO)
Why Partner with Samsung Biologics?
In 2024, when Cartography first met the Samsung Biologics CDO team to kick off its development program, the company had several criteria for selecting a partner, including:
- Who had the strongest track record?
- Who could deliver on time?
- Who had proven expertise in bispecific therapeutic development?
“Samsung Biologics stood out with their experience, track record, time, and client relationships. We were confident that if we worked with Samsung Biologics, we would develop a high-quality, successful product on time, on track,” said Kevin Parker, CEO of Cartography.
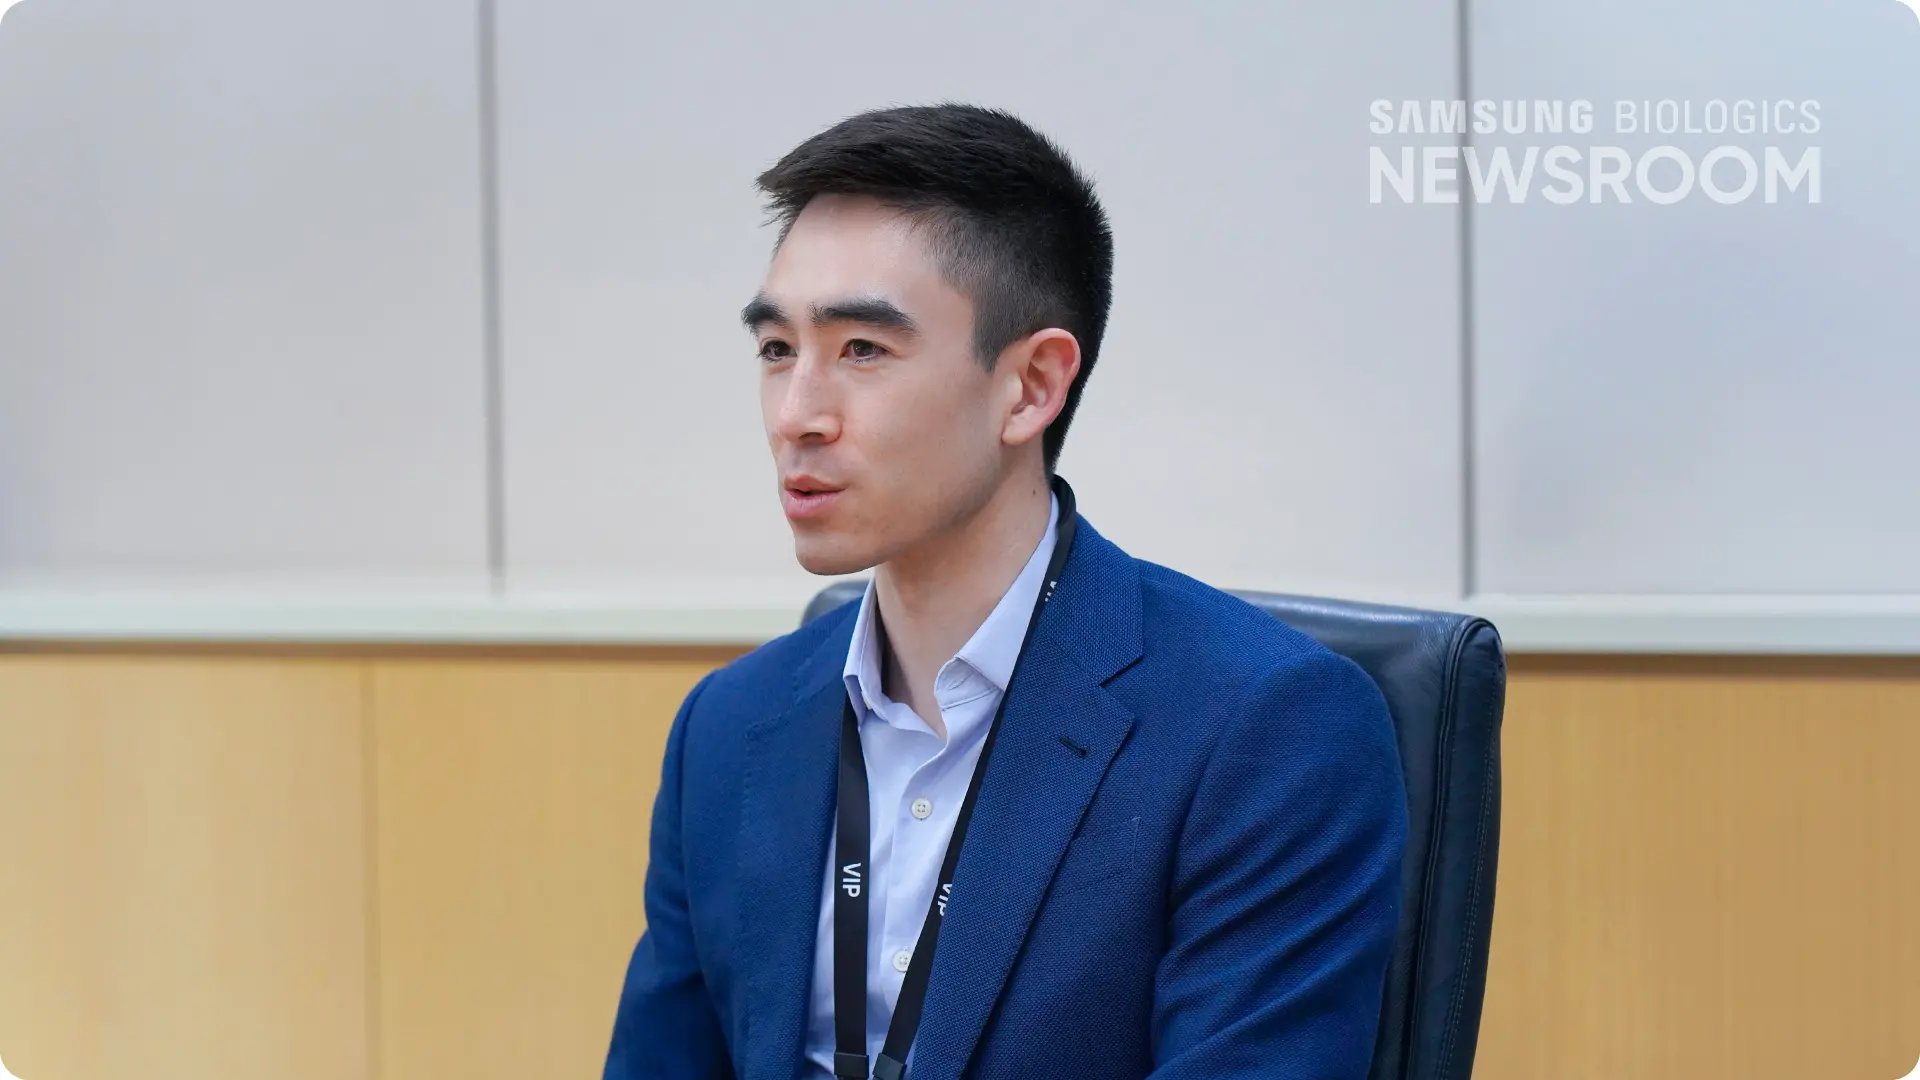
But selecting a partner was only the beginning. What mattered just as much was seeing the expertise prove itself in action, against the specific technical challenges this complex molecule presented. As Cartography’s lead program moved further along its development pathway, the experience and flexibility they had chosen Samsung Biologics for would be put to the test: translating promise into practice, and ultimately, into an on-time delivery.
Expert, Flexible Development: From Cell Line to Analytical Development
The first test came in cell line development
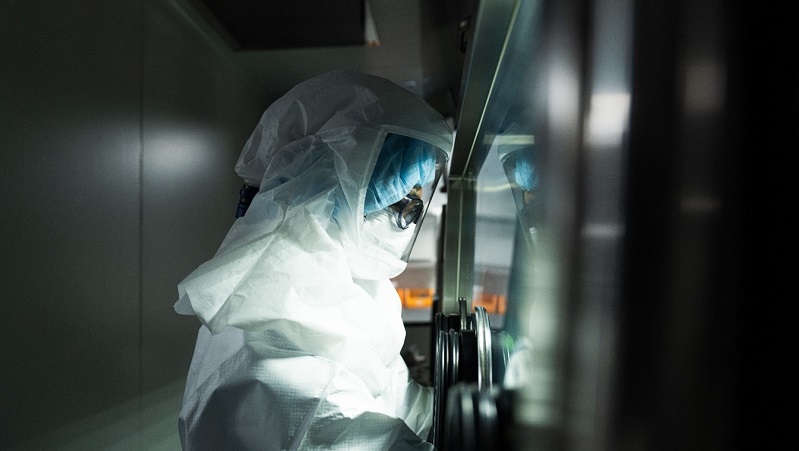
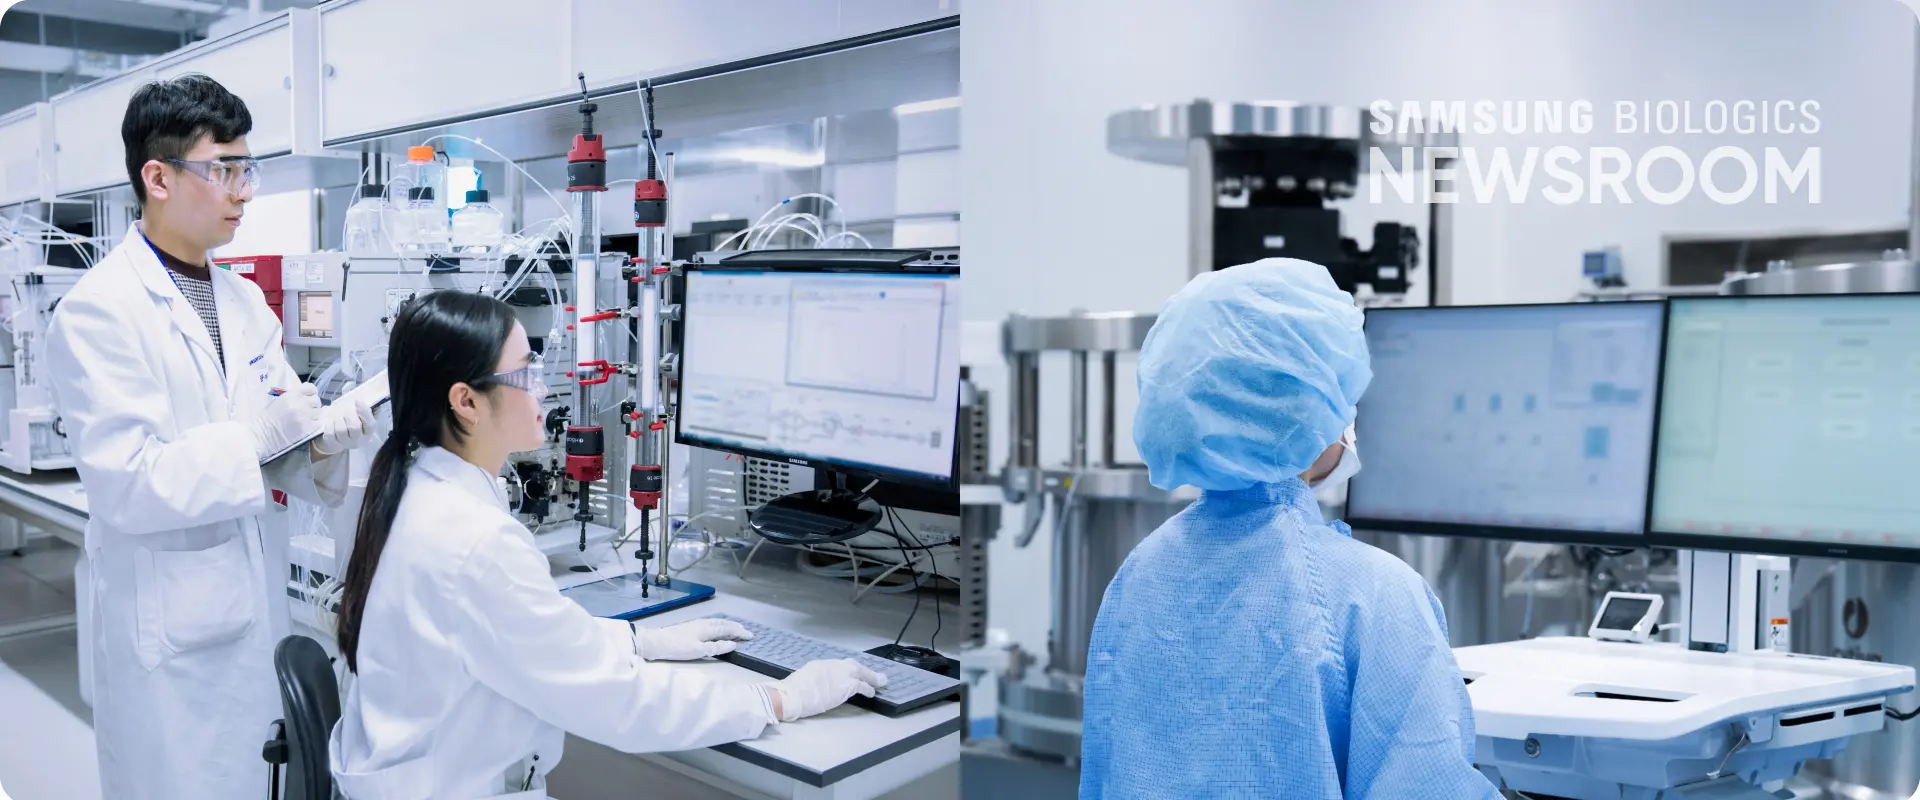
. Samsung Biologics’ experts leveraged their transfection expertise to generate and screen multiple candidates, applying comprehensive analytics to identify the lead with the best overall profile of titer and product quality. The team used two complementary strategies to generate unique pools, then applied comprehensive analytics, adapting to the molecule’s needs. The result was a lead clone that achieved the target titer while maintaining high purity, holding homodimer impurities at low levels, and sustaining stable expression across 60 population doubling levels.
- Upstream Process Development
With high-performing cell lines in hand, the upstream process development
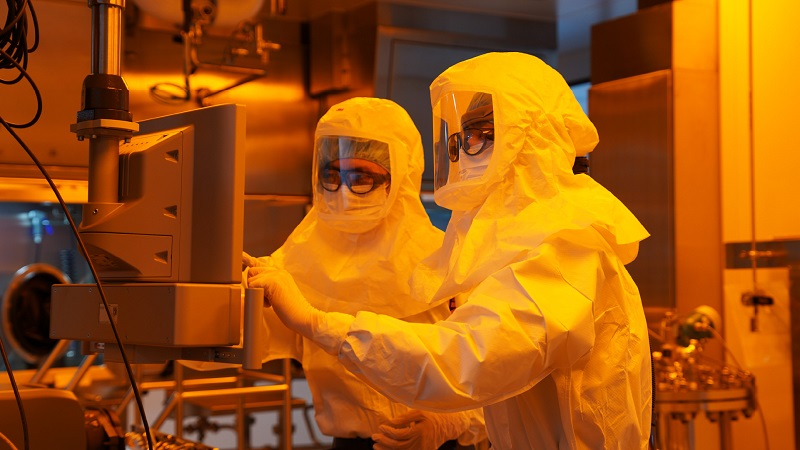
team faced a different pressure: maximizing productivity and quality within a compressed timeline. During the cell pool development, the team accelerated timelines by leveraging historical data to rapidly screen various media combinations and additives - verifying the impact of key growth factors at the shake flask stage. That groundwork delivered seamless upstream process development.
- Downstream Process Development
Downstream development
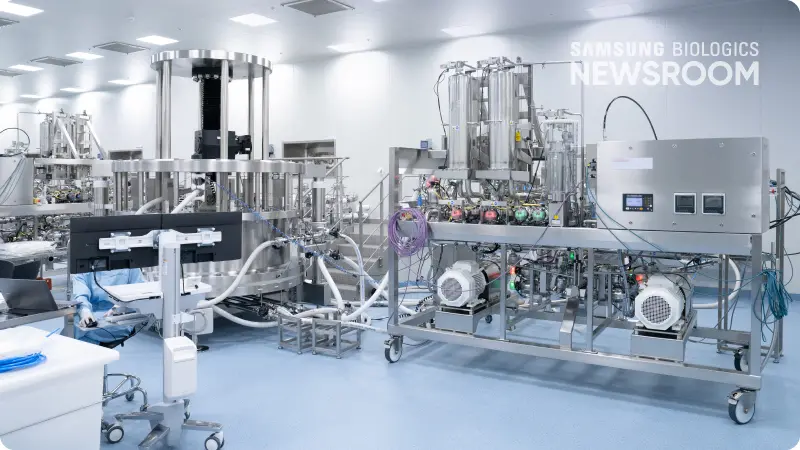
presented another obstacle, where flexibility was critical. Certain concentration conditions demanded a bespoke approach, so the team drew on its flexibility to adapt the process to the molecule’s needs – protecting quality and yield at every step.
Formulation
required a careful balance between chemical and physical stability – a challenge inherent to complex, multispecific molecules. To address this, the formulation team customized its screening studies, optimizing the pH screening range and using data analysis to find that optimal balance. The team’s adaptability mattered most in the beginning stage - when Cartography requested an image-based capillary isoelectric focusing (icIEF) analysis, they optimized the generic method to suit the molecule’s complexity.
The final hurdle was analytical development
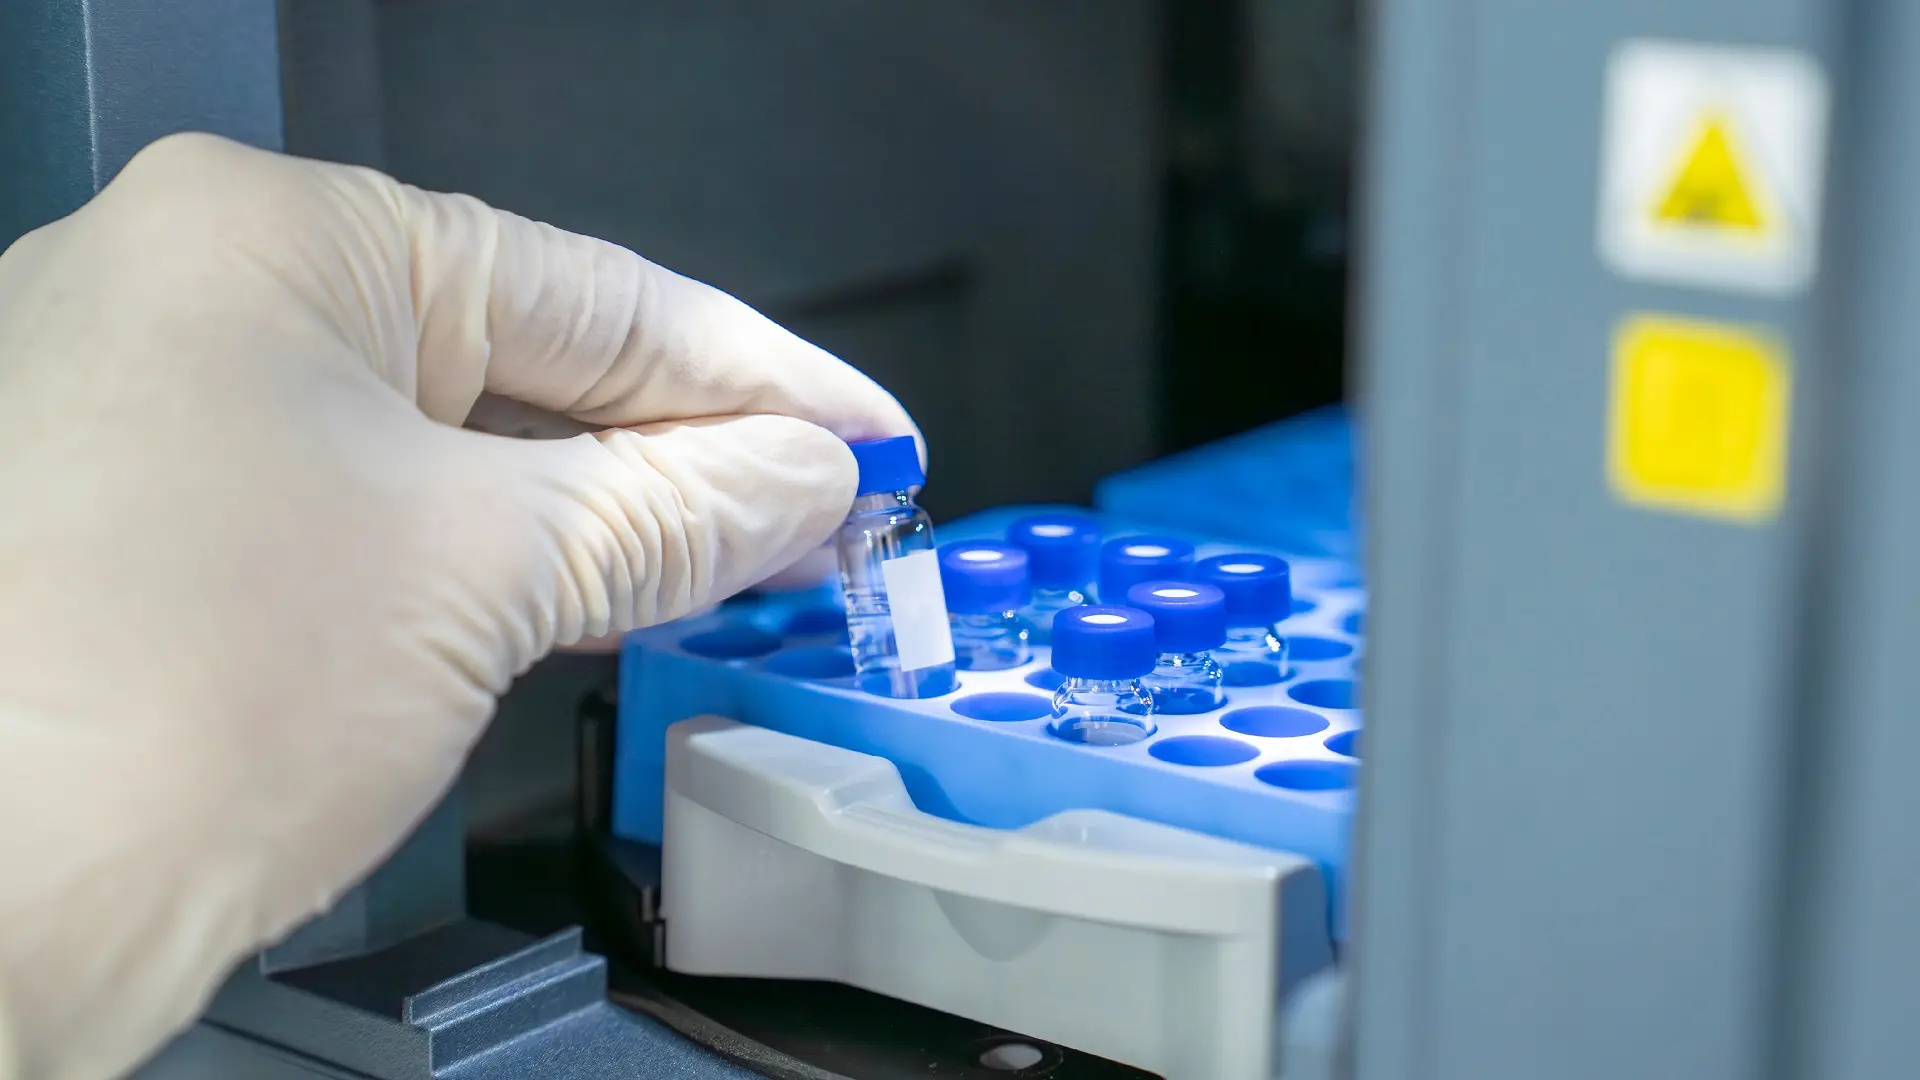
. Because bispecific antibodies are inherently more complex than monoclonal antibodies, they demand more sophisticated analytical strategies. To detect potential homodimer impurities and accurately quantify heterodimer purity while providing stability information, the analytical development team developed a Reverse-Phase Ultra-Performance Liquid Chromatography method that became a core quality-control tool for developing the bispecific candidate.
For Cartography, having a single partner across each of these challenges was invaluable: “It makes everything more seamless. There are no issues from transitioning between one partner and another if you find a good partnership that makes sense and keeps everything a one-stop shop,” said Chester Wong, SVP of Business Development.
Achieving IND Approval - and Beyond
As the project demonstrated, the teams at Samsung Biologics brought deep expertise, proven track records, and the flexibility to adapt at every stage of development and meet client needs. “Whenever something came up, everybody mobilized and managed each step,” said Parker. “Every project has at least a couple of hiccups. I felt it was a very good collaboration with the Samsung Biologics team to figure those out and move forward.”
Reflecting on the partnership overall, the Cartography team emphasized the transparency and trust built along the way.
“What felt like a true partnership to me was the collaboration throughout and the on-time delivery of a high-quality product. We did not feel that things were changing along the way. The partnership felt transparent. The experience has built a lot of trust on our side.” - Kevin Parker, CEO of Cartography
Samsung recently announced an investment in Cartography Biosciences through the Samsung Life Science Fund. Building on their development partnership, this strategic investment further deepens the relationship as Samsung Biologics and Cartography Biosciences continue their journey together toward developing next-generation cancer therapeutics.
For biotech companies, time is a critical consideration, making reliable, on-time delivery a top priority when selecting a drug development partner. That is especially true for companies developing bispecific therapeutics, where the molecular complexity can create additional development challenges and place greater pressure on already demanding timelines.
Cartography Biosciences (Cartography)
is a therapeutics company building a pipeline of antibody-based therapies, including bispecifics, to advance new immunotherapies for patients with cancer. When progressing its lead program, a T-cell engager for colorectal cancer, finding a partner with the right level of technical expertise, flexibility, and commitment to timelines was essential. We recently sat down with Cartography to learn how the partnership with Samsung Biologics helped the company deliver on its commitment to advancing cancer therapies and achieve IND approval on time.
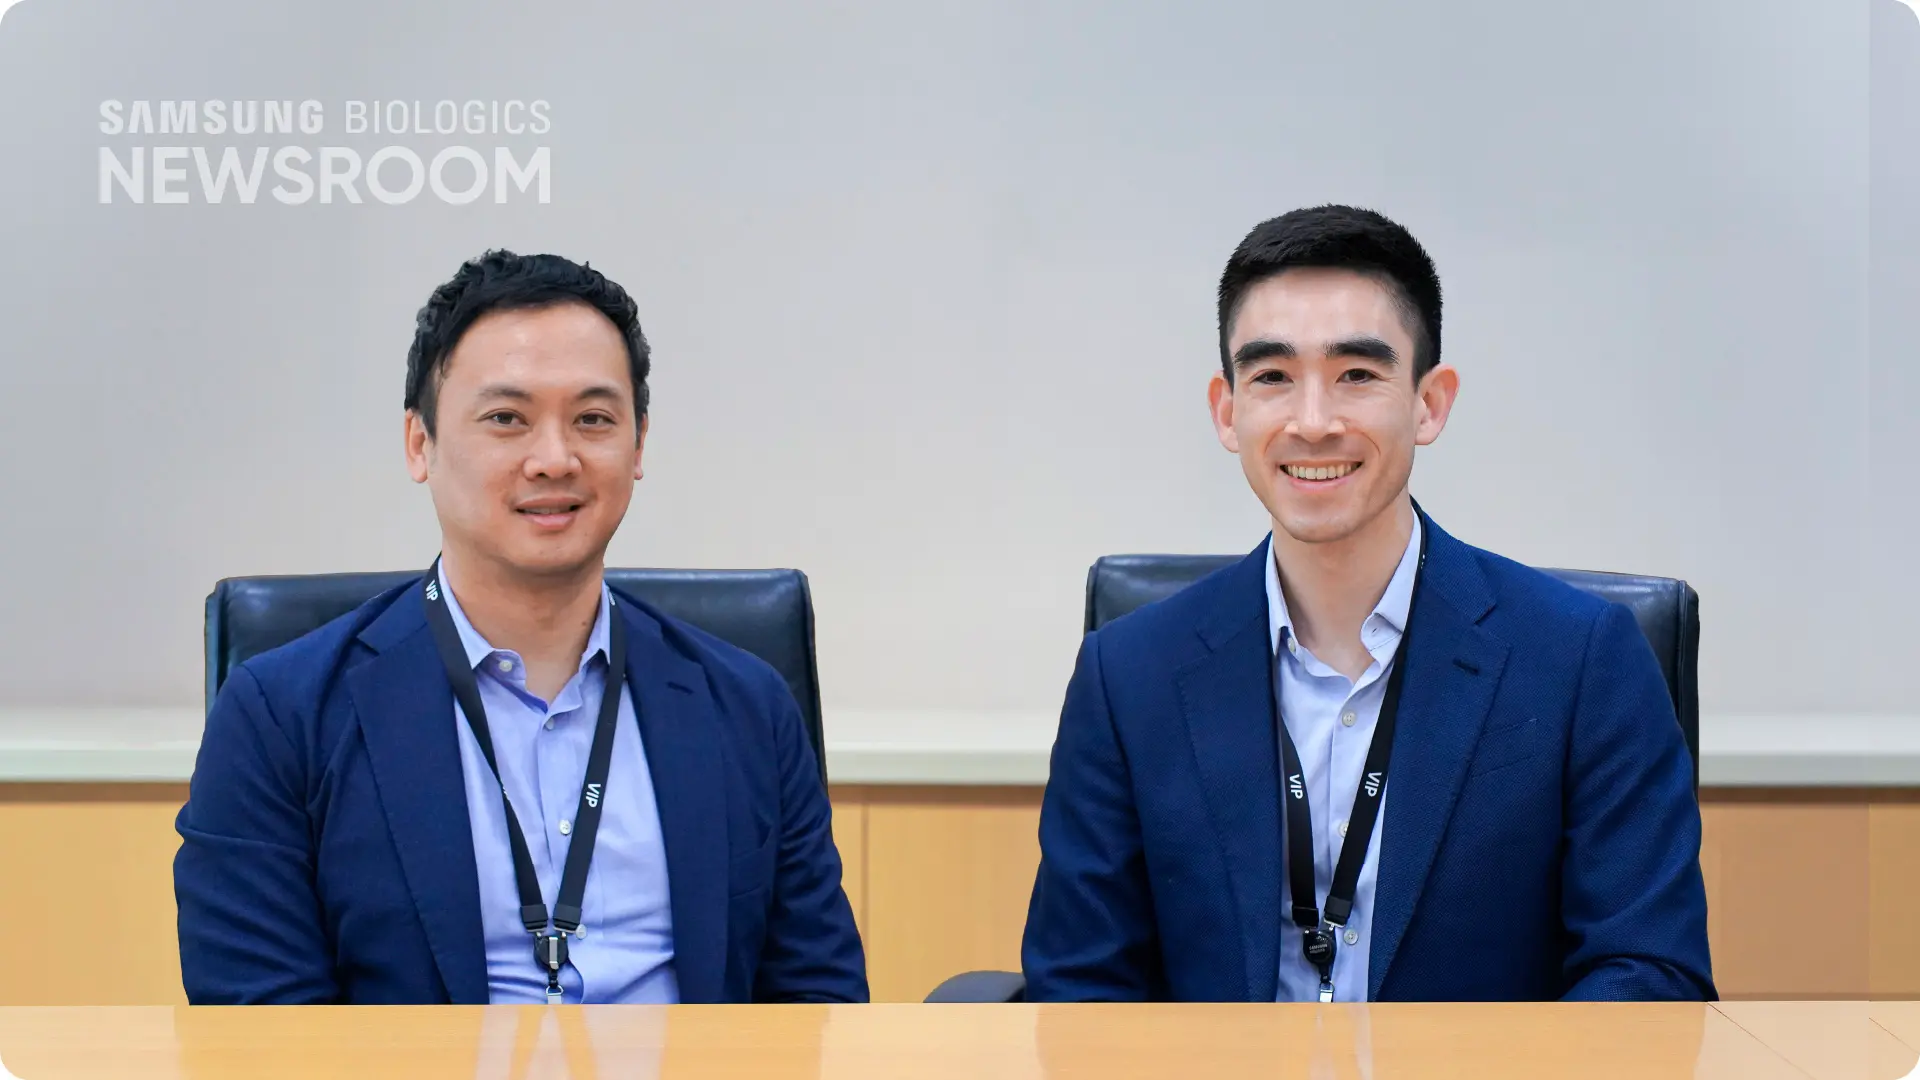
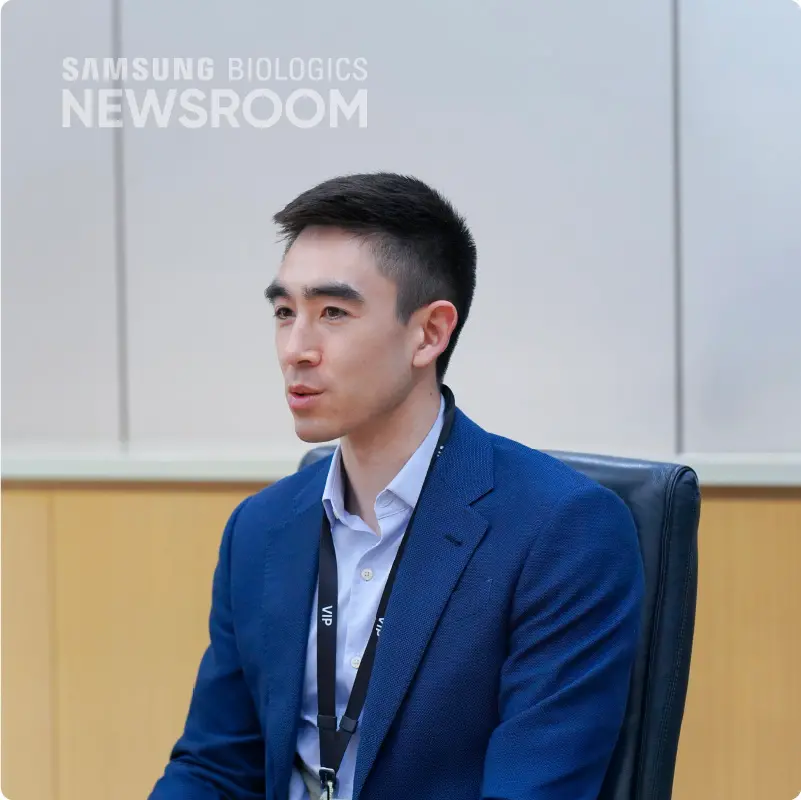
Chester Wong (SVP of Business Development) and Kevin Parker (CEO)
Why Partner with Samsung Biologics?
In 2024, when Cartography first met the Samsung Biologics CDO team to kick off its development program, the company had several criteria for selecting a partner, including:
- Who had the strongest track record?
- Who could deliver on time?
- Who had proven expertise in bispecific therapeutic development?
“Samsung Biologics stood out with their experience, track record, time, and client relationships. We were confident that if we worked with Samsung Biologics, we would develop a high-quality, successful product on time, on track,” said Kevin Parker, CEO of Cartography.
But selecting a partner was only the beginning. What mattered just as much was seeing the expertise prove itself in action, against the specific technical challenges this complex molecule presented. As Cartography’s lead program moved further along its development pathway, the experience and flexibility they had chosen Samsung Biologics for would be put to the test: translating promise into practice, and ultimately, into an on-time delivery.
Expert, Flexible Development: From Cell Line to Analytical Development
Cell Line Development
The first test came in cell line development
. Samsung Biologics’ experts leveraged their transfection expertise to generate and screen multiple candidates, applying comprehensive analytics to identify the lead with the best overall profile of titer and product quality. The team used two complementary strategies to generate unique pools, then applied comprehensive analytics, adapting to the molecule’s needs. The result was a lead clone that achieved the target titer while maintaining high purity, holding homodimer impurities at low levels, and sustaining stable expression across 60 population doubling levels.
Upstream Process Development
With high-performing cell lines in hand, the upstream process development
team faced a different pressure: maximizing productivity and quality within a compressed timeline. During the cell pool development, the team accelerated timelines by leveraging historical data to rapidly screen various media combinations and additives - verifying the impact of key growth factors at the shake flask stage. That groundwork delivered seamless upstream process development.
Downstream Process Development
Downstream development
presented another obstacle, where flexibility was critical. Certain concentration conditions demanded a bespoke approach, so the team drew on its flexibility to adapt the process to the molecule’s needs – protecting quality and yield at every step.
Formulation Development
Formulation
required a careful balance between chemical and physical stability – a challenge inherent to complex, multispecific molecules. To address this, the formulation team customized its screening studies, optimizing the pH screening range and using data analysis to find that optimal balance. The team’s adaptability mattered most in the beginning stage - when Cartography requested an image-based capillary isoelectric focusing (icIEF) analysis, they optimized the generic method to suit the molecule’s complexity.
Analytical Development
The final hurdle was analytical development
. Because bispecific antibodies are inherently more complex than monoclonal antibodies, they demand more sophisticated analytical strategies. To detect potential homodimer impurities and accurately quantify heterodimer purity while providing stability information, the analytical development team developed a Reverse-Phase Ultra-Performance Liquid Chromatography method that became a core quality-control tool for developing the bispecific candidate.
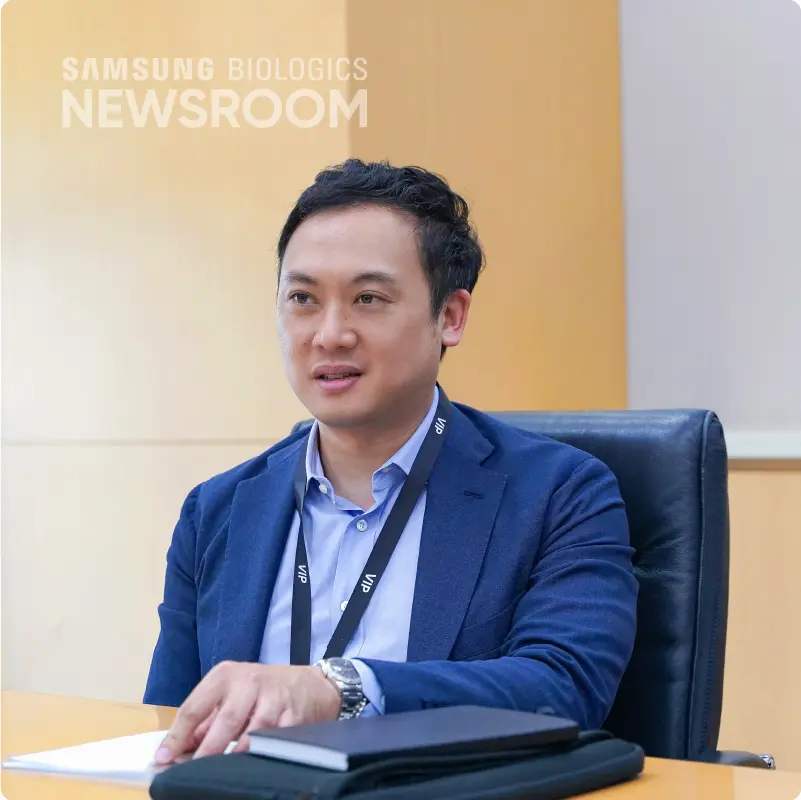
For Cartography, having a single partner across each of these challenges was invaluable: “It makes everything more seamless. There are no issues from transitioning between one partner and another if you find a good partnership that makes sense and keeps everything a one-stop shop,” said Chester Wong, SVP of Business Development.
Achieving IND Approval - and Beyond
As the project demonstrated, the teams at Samsung Biologics brought deep expertise, proven track records, and the flexibility to adapt at every stage of development and meet client needs. “Whenever something came up, everybody mobilized and managed each step,” said Parker. “Every project has at least a couple of hiccups. I felt it was a very good collaboration with the Samsung Biologics team to figure those out and move forward.”
Reflecting on the partnership overall, the Cartography team emphasized the transparency and trust built along the way.
“What felt like a true partnership to me was the collaboration throughout and the on-time delivery of a high-quality product. We did not feel that things were changing along the way. The partnership felt transparent. The experience has built a lot of trust on our side.” - Kevin Parker, CEO of Cartography
Samsung recently announced an investment in Cartography Biosciences through the Samsung Life Science Fund. Building on their development partnership, this strategic investment further deepens the relationship as Samsung Biologics and Cartography Biosciences continue their journey together toward developing next-generation cancer therapeutics.
#Client Story
#Partnership
#Bispecific Antibody
#Development Service
Share article
-
LINKEDIN
-
FACEBOOK
-
MAIL
-
COPY
Back to List
Related Content

Samsung BIO Insight
Powering progress through partnership: CDMO collaboration for fast-tracked success
Jul 15, 2025
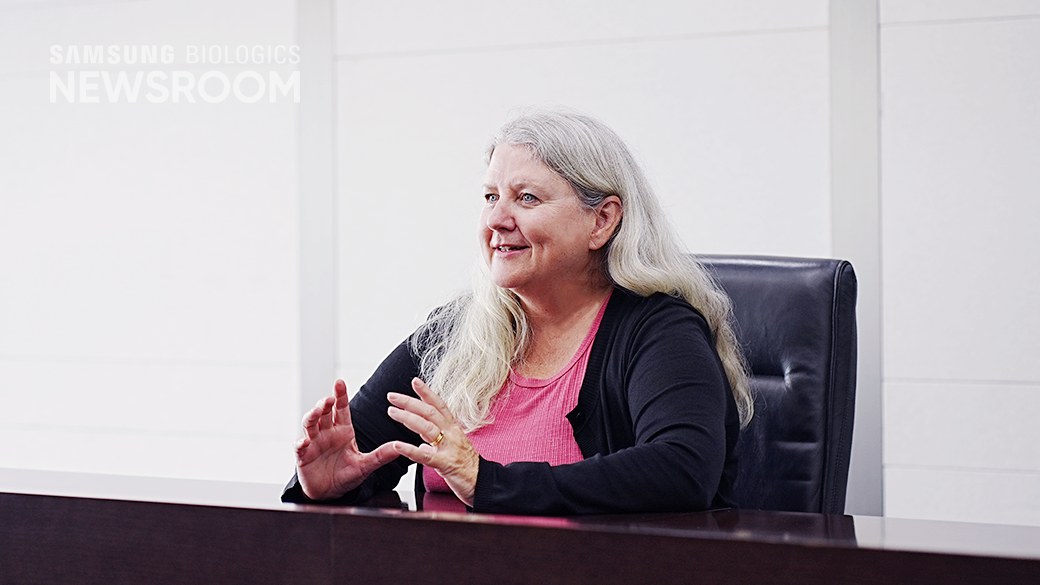
How Samsung Biologics supported a Canadian biopharmaceutical company in attaining two clinical approvals of recombinant proteins Thomas Loisel, left, Vice President of Manufacturing at 35Pharma, and
Samsung BIO Insight
Bringing flexible solutions to champion shared commitment to saving lives
Nov 1, 2024
How Samsung Biologics has leveraged flexibility to build trust and achieve mutual goals. Scientist-to-scientist trust sprouts when they share goals, grows as they work to solve problems, and blossom
Samsung BIO Insight
Forging a trusted partnership in end-to-end drug development
Aug 16, 2023
How Samsung Biologics fostered a collaborative and transparent environment to meet a client’s time-sensitive project deadline Nathan Ihle, Senior Vice President of Pharmaceutical Operations
Samsung BIO Insight
Building a transformative partnership in drug development
May 22, 2023
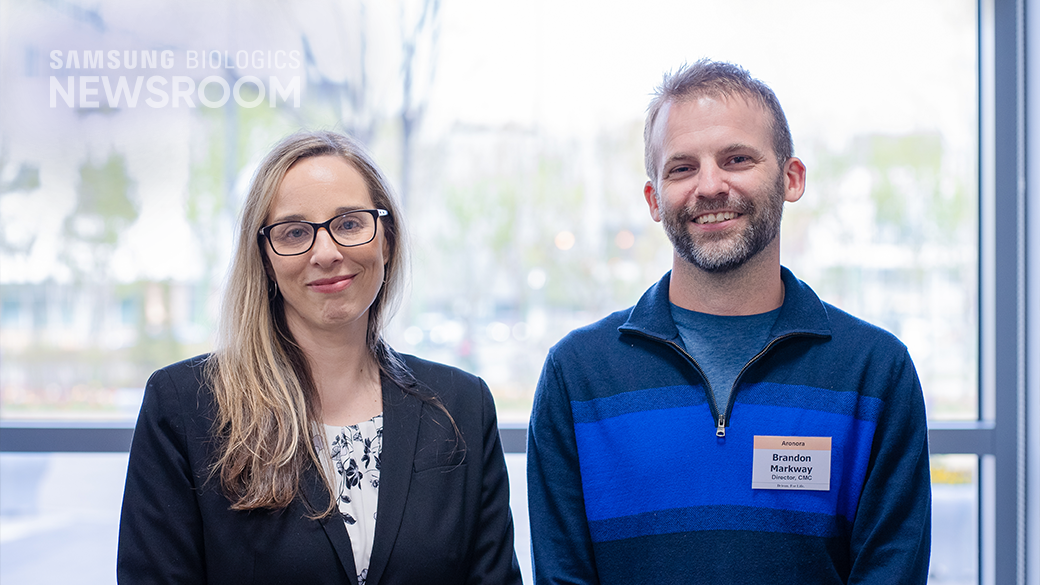
How Samsung Biologics’ streamlined processes, dedicated project management, and proprietary platforms can pave the way for drug development success Christina Lorentz, left, Director of Clinic
top button
Cookies
We use cookies to improve the experience for visitors to our websites including site operation, analytics, or advertising. Choose the use of cookies and/or modify your preferences here.
Accept cookies
Reject cookies
300, Songdobio-daero, Yeonsu-gu, Incheon, Republic of Korea Directions
ⓒ 2026 Samsung Biologics. All rights reserved.
- KOREA AEO Mark
- Best Family-Friendly Management Mark
- Ministry of Science and ICT WA (Web Accessibility)Quality Certification Mark
ⓒ 2026 Samsung Biologics. All rights reserved.
SITE MAP
close
Close
Your download is ready
Click Download.
Download
Close
Subscribe to Our Newsletter
Please fill in your details, select one or more areas of interest, and click the subscribe button to receive our newsletter.
Subscribe to Our Newsletter
-
E-mail
-
Company
-
Name
-
Job Title
-
Country
Search Country
-
Interests
-
I agree to the Privacy Policy
to collect the email address that I have provided until I withdraw my consent. The collected information will only be used for the purpose of mailing service. If you do not wish to consent, you will not be able to receive the newsletter. Samsung Biologics respects the privacy of its subscribers.
Close
Please fill out the form
to view the full content
Please sign up to view the post..
* Required
I agree to the Privacy Policy
required
Join our community to receive the latest news, information, and tailored marketing resources.
close
COOKIE POLICY
Get focus link
Last Updated: [31 Mar 2023]
This Cookie Policy applies to the Samsung Biologics website (the “Website”). Please read this Cookie Policy carefully and feel free to contact us if you have any questions.
Your Privacy
- What are cookies?
A cookie is a small text file that a website saves on your computer or mobile device when you visit the Website. It enables the Website to remember your actions and preferences (such as language preferences) over a period of time, so you don't have to keep re-entering them whenever you come back to the Website or browse from one page to another.
- How to control cookies
You can control and/or delete cookies as you wish - for details, see http://www.aboutcookies.org. You can delete all cookies that are already on your computer and you can set most browsers to prevent them from being placed. If you do this, however, you may have to manually adjust some preferences every time you visit a site and some services and functionalities may not work.
Strictly Necessary
Cookies
Always Active
These cookies are necessary for the website to function and cannot be switched off in our systems. They are usually only set in response to actions made by you which amount to a request for services, such as setting your privacy preferences, logging in or filling in forms. You can set your browser to block or alert you about these cookies, but some parts of the site will not then work. These cookies do not store any personally identifiable information.
Performance
Cookies
Performance Cookies question of assent
These cookies are used to collect information about how visitors use our website. We use the information to compile reports and to help us improve the website. The cookies collect information in an anonymous form, including the number of visitors to the website, where visitors have come to the website from and the pages they visited.
Google Analytics
This website uses Google Analytics, a website analytics service provided by Google, Inc. (“Google”). Google Analytics uses cookies and the information generated by the cookie is usually transmitted to a Google server in the USA and stored there.
You can prevent Google’s collection of the data generated by the cookie and related use of the website, including your IP address, as well as the processing of such data by Google by downloading and installing the browser plug-in available under the following link: http://tolls.google.com/dlpage/gaoptout
.
Targeting
Cookies
Targeting Cookies question of assent
These Cookies are used by advertising companies to inform and serve personalized ads more relevant to your interests. These Cookies also may facilitate sharing information with social networks or recording your interactions with particular ads.
We currently do not use any cookies in this category
Confirm My Choices Accept cookies