분기보고서 (2026.09)
Bull 0
Bear 0
Routine
200880
|
SEOYONEHWA is a manufacturer of automotive interior and exterior trim components. The company produces products including door trims, consoles, luggage side trims, headlinings, package trays, seats for small commercial vehicles, bumpers, tail gate trims, and cowl tops. It operates a global production network with subsidiaries in Europe, China, India, the United States, Mexico, and Brazil. The company supplies major customers including Hyundai Motor Company, Kia, Ford, Mercedes-Benz, Volkswagen, Audi, and Nissan. SEOYONEHWA was founded in 1972 and formerly operated under the name Hanil Ewha before changing its name to SEOYONEHWA. It is a subsidiary of the SeoYeon Group and utilizes the SeoYeon brand for its automotive parts. Summarised from the company's own disclosures, fiscal year ended Mar 2026 |
Industry Auto Parts | Homepage seoyoneh.com |
| Sector Consumer Cyclical | IR page — | |
|
Tags
automotive interior trim, automotive exterior trim, door trims, bumpers, seats, headlinings, oem supplier, aftermarket parts, eco-friendly materials, lightweighting, SeoYeon, SeoYeon Auto Vision, SeoYeon Summit India, SeoYeon Summit Anantapur, SeoYeon Ewha Mexico, SeoYeon Ewha Poland, SeoYeon Ewha Slovakia, SeoYeon Ewha Georgia, SeoYeon Ewha Alabama, SeoYeon Ewha Brazil, SeoYeon Ewha Asan, Apex Plastic, Best Auto Tech, M Auto Tech, Beijing Hainatian SeoYeon Research Institute, Jiangsu SeoYeon Ewha Research Institute, SeoYeon Summit India Research Institute
|
Press page — |
Metrics
| Valuation | |
|---|---|
| Market cap | — |
| Market cap (USD) | — |
| P/E | — |
| PEG | — |
| P/BV | — |
| P/S | — |
| P/OCF | — |
| P/FCF | — |
| Dividend yield | — |
| Turnover / mcap | — |
| Returns | |
|---|---|
| ROE | 5.3% |
| ROI | 5.1% |
| ROIC | 8.7% |
| Profit margin | 1.3% |
| Growth | |
|---|---|
| Revenue growing | Yes |
| Profits growing | No |
| Revenue up 3y | Yes |
| Revenue up 5y | Yes |
| Earnings growth 3y (net profit CAGR) | 2.5% |
| Quality | |
|---|---|
| Profitable | Yes |
| Margin expanding | No |
| Buying back stock | — |
| Diluting (TTM) | — |
| Debt/Equity | — |
| Podcast bulls (TTM) | Sign up |
| Podcast bears (TTM) | Sign up |
| Podcast sentiment (TTM) | Sign up |
| Podcast sentiment % (TTM) | Sign up |
| News sentiment (TTM) | — |
| Quality score | 27.3% |
| Insiders | |
|---|---|
| Buys, 1w | Sign up |
| Buys, 1m | Sign up |
| Buys, 1y | Sign up |
| Sells, 1w | Sign up |
| Sells, 1m | Sign up |
| Sells, 1y | Sign up |
Sign up to see this company's insider trades
| Figure | FY 2025 | FY 2024 | FY 2023 | FY 2022 | FY 2021 | FY 2020 | FY 2019 | FY 2018 | FY 2017 | FY 2016 | FY 2015 | FY 2014 |
|---|---|---|---|---|---|---|---|---|---|---|---|---|
| Revenue | 4.505T | 4.042T | 3.574T | 2.845T | 2.18T | 1.962T | 1.977T | 1.907T | 2.007T | 2.403T | 2.289T | 1.125T |
| Net profit | 59.992B | 147.295B | 157.774B | 55.676B | 26.293B | -41.281B | -46.52B | -6.609B | 34.149B | 91.4B | 79.591B | 51.766B |
| Free cash flow | -88.648B | -135.601B | -69.541B | 123.619B | 81.811B | -11.095B | -91.768B | -210.3B | 2.376B | — | — | — |
Filed figures
Lines the statements and their notes report beside the headline figures, read from the filings' XBRL as filed (no restatement applied), with figures computed from one filing's own lines. Cash-flow lines carry their cash direction: an outflow is negative. Each period links to its filing; a figure's period, report date and tag are in its tooltip.
| Figure | Dec 2016 | Dec 2017 | Dec 2018 | Dec 2019 | Dec 2020 | Dec 2021 | Dec 2022 | Dec 2023 | Dec 2024 | Dec 2025 |
|---|---|---|---|---|---|---|---|---|---|---|
| Balance sheet detail | ||||||||||
| Trade receivables (KRW) | 437B | 303B | 410B | 361B | 360B | 335B | 431B | 447B | 496B | 555B |
| ↳ YoY growth | +0.8% | -30.6% | +35.2% | -12.0% | -0.1% | -6.9% | +28.6% | +3.7% | +10.8% | +11.9% |
| ↳ 5y CAGR | -4.4% | -3.6% | -5.1% | +7.3% | +1.8% | +6.6% | +9.0% | |||
| Other receivables (KRW) | 9.33B | 14.3B | 6.57B | 34B | 7.73B | 7.08B | 6.66B | 13.4B | 2.56B | 3.84B |
| Borrowings, current (KRW) | 40.3B | 463B | 390B | 399B | 360B | 318B | 312B | 293B | 423B | 433B |
| Borrowings, non-current (KRW) | 87.8B | 46.4B | 128B | 203B | 235B | 196B | 157B | 219B | 264B | 340B |
| Lease liabilities (KRW) | — | 0.00 | 0.00 | 8.59B | 13.6B | 13.2B | 11.4B | 35.4B | 60.1B | 74.2B |
| Cash and deposits (KRW) | 232B | 305B | 132B | 115B | 147B | 120B | 209B | 169B | 202B | 146B |
| Intangible assets (KRW) | 29.9B | — | 24.5B | 13.6B | 14.4B | 12.2B | 10.8B | 95.3B | 90.4B | 75.1B |
| Right-of-use assets (KRW) | — | 0.00 | 0.00 | 57.2B | 59.5B | 64.2B | 59.4B | 78.4B | 112B | 126B |
| Net debt (borrowings + leases - cash) (KRW) | -144B | 204B | 386B | 495B | 462B | 407B | 272B | 379B | 545B | 701B |
| Cash flow detail | ||||||||||
| Operating cash flow (KRW) | 116B | 141B | -30.2B | 192B | 115B | 188B | 218B | 190B | 267B | 164B |
| Purchases of property, plant and equipment (KRW) | -156B | -138B | -180B | -283B | -126B | -106B | -94B | -259B | -402B | -253B |
| Purchases of intangible assets (KRW) | -4.09B | -2.42B | -8.92B | -5.87B | -3.74B | -1.86B | -1.25B | -2.31B | -2.13B | -5.84B |
| Dividends paid (cash effect) (KRW) | -5.44B | -5.25B | -4.05B | -2.7B | -2.7B | -3.93B | -5.42B | -5.5B | -5.4B | -6.76B |
| Interest paid (cash effect) (KRW) | -13.6B | -14.8B | -19.2B | -20B | -18.9B | -17.5B | -19.3B | -31.1B | -30.4B | -31.7B |
| Income taxes paid (cash effect) (KRW) | -45.9B | 41B | -16.4B | -10.5B | -3.34B | -21.4B | -41.6B | -33.5B | -66.3B | -72.9B |
| Free cash flow (OCF - PPE - intangibles) (KRW) | -43.6B | -42.5M | -219B | -97.6B | -14.8B | 79.9B | 122B | -71.9B | -138B | -94.5B |
| Income detail | ||||||||||
| Total comprehensive income (KRW) | 73.5B | 4.9B | -9.47B | -42.3B | -38.3B | 69.6B | 64.6B | 171B | 236B | 75.9B |
| Comprehensive income to owners (KRW) | 71.4B | 9.17B | -8.71B | -40.7B | -36.2B | 64.2B | 61.4B | 164B | 223B | 78.3B |
| Reported | Apr 2, 2018 | Mar 31, 2020 | Mar 31, 2021 | May 15, 2020 | Mar 31, 2021 | Mar 20, 2024 | Mar 20, 2024 | Mar 20, 2024 | Mar 31, 2025 | Mar 18, 2026 |
Sign up to see institutional holdings
Sign UpPodcast Mentions
Sign up to see podcast mentions and sentiment
Sign UpDisclosures filed with DART (material events and exchange disclosures), newest first, headlines as filed in Korean. The link opens the filing on DART. Press releases from the company's own website, newest first.
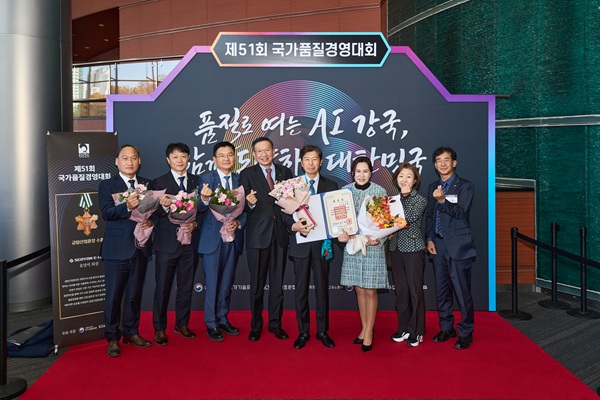
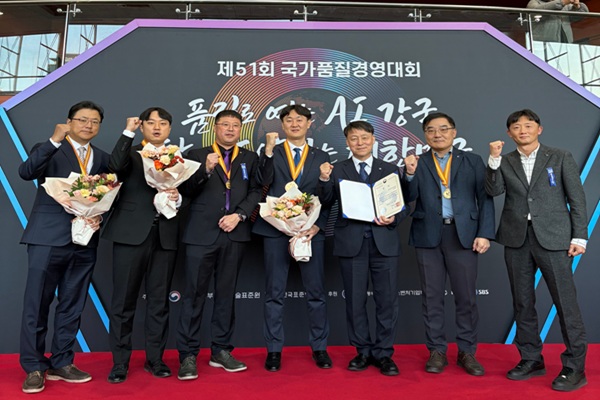
수상소식 서연이화 제 110차 IR52 장영실상 수상
Bull 2
Bear 0
Other
작성일 26-08-26 13:12
조회수 1,793

㈜서연이화는 그룹 내 서연오토비전과 공동으로 개발한 “All-In-One, One-press Stitch 공법을 활용한 고감성 도어트림 제조기술”로 제110차 IR52 장영실상을 수상하였습니다.
IR52 장영실상은 국내 기업과 연구기관이 개발한 우수 신기술 및 제품을 발굴하여 기술개발을 촉진하고, 연구개발자의 성과를 널리 알리기 위해 수여하는 국내 대표 산업기술상입니다.
이번에 수상한 「All-In-One, One-press Stitch 공법을 활용한 고감성 도어트림 제조기술」은 자동차 내장부품의 고급감을 높이기 위해 적용되는
리얼스티치(Real Stitch) 원단 커버링 공정을 혁신적으로 개선한 기술입니다.
기존 원단 커버링 공정은 원단 예열, 작업자의 수작업 가접, 원단 압착 등 여러 단계의 작업을 각각 수행해야 했으나,
본 기술은 작업자가 수행하던 일련의 공정을 독자적인 작동 메커니즘과 금형 기술을 통해 하나의 프레스 공정으로 통합한 공정 자동화 기술입니다.
기존 공법과 동등 수준의 외관 품질을 확보하면서도 생산공정을 대폭 단순화하여 감성 인테리어 부품에 대한 품질 경쟁력과 가격 경쟁력을 동시에 확보한 것이 특징입니다.
이번 장영실상은 서연그룹 외 타사와의 공동수상이 아닌, 그룹 내 계열사들과의 유기적인 협업을 통해 서연만의 독자적인 기술적 성과를 창출하고
이를 대외적으로 인정받은 사례로 라는 점에서 더욱 큰 의미가 있습니다.
수상 기술은 투싼, 펠리세이드, 텔루라이드 등 총 3개 차종에 적용되어 양산 중이며, 향후 다양한 고감성 자동차 내장부품으로 양산 적용 범위를 확대해 나갈 예정입니다.
이날 시상식에 참석한 강상욱 선행기술연구실장은 “이번 장영실상 수상은 서연이 독자적으로 확보한 공정 혁신 기술의 우수성과 경쟁력을 대외적으로 인정받은 뜻깊은 성과”라며, “앞으로도 기존 제조공정의 한계를 뛰어넘는 차별화된 기술 개발을 지속하고, 고감성·고품질 자동차 인테리어 구현과 제조 경쟁력 강화에 기여할 수 있도록 기술 적용을 확대해 나가겠다”고 밝혔습니다.

[본사] 경기도 안양시 동안구 부림로 170번길 41-22 |
Tel 031-420-3200 |
Fax 031-420-3120
COPYRIGHT © 2021 SEOYON E-HWA. ALL RIGHT RESERVED.
사이트 바로가기
COPYRIGHT © 2021 SEOYON E-HWA. ALL RIGHT RESERVED.
반기보고서 (2026.06)
Bull 0
Bear 0
Routine




Prompts
Click prompts to add them under the company line, click again to take one out, then copy the result into your AI chat. Shared by Asian Century Stocks and Uncovered Thai Stocks. Thank you.
SEOYONEHWA (ticker 200880), listed in South Korea.
Copied
ETFs Holding SEOYONEHWA
Exchange-traded funds whose newest published daily portfolio holds one of the company's listings, largest weight first.
| ETF | Weight in ETF | Shares | Market value | As of |
|---|---|---|---|---|
| DEXC | 0.00% | 1,619 | $ 11.779K | Nov 12, 2026 |
| DFEM | 0.00% | 37,539 | $ 273.124K | Nov 12, 2026 |
| DFSE | 0.00% | 2,136 | $ 15.541K | Nov 12, 2026 |
| DFEV | 0.00% | 6,821 | $ 49.628K | Nov 12, 2026 |
| DFAE | 0.00% | 14,187 | $ 103.221K | Nov 12, 2026 |
| DFAX | 0.00% | 8,107 | $ 58.984K | Nov 12, 2026 |
| AVEM | 0.00% | 36,492 | $ 260.872K | Nov 16, 2026 |
| AVES | 0.00% | 6,370 | $ 45.538K | Nov 16, 2026 |
| AVEE | 0.00% | 419 | $ 2,995.33 | Nov 16, 2026 |
| AVXC | 0.00% | 61 | $ 436.07 | Nov 16, 2026 |