분기보고서 (2026.09)
Bull 0
Bear 0
Results
108490
|
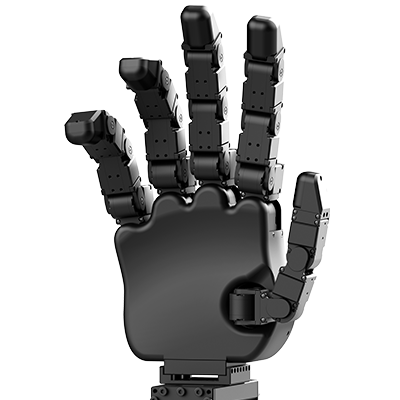
ROBOTIS is a robotics company that develops and manufactures robot-specific actuators, precision reducers, and autonomous robots. Its core business segment involves the production of DYNAMIXEL actuators, which are modular smart actuators integrating motors, reducers, controllers, and communication functions for use in industrial and service robotics. The company also manufactures DYD precision reducers and offers the DYNAMIXEL X, P, and Y series products. In the finished robot segment, ROBOTIS develops the GAEMI autonomous delivery robot for indoor and outdoor logistics, and the AI Worker, a semi-humanoid robot designed for industrial tasks using imitation and reinforcement learning. The company is expanding into a data factory business, collecting and processing action data from its hardware to support Physical AI development. ROBOTIS serves markets in South Korea, Japan, North America, and other regions, with sales offices in the US, China, and Japan. It collaborates with institutions such as Stanford University and MIT on robotic research and development. The autonomous robot business segment was transferred to a spin-off entity, ROBOTIS AI, in June 2025. Summarised from the company's own disclosures, fiscal year ended Jul 2026 |
Industry Industrial Distribution | Homepage robotis.com |
| Sector Industrials | IR page — | |
|
Tags
robot actuators, smart actuators, precision reducers, autonomous delivery robots, humanoid robots, industrial robotics, physical ai, robot components, service robotics, motion control, DYNAMIXEL, DYD, GAEMI, AI Worker, DYNAMIXEL X-Series, DYNAMIXEL P-Series, DYNAMIXEL Y-Series, ROBOTIS AI, THORMANG, Open Manipulator Y, HX Hand
|
Press page — |
Metrics
| Valuation | |
|---|---|
| Market cap | ₩ 3.574T |
| Market cap (USD) | $ 2.63B |
| P/E | — |
| PEG | — |
| P/BV | 9.93 |
| P/S | 74.37 |
| P/OCF | — |
| P/FCF | -350.94 |
| Dividend yield | — |
| Turnover / mcap | — |
| Returns | |
|---|---|
| ROE | 2.5% |
| ROI | 1.6% |
| ROIC | 1.1% |
| Profit margin | 13.0% |
| Growth | |
|---|---|
| Revenue growing | Yes |
| Profits growing | Yes |
| Revenue up 3y | Yes |
| Revenue up 5y | Yes |
| Earnings growth 3y (net profit CAGR) | — |
| Quality | |
|---|---|
| Profitable | Yes |
| Margin expanding | Yes |
| Buying back stock | No |
| Diluting (TTM) | Yes |
| Debt/Equity | — |
| Podcast bulls (TTM) | Sign up |
| Podcast bears (TTM) | Sign up |
| Podcast sentiment (TTM) | Sign up |
| Podcast sentiment % (TTM) | Sign up |
| News sentiment (TTM) | — |
| Quality score | 26.7% |
| Insiders | |
|---|---|
| Buys, 1w | Sign up |
| Buys, 1m | Sign up |
| Buys, 1y | Sign up |
| Sells, 1w | Sign up |
| Sells, 1m | Sign up |
| Sells, 1y | Sign up |
Sign up to see this company's insider trades
| Figure | FY 2025 | FY 2024 | FY 2023 | FY 2022 | FY 2021 | FY 2020 | FY 2019 | FY 2018 | FY 2017 | FY 2016 |
|---|---|---|---|---|---|---|---|---|---|---|
| Revenue | 38.943B | 30.038B | 29.128B | 25.856B | 22.358B | 19.231B | 25.231B | 24.267B | 17.914B | 14.864B |
| Net profit | 5.074B | -3.142B | -1.351B | -259.565M | 726.834M | -135.085M | 2.491B | 2.372B | 1.781B | 857.073M |
| Free cash flow | 4.881B | 1.093B | -6.988B | 8.865B | -35.769M | -2.91B | 3.298B | -9.776B | -6.513B | -6.096B |
Filed figures
Lines the statements and their notes report beside the headline figures, read from the filings' XBRL as filed (no restatement applied), with figures computed from one filing's own lines. Cash-flow lines carry their cash direction: an outflow is negative. Each period links to its filing; a figure's period, report date and tag are in its tooltip.
| Figure | Dec 2016 | Dec 2017 | Dec 2018 | Dec 2019 | Dec 2020 | Dec 2021 | Dec 2022 | Dec 2023 | Dec 2024 | Dec 2025 |
|---|---|---|---|---|---|---|---|---|---|---|
| Balance sheet detail | ||||||||||
| Trade receivables (KRW) | 1.52B | 2.24B | 1.71B | 1.56B | 788M | 1.77B | 1.74B | 3.73B | 1.53B | 4.61B |
| ↳ YoY growth | +46.9% | -23.4% | -9.0% | -49.5% | +124.4% | -1.5% | +114.4% | -59.0% | +201.5% | |
| ↳ 5y CAGR | +3.0% | -4.9% | +16.9% | -0.4% | +42.4% | |||||
| Borrowings, current (KRW) | 0.00 | 1.3B | 1.57B | 0.00 | 0.00 | 7.42B | 12.8B | 9.33B | 1.29B | 0.00 |
| Borrowings, non-current (KRW) | 5.5B | 5.94B | 2.75B | 0.00 | 7.8B | 0.00 | 12.1B | 0.00 | 0.00 | — |
| Bonds payable (KRW) | — | — | 0.00 | 0.00 | 7.8B | 7.42B | 14.9B | 9.33B | 1.29B | 0.00 |
| Lease liabilities (KRW) | — | — | — | — | — | 0.00 | 11.2M | 1.61M | 0.00 | 19.7M |
| Cash and deposits (KRW) | 3.26B | 20.1B | 13.5B | 9.68B | 9.23B | 15.4B | 25.7B | 7.35B | 11.7B | 31B |
| Intangible assets (KRW) | 267M | 412M | 723M | 973M | 1.02B | 840M | 746M | 629M | 492M | 968M |
| Net debt (borrowings + leases - cash) (KRW) | 2.24B | -12.9B | -9.19B | -9.68B | -1.43B | -7.94B | -777M | 1.98B | -10.4B | -31B |
| Cash flow detail | ||||||||||
| Operating cash flow (KRW) | 1.35B | -151M | 535M | 4.18B | -568M | 1.37B | 12.5B | -4.75B | 5.36B | 7.08B |
| Purchases of property, plant and equipment (KRW) | -7.45B | -6.36B | -10.3B | -884M | -2.34B | -1.4B | -3.62B | -2.24B | -4.26B | -2.19B |
| Purchases of intangible assets (KRW) | -139M | -186M | -320M | -274M | -467M | -80.1M | -153M | -105M | -90.5M | -246M |
| Change in receivables (cash effect) (KRW) | -254M | -844M | -1.29B | 364M | 527M | -642M | 274M | -1.29B | 1.6B | -2.3B |
| Change in inventories (cash effect) (KRW) | -1.26B | -204M | -1.58B | -98.7M | -1.35B | -236M | -5.05B | -2.76B | 999M | 444M |
| Change in payables (cash effect) (KRW) | 117M | -254M | 124M | -209M | 28.4M | 71.2M | 200M | 171M | -686M | 569M |
| Share buybacks (cash effect) (KRW) | — | — | 0.00 | -2.68B | -300M | -475M | -2.5B | 0.00 | -1.51B | -365M |
| Interest paid (cash effect) (KRW) | -112M | -13.6M | -54.2M | -341M | -257M | 0.00 | -63.7M | -35.5M | -26.9M | -200,704 |
| Income taxes paid (cash effect) (KRW) | -52M | -276M | -29.5M | -519M | -94M | -285M | -349M | -210M | -483M | -392M |
| Share-based compensation (KRW) | 0.00 | 0.00 | 132M | 166M | 41.5M | 88.5M | 135M | 168M | 0.00 | 393M |
| Operating cash flow before change in receivables (KRW) | 1.61B | 694M | 1.83B | 3.82B | -1.09B | 2.01B | 12.2B | -3.45B | 3.76B | 9.38B |
| Free cash flow (OCF - PPE - intangibles) (KRW) | -6.23B | -6.7B | -10.1B | 3.02B | -3.38B | -116M | 8.71B | -7.09B | 1B | 4.63B |
| Income detail | ||||||||||
| Total comprehensive income (KRW) | 865M | 1.77B | 2.33B | 2.44B | -373M | 917M | 29.8M | -1.22B | -2.39B | 5.26B |
| Comprehensive income to owners (KRW) | 865M | 1.77B | 2.34B | 2.45B | -371M | 915M | -31.1M | -1.27B | -2.61B | 5.05B |
| Provision for credit losses (KRW) | 34.1M | 19.9M | 7.65M | -42.4M | 38.1M | 18.8M | -5.28M | 30.2M | -18.5M | 32.6M |
| Credit cost ratio (credit losses / average receivables) (%) | — | 1.1% | 0.4% | 2.6% | 3.2% | 1.5% | 0.3% | 1.1% | 0.7% | 1.1% |
| Reported | Apr 2, 2019 | Apr 2, 2019 | Aug 26, 2021 | Aug 26, 2021 | Aug 26, 2021 | Mar 20, 2024 | Mar 20, 2024 | Mar 20, 2024 | Mar 17, 2025 | Jul 8, 2026 |
Sign up to see institutional holdings
Sign UpPodcast Mentions
Sign up to see podcast mentions and sentiment
Sign UpDisclosures filed with DART (material events and exchange disclosures), newest first, headlines as filed in Korean. The link opens the filing on DART. Press releases from the company's own website, newest first.




Prompts
Click prompts to add them under the company line, click again to take one out, then copy the result into your AI chat. Shared by Asian Century Stocks and Uncovered Thai Stocks. Thank you.
ROBOTIS (ticker 108490), listed in South Korea.
Copied
ETFs Holding ROBOTIS
Exchange-traded funds whose newest published daily portfolio holds one of the company's listings, largest weight first.
| ETF | Weight in ETF | Shares | Market value | As of |
|---|---|---|---|---|
| HUMN | 3.67% | 18,299 | $ 2.892M | Nov 17, 2026 |