[기재정정]금전대여결정(자회사의 주요경영사항)
Bull 0
Bear 0
Routine
096770
|
SK Innovation is a diversified energy and chemical company that merged with SK E&S in November 2024 to form an integrated energy group. The company operates across several key business segments: oil refining and trading, petrochemicals, lubricants, batteries, battery materials, oil and gas exploration and production, and LNG and power generation. In the oil and petrochemical sector, it refines crude oil into fuels and produces basic chemicals such as olefins and aromatics, as well as high-performance chemical materials. The battery segment manufactures electric vehicle and energy storage system batteries, while the materials segment produces lithium-ion battery separators. The company also engages in oil and gas exploration and production in various global regions and operates LNG power plants and city gas distribution networks. SK Innovation serves customers in North America, Europe, Asia, and the Middle East, supplying major automotive manufacturers, chemical producers, and energy utilities. Key subsidiaries include SK Energy, SK Geo Centric, SK On, SK AI Technology, and SK Innovation E&S CIC. Summarised from the company's own disclosures, fiscal year ended Mar 2026 |
Industry Oil & Gas Integrated | Homepage skinnovation.com |
| Sector Energy | IR page skinnovation.com/ir | |
|
Tags
crude oil refining, petrochemicals, electric vehicle batteries, energy storage systems, lithium-ion battery separators, oil and gas exploration, lng power generation, city gas distribution, lubricants, biofuels, SK Energy, SK Geo Centric, SK On, SK AI Technology, SK Innovation E&S CIC, SK Enmove, SK Trading International, SK Earthon, BlueOval SK, SK Battery America, SK On Hungary, SK On Jiangsu, SK On Yancheng, Beijing BESK Technology, Huizhou EVE United Energy, Korea Petroleum Corporation, Yukong, Sunkyong Group, SK Group, Saudi SABIC, Nexlene, Marib Block, China 17/03, Binaiya, Serpang, North Ketapang, Kwangyang Power Plant, Paju Power Plant, Hanam Power Plant, Wiri Power Plant, Gangdong Fuel Cell, Ensolb, Busan Junggwang Energy, Yeoju Power Plant, Korea Gas Corporation, Korea Electric Power Corporation, Korea Electric Power Exchange, Kuwait Petroleum Corporation, PT Pertamina, Repsol Petroleo, ENEOS Corporation, Tricon Energy, SK PIC Global, Taekwang Industry, Mitsui & Co., UNIPEC America, Hyundai Motor Group, Mercedes-Benz Group, Volkswagen, Ford Motor Company, L&F, Green Olios, Yuri Robotics
|
Press page — |
Metrics
| Valuation | |
|---|---|
| Market cap | — |
| Market cap (USD) | — |
| P/E | — |
| PEG | — |
| P/BV | — |
| P/S | — |
| P/OCF | — |
| P/FCF | — |
| Dividend yield | — |
| Turnover / mcap | — |
| Returns | |
|---|---|
| ROE | -14.4% |
| ROI | -15.4% |
| ROIC | 1.5% |
| Profit margin | -4.2% |
| Growth | |
|---|---|
| Revenue growing | Yes |
| Profits growing | No |
| Revenue up 3y | No |
| Revenue up 5y | No |
| Earnings growth 3y (net profit CAGR) | — |
| Quality | |
|---|---|
| Profitable | No |
| Margin expanding | No |
| Buying back stock | No |
| Diluting (TTM) | Yes |
| Debt/Equity | — |
| Podcast bulls (TTM) | Sign up |
| Podcast bears (TTM) | Sign up |
| Podcast sentiment (TTM) | Sign up |
| Podcast sentiment % (TTM) | Sign up |
| News sentiment (TTM) | — |
| Quality score | -50.0% |
| Insiders | |
|---|---|
| Buys, 1w | Sign up |
| Buys, 1m | Sign up |
| Buys, 1y | Sign up |
| Sells, 1w | Sign up |
| Sells, 1m | Sign up |
| Sells, 1y | Sign up |
Sign up to see this company's insider trades
| Figure | FY 2025 | FY 2024 | FY 2023 | FY 2022 | FY 2021 | FY 2020 | FY 2019 | FY 2018 | FY 2017 | FY 2016 | FY 2015 | FY 2014 | FY 2013 |
|---|---|---|---|---|---|---|---|---|---|---|---|---|---|
| Revenue | 80.296T | 74.717T | 77.288T | 78.057T | 46.853T | 34.165T | 49.877T | 54.511T | 46.261T | 39.521T | 48.356T | 65.861T | 66.039T |
| Net profit | -3.348T | -2.26T | 256.25B | 1.569T | 292.092B | — | 65.775B | 1.651T | 2.104T | 1.671T | 814.928B | -588.832B | 729.92B |
| Free cash flow | -3.084T | -7.795T | -5.87T | -6.37T | -3.671T | -912.294B | -750.767B | 449.129B | 1.242T | 3.071T | 3.637T | -708.003B | -1.344T |
Filed figures
Lines the statements and their notes report beside the headline figures, read from the filings' XBRL as filed (no restatement applied), with figures computed from one filing's own lines. Cash-flow lines carry their cash direction: an outflow is negative. Each period links to its filing; a figure's period, report date and tag are in its tooltip.
| Figure | Dec 2016 | Dec 2017 | Dec 2018 | Dec 2019 | Dec 2020 | Dec 2021 | Dec 2022 | Dec 2023 | Dec 2024 | Dec 2025 |
|---|---|---|---|---|---|---|---|---|---|---|
| Balance sheet detail | ||||||||||
| Trade receivables (KRW) | 3.94T | 4.82T | 4.46T | 4.14T | 2.51T | 4.25T | 6.28T | 5.93T | 7.04T | 6.1T |
| ↳ YoY growth | +13.2% | +22.5% | -7.5% | -7.2% | -39.4% | +69.5% | +47.8% | -5.6% | +18.7% | -13.3% |
| ↳ 5y CAGR | -2.8% | -2.2% | -6.3% | +1.5% | +5.4% | +5.9% | +11.2% | +19.5% | ||
| Other receivables (KRW) | 335B | 476B | 696B | 750B | 414B | — | 1.57T | 1.67T | — | — |
| Borrowings, current (KRW) | 1.68T | 1.52T | 1.38T | 2.29T | 3.01T | 2.41T | 12.1T | 11.2T | 17.6T | 8.89T |
| Borrowings, non-current (KRW) | 4.87T | — | — | — | — | 13.4T | 13.4T | 17.7T | 27T | 22.8T |
| Lease liabilities (KRW) | — | 1.19B | 24.4M | 1.16T | 1.12T | 1.64T | 1.71T | 1.58T | 2.5T | 2.33T |
| Cash and deposits (KRW) | 2.64T | 2T | 1.86T | 2.2T | 2.94T | 3.42T | 9.48T | 13.1T | 15.9T | 16.1T |
| Intangible assets (KRW) | 1.27T | 1.52T | — | — | — | 1.91T | 2.08T | 2.3T | 2.94T | 2.34T |
| Right-of-use assets (KRW) | — | 0.00 | 0.00 | 1.13T | 1.11T | 1.42T | 1.47T | 1.35T | 2.22T | 2.03T |
| Net debt (borrowings + leases - cash) (KRW) | 3.9T | -488B | -481B | 1.25T | 1.18T | 14T | 4.29T | 17.5T | 31.3T | 17.9T |
| Cash flow detail | ||||||||||
| Operating cash flow (KRW) | 3.68T | 2.18T | 1.73T | 1.83T | 2.85T | -495B | 407B | 5.37T | 2.23T | 2.28T |
| Purchases of property, plant and equipment (KRW) | -607B | -938B | -1.28T | -2.58T | -3.76T | -3.18T | -6.78T | -11.2T | -10T | -5.37T |
| Purchases of intangible assets (KRW) | -57.7B | -71.9B | -212B | -178B | -139B | -78.4B | -291B | -257B | -182B | -283B |
| Dividends paid (cash effect) (KRW) | -451B | -757B | -822B | -1T | -149B | -25.2B | -217B | -314B | -314B | -681B |
| Share buybacks (cash effect) (KRW) | — | 0.00 | -1T | 0.00 | -496B | — | 0.00 | 0.00 | -335B | 0.00 |
| Interest paid (cash effect) (KRW) | -259B | -211B | -244B | -351B | -374B | -418B | -671B | -1.27T | -1.47T | -1.36T |
| Income taxes paid (cash effect) (KRW) | -519B | -651B | -733B | -529B | -190B | -262B | -739B | -842B | -586B | -569B |
| Free cash flow (OCF - PPE - intangibles) (KRW) | 3.01T | 1.17T | 237B | -929B | -1.05T | -3.75T | -6.66T | -6.13T | -7.98T | -3.37T |
| Income detail | ||||||||||
| Total comprehensive income (KRW) | 1.71T | 1.88T | 1.82T | 151B | -2.46T | 1.16T | 2.07T | 654B | 1.02T | -5.94T |
| Comprehensive income to owners (KRW) | 1.66T | 1.85T | 1.76T | — | — | 938B | 1.8T | 366B | 12.2B | -3.8T |
| Provision for credit losses (KRW) | — | — | — | — | — | — | 421M | -2.52B | 196M | 9.7B |
| Credit cost ratio (credit losses / average receivables) (%) | — | — | — | — | — | — | 0.0% | 0.0% | 0.0% | 0.1% |
| Reported | Nov 14, 2017 | Mar 30, 2020 | Mar 30, 2020 | Mar 30, 2020 | Mar 18, 2021 | Mar 20, 2024 | Mar 18, 2025 | Mar 18, 2025 | Mar 18, 2025 | Mar 16, 2026 |
Sign up to see institutional holdings
Sign UpPodcast Mentions
Sign up to see podcast mentions and sentiment
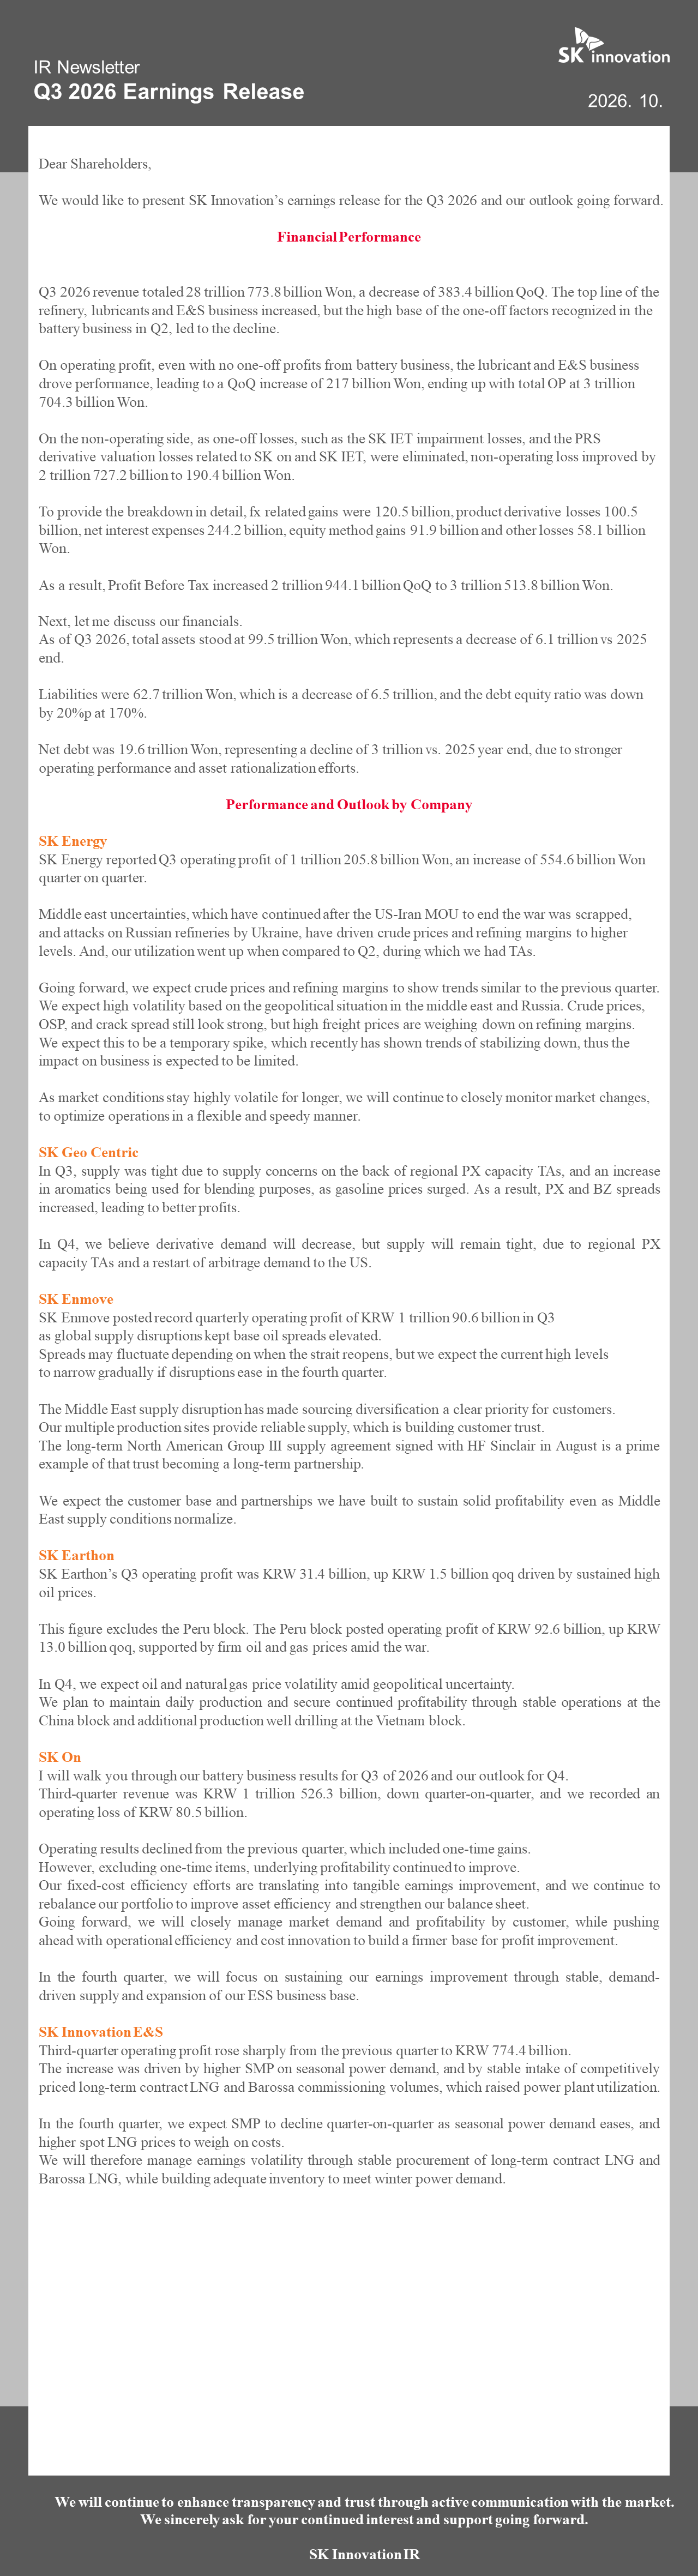
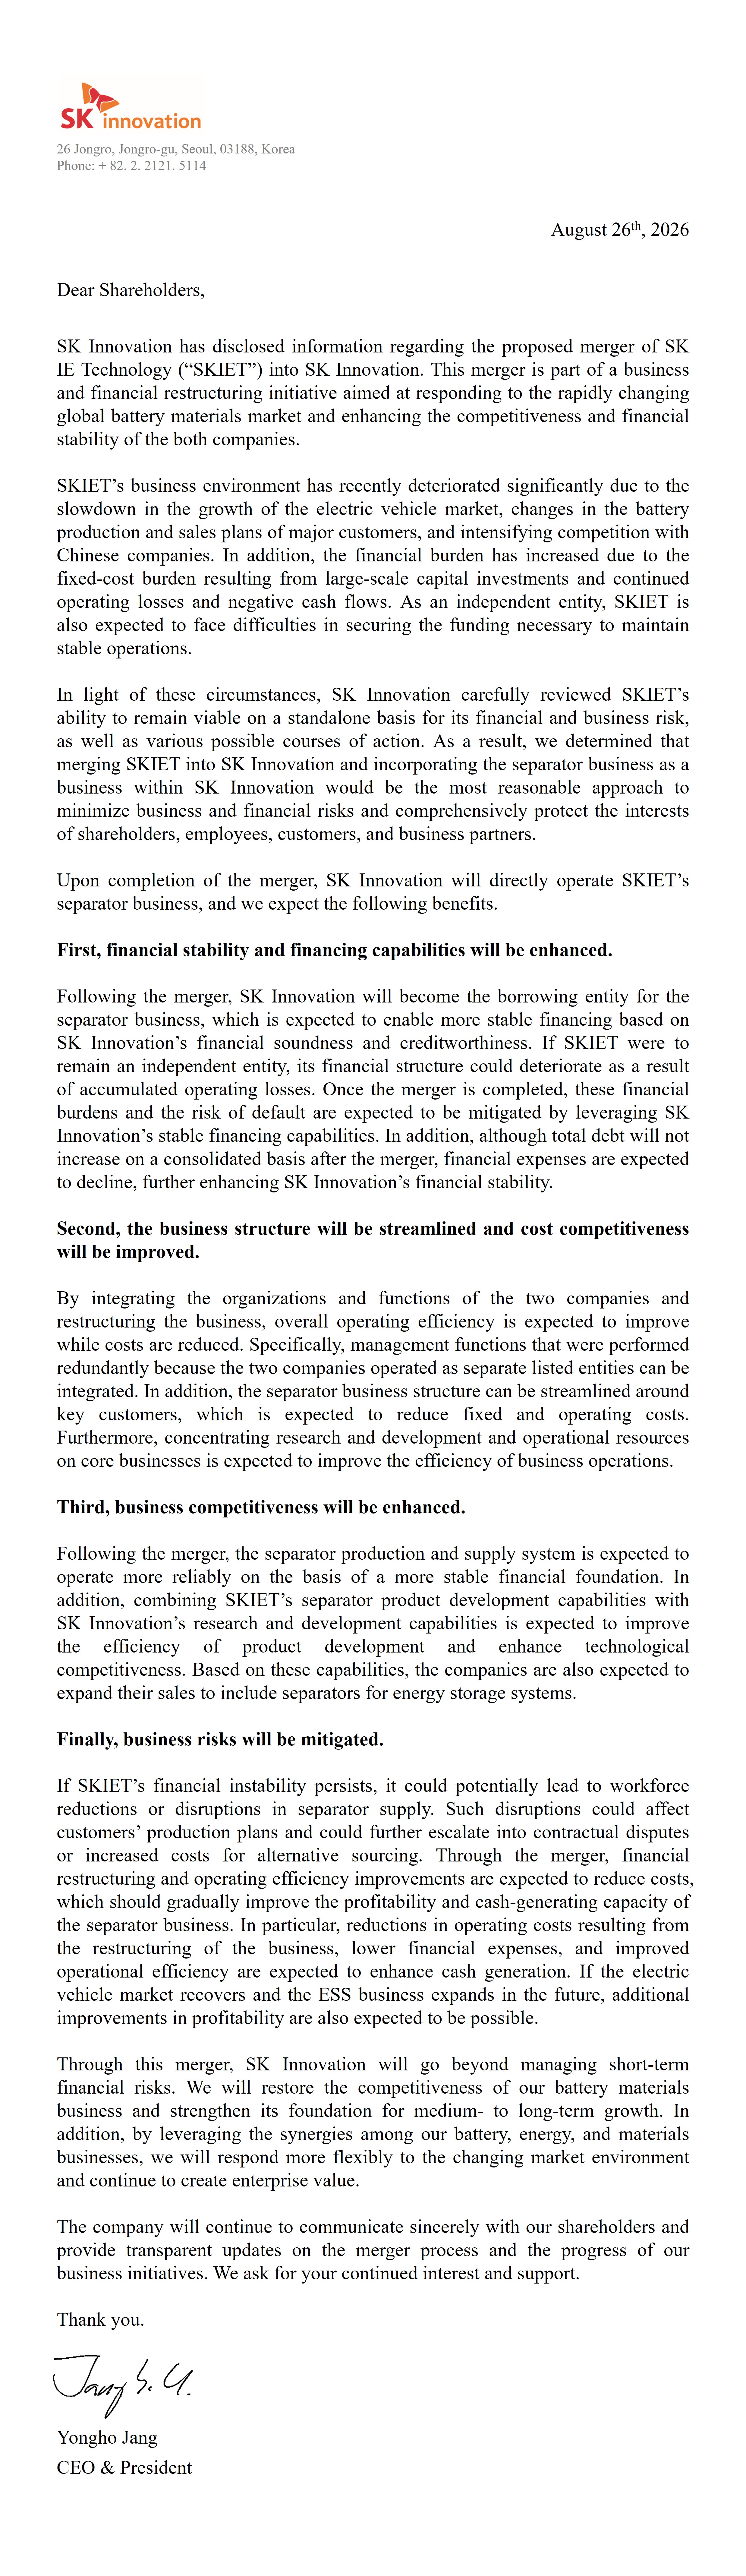
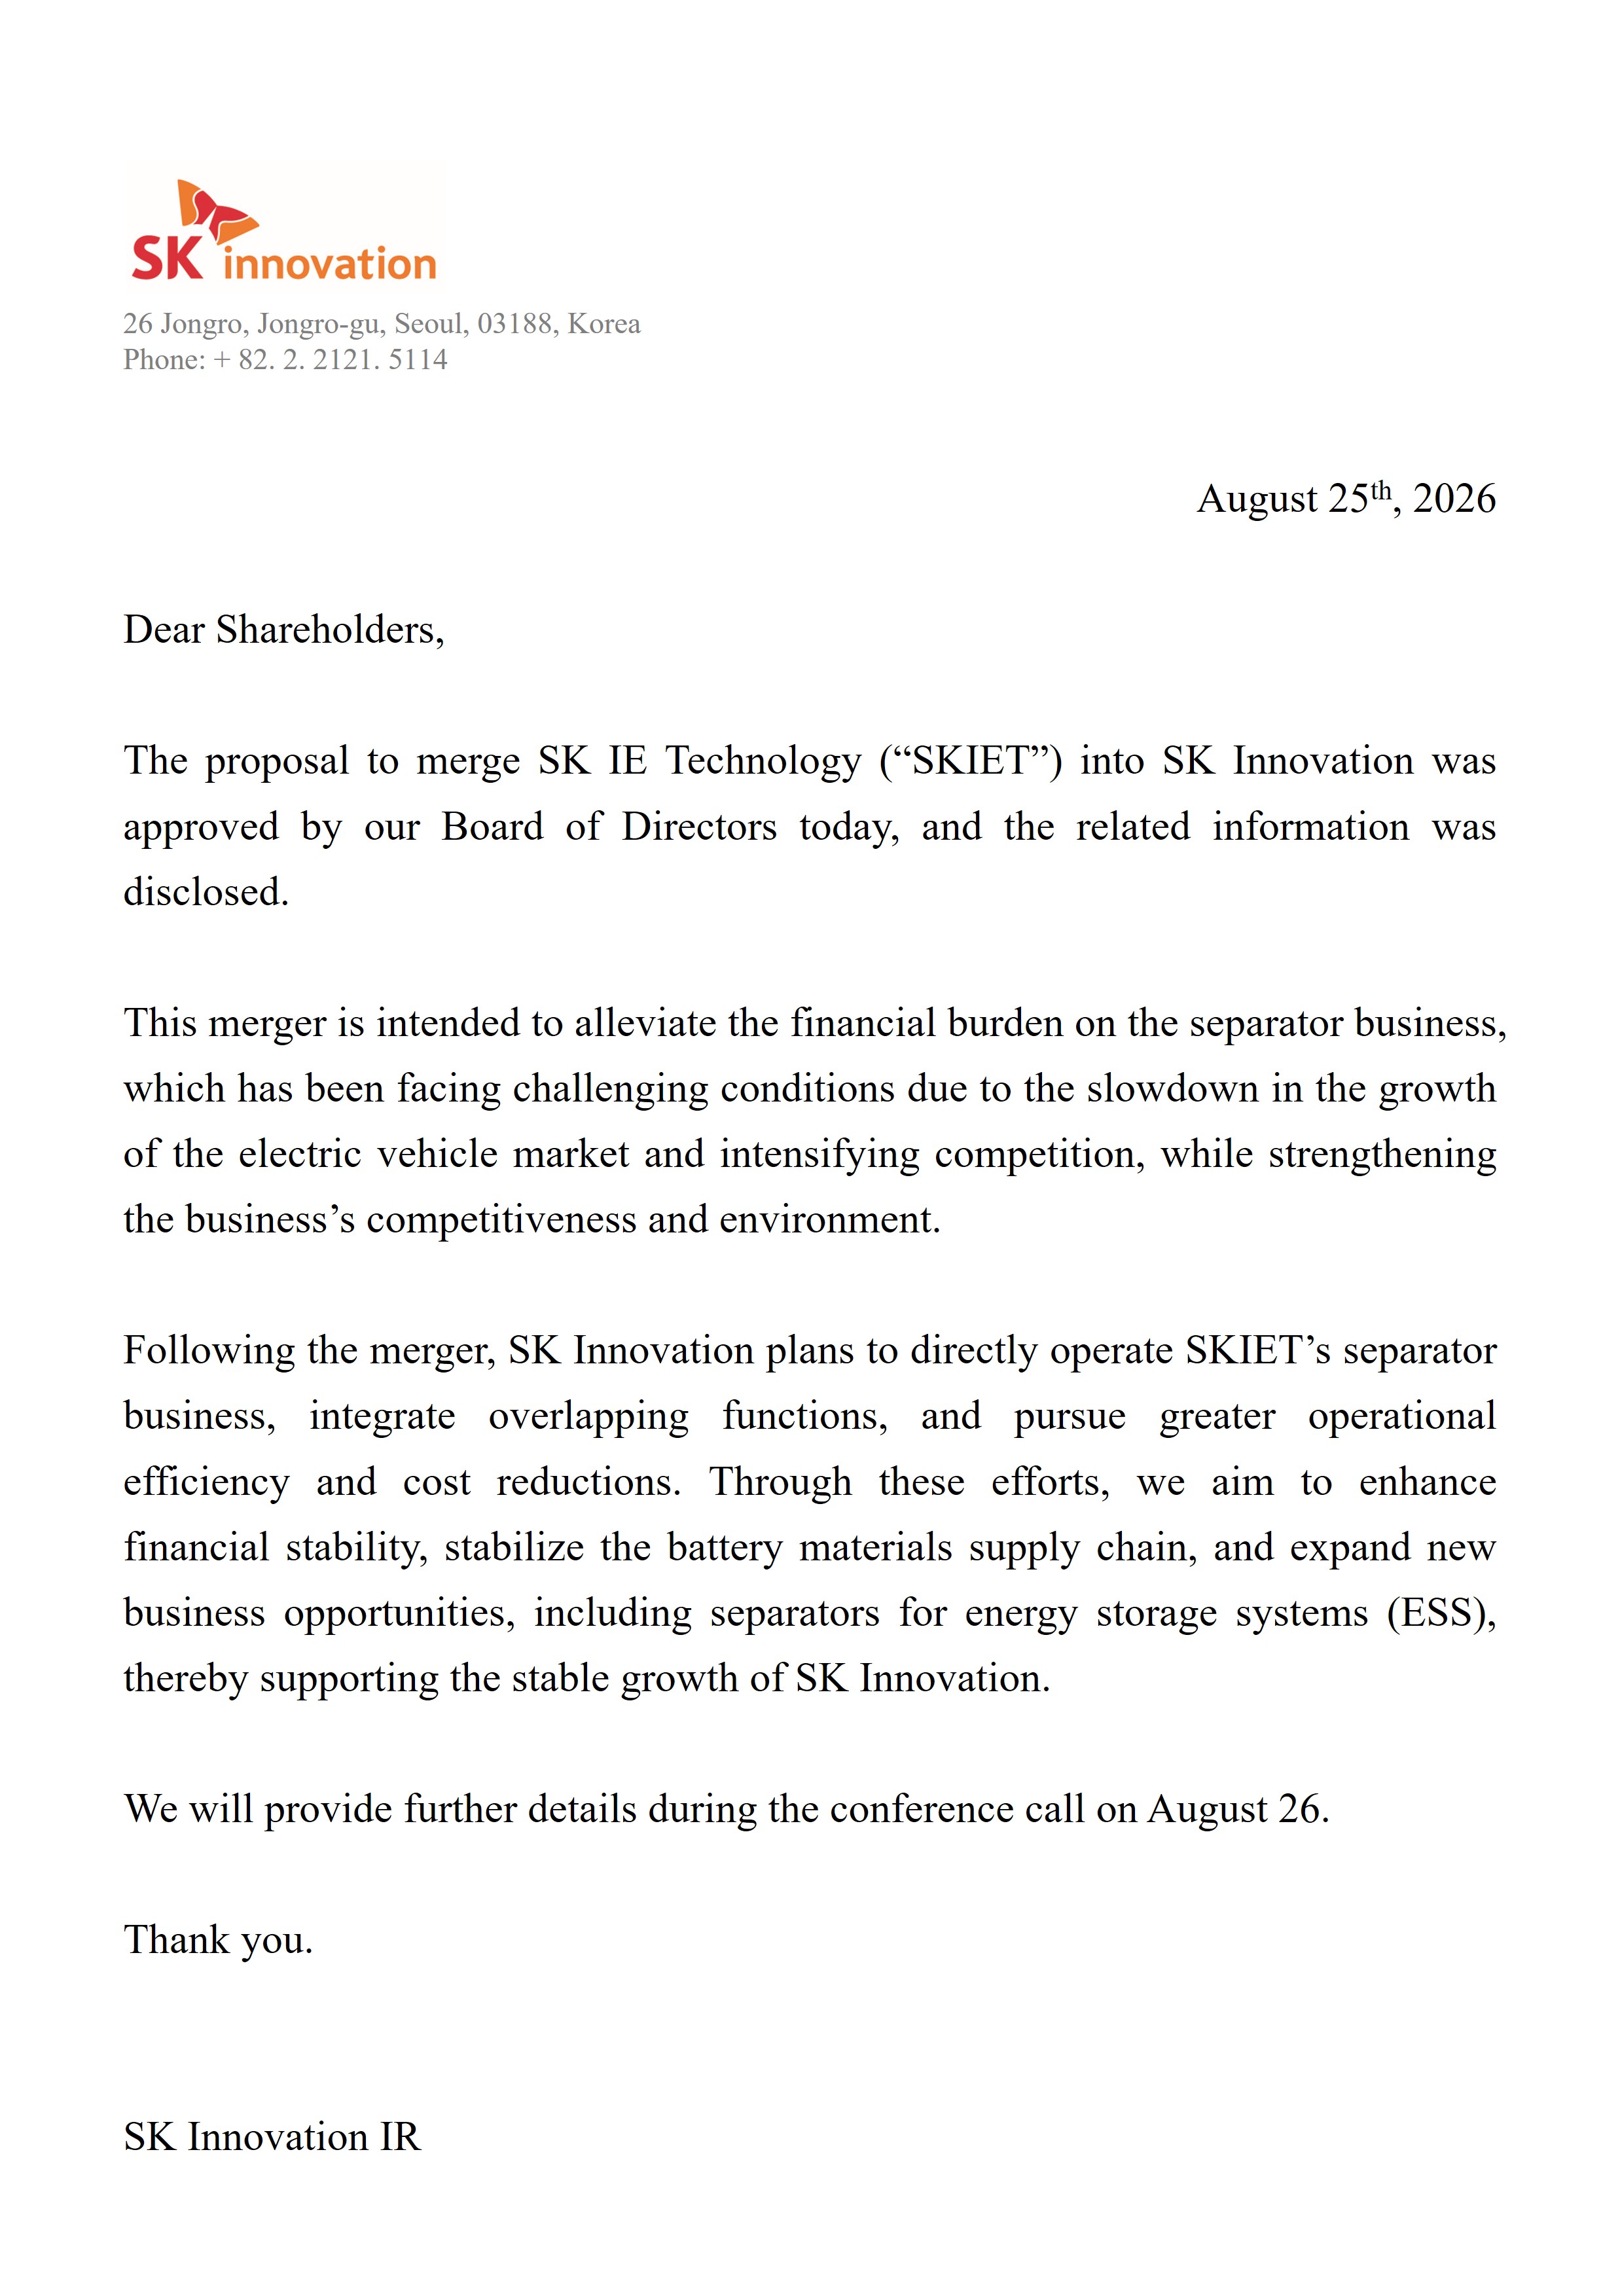
Sign UpDisclosures filed with DART (material events and exchange disclosures), newest first, headlines as filed in Korean. The link opens the filing on DART. Press releases from the company's own website, newest first.


Prompts
Click prompts to add them under the company line, click again to take one out, then copy the result into your AI chat. Shared by Asian Century Stocks and Uncovered Thai Stocks. Thank you.
SK Innovation (ticker 096770), listed in South Korea.
Copied
ETFs Holding SK Innovation
Exchange-traded funds whose newest published daily portfolio holds one of the company's listings, largest weight first.
| ETF | Weight in ETF | Shares | Market value | As of |
|---|---|---|---|---|
| AVES | 0.42% | 75,429 | $ 5.981M | Nov 16, 2026 |
| DFEV | 0.13% | 36,738 | $ 2.966M | Nov 12, 2026 |
| DFAE | 0.04% | 51,107 | $ 4.126M | Nov 12, 2026 |
| DFEM | 0.04% | 48,684 | $ 3.93M | Nov 12, 2026 |
| AVXC | 0.04% | 2,356 | $ 186.807K | Nov 16, 2026 |
| DEXC | 0.04% | 1,201 | $ 96.95K | Nov 12, 2026 |
| NTSE | 0.03% | 281 | $ 17.212K | Jun 30, 2026 |
| AVEM | 0.03% | 116,102 | $ 9.206M | Nov 16, 2026 |
| DFAX | 0.02% | 34,745 | $ 2.805M | Nov 12, 2026 |
| DEHP | 0.01% | 744 | $ 60.059K | Nov 12, 2026 |