[기재정정]주식등의대량보유상황보고서(일반)
Bull 0
Bear 0
Routine
086520
|
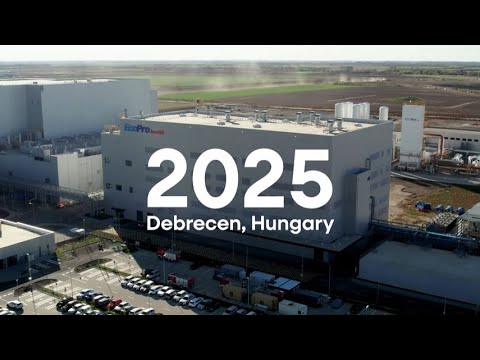
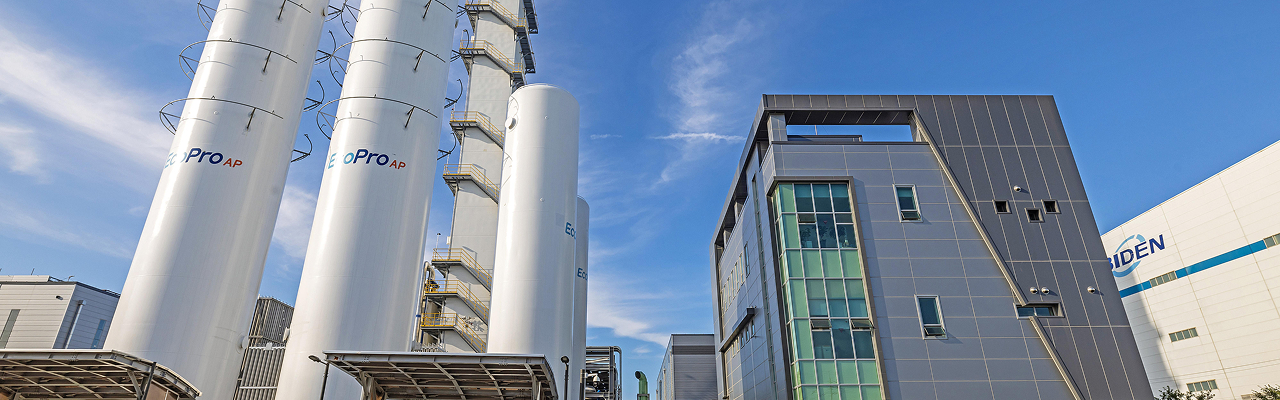
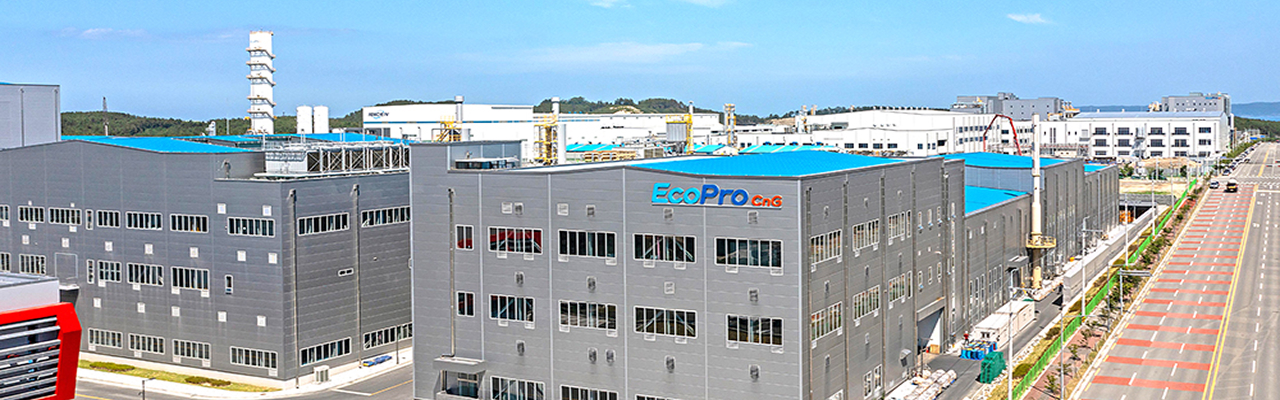
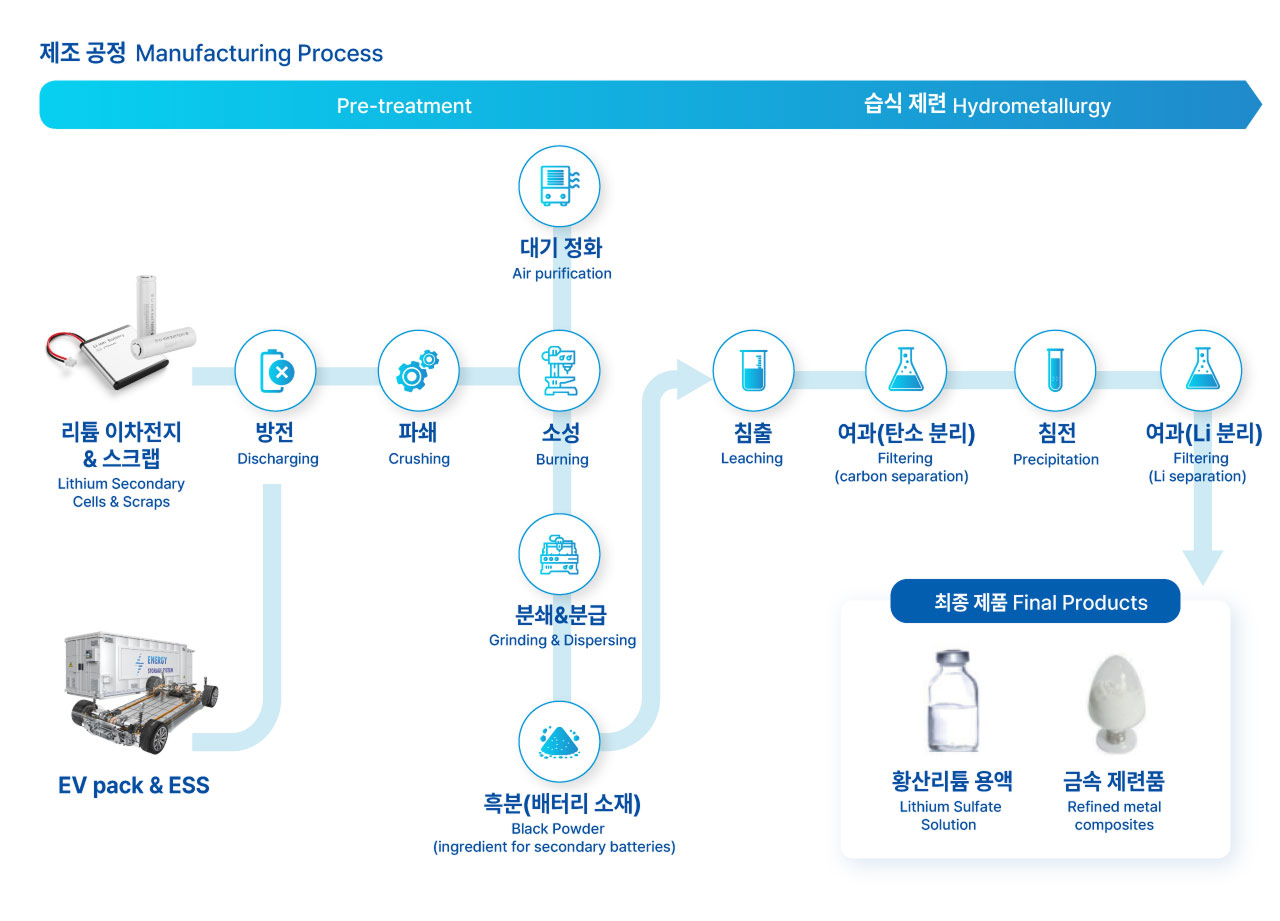
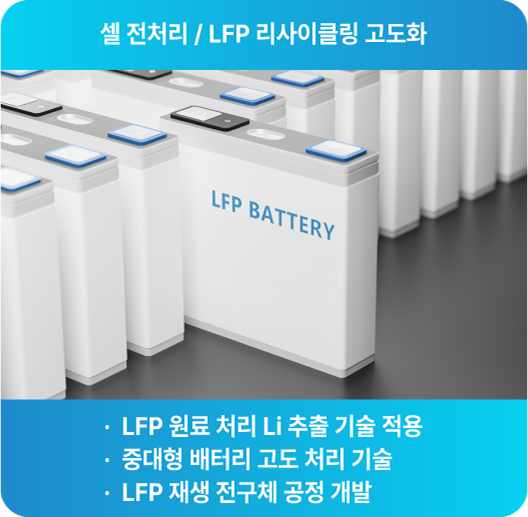
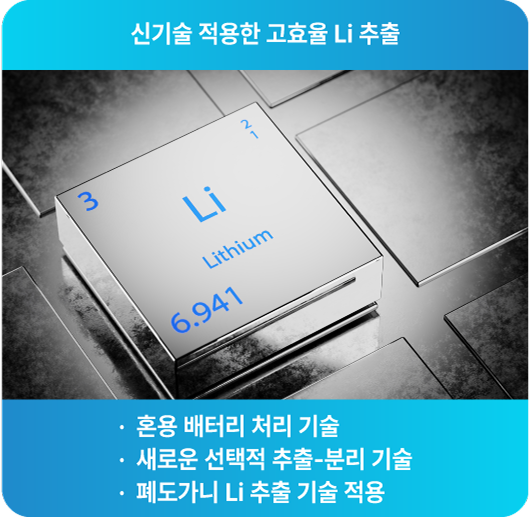
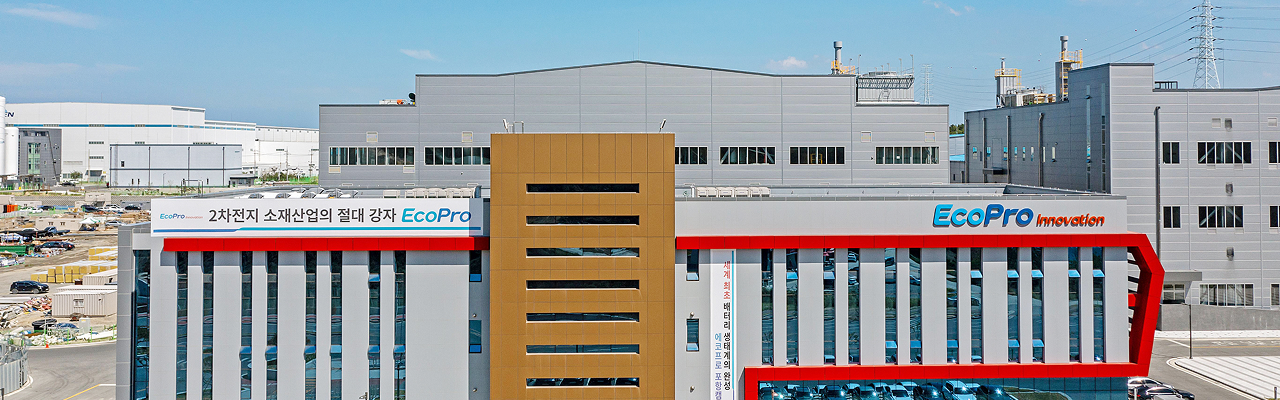
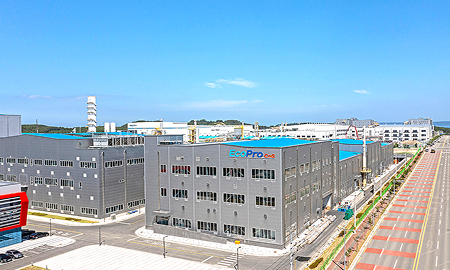
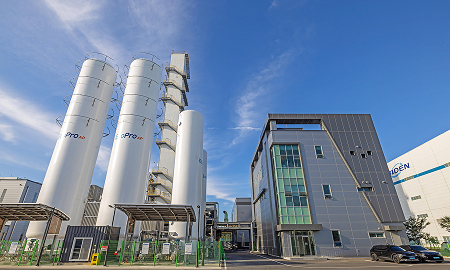
ECOPRO is a holding company for the Ecopro Group, operating through two main business segments: battery materials and environmental solutions. The battery materials segment develops and produces cathode active materials, precursors, and lithium hydroxide for lithium-ion batteries, while also managing battery recycling to recover valuable metals. This segment operates a closed-loop ecosystem integrating recycling, precursor production, and cathode manufacturing. Key subsidiaries include Ecopro BM, which produces high-nickel cathode materials, and Ecopro Materials, which manufactures precursors. Ecopro Innovation focuses on lithium supply and development, while Ecopro AP produces high-purity oxygen and nitrogen for the battery manufacturing process. Ecopro CN handles battery recycling. The environmental segment provides solutions for air quality and water treatment, including cleanroom chemical filters, fine dust reduction, greenhouse gas reduction, and industrial wastewater treatment, primarily serving the semiconductor, display, heavy industry, and chemical sectors. The group serves customers in South Korea, Europe, and North America, with production facilities in South Korea, Hungary, and Indonesia. Notable partnerships include joint ventures with Samsung SDI and Hengshui Gelin Xin Materials. Summarised from the company's own disclosures, fiscal year ended Mar 2026 |
Industry Specialty Chemicals | Homepage ecopro.co.kr |
| Sector Basic Materials | IR page ecopro.co.kr | |
|
Tags
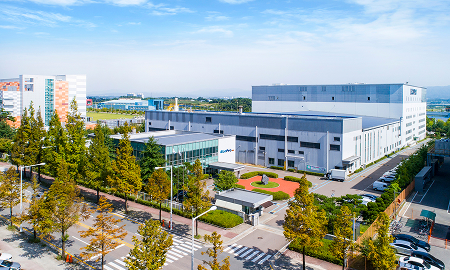
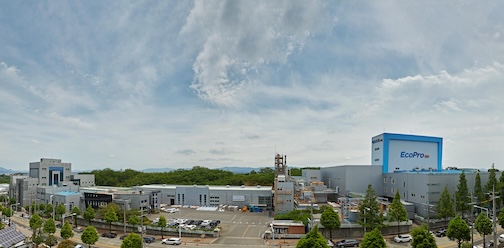
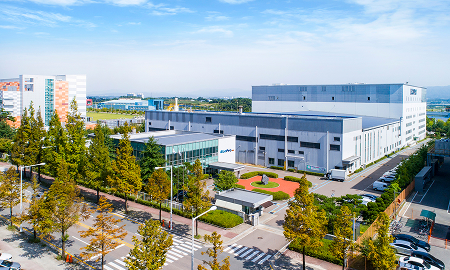
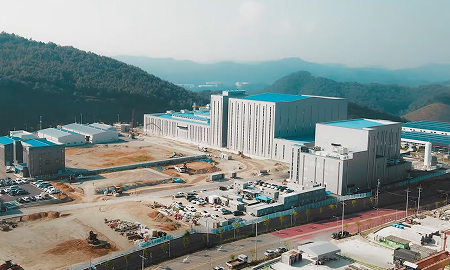
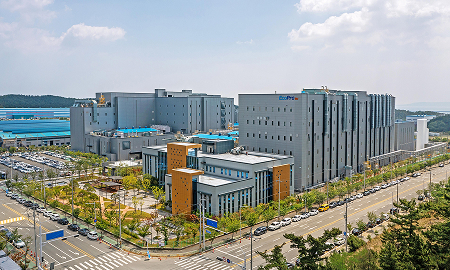
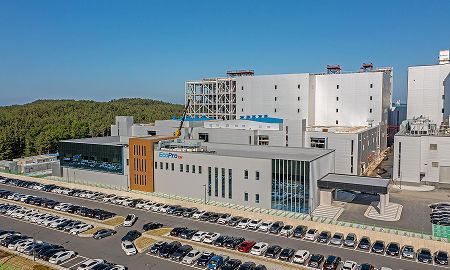
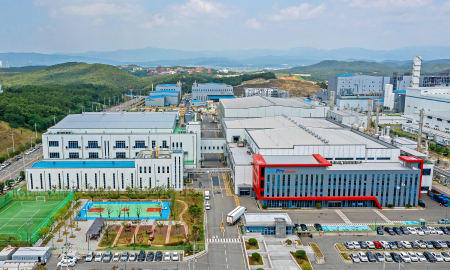
battery materials, cathode active materials, precursors, lithium hydroxide, battery recycling, environmental solutions, air quality control, water treatment, cleanroom filters, greenhouse gas reduction, Ecopro BM, Ecopro Materials, Ecopro Innovation, Ecopro AP, Ecopro CN, Ecopro HN, Ecopro IM, Ecopro Battery Pohang Campus
|
Press page — |
Metrics
| Valuation | |
|---|---|
| Market cap | ₩ 23.489T |
| Market cap (USD) | $ 17.287B |
| P/E | 167.63 |
| PEG | — |
| P/BV | 10.54 |
| P/S | 7.09 |
| P/OCF | 242.07 |
| P/FCF | -43.00 |
| Dividend yield | — |
| Turnover / mcap | — |
| Returns | |
|---|---|
| ROE | -8.4% |
| ROI | -7.6% |
| ROIC | 8.2% |
| Profit margin | -4.4% |
| Growth | |
|---|---|
| Revenue growing | No |
| Profits growing | No |
| Revenue up 3y | No |
| Revenue up 5y | No |
| Earnings growth 3y (net profit CAGR) | — |
| Quality | |
|---|---|
| Profitable | No |
| Margin expanding | Yes |
| Buying back stock | No |
| Diluting (TTM) | No |
| Debt/Equity | — |
| Podcast bulls (TTM) | Sign up |
| Podcast bears (TTM) | Sign up |
| Podcast sentiment (TTM) | Sign up |
| Podcast sentiment % (TTM) | Sign up |
| News sentiment (TTM) | — |
| Quality score | -58.8% |
| Insiders | |
|---|---|
| Buys, 1w | Sign up |
| Buys, 1m | Sign up |
| Buys, 1y | Sign up |
| Sells, 1w | Sign up |
| Sells, 1m | Sign up |
| Sells, 1y | Sign up |
Sign up to see this company's insider trades
| Figure | FY 2025 | FY 2024 | FY 2023 | FY 2022 | FY 2021 | FY 2020 | FY 2019 | FY 2018 | FY 2017 | FY 2016 | FY 2015 | FY 2014 | FY 2013 |
|---|---|---|---|---|---|---|---|---|---|---|---|---|---|
| Revenue | 3.413T | 3.128T | 7.26T | 5.64T | 1.504T | 946.81B | 702.273B | 669.407B | 329.012B | 170.483B | 107.266B | 83.224B | 59.581B |
| Net profit | -149.774B | -205.951B | 51.017B | 36.064B | 240.339B | 23.688B | 21.284B | 39.347B | -6.847B | -8.812B | 189.521M | 1.496B | -8.002B |
| Free cash flow | -447.398B | -1.093T | -996.597B | -1.194T | -585.157B | — | -229.326B | -100.893B | -60.526B | -57.17B | -5.204B | 4.021B | 227.647M |
Filed figures
Lines the statements and their notes report beside the headline figures, read from the filings' XBRL as filed (no restatement applied), with figures computed from one filing's own lines. Cash-flow lines carry their cash direction: an outflow is negative. Each period links to its filing; a figure's period, report date and tag are in its tooltip.
| Figure | Dec 2016 | Dec 2017 | Dec 2018 | Dec 2019 | Dec 2020 | Dec 2021 | Dec 2022 | Dec 2023 | Dec 2024 | Dec 2025 |
|---|---|---|---|---|---|---|---|---|---|---|
| Balance sheet detail | ||||||||||
| Trade receivables (KRW) | 36.2B | 48.5B | 86.6B | 78B | 107B | 286B | 952B | 813B | 248B | 248B |
| ↳ YoY growth | +54.9% | +34.1% | +78.5% | -10.0% | +37.1% | +167.1% | +233.5% | -14.6% | -69.5% | -0.1% |
| ↳ 5y CAGR | +44.4% | +37.6% | +35.5% | +51.2% | +81.4% | +56.5% | +26.1% | +18.3% | ||
| Borrowings, current (KRW) | 77.6B | — | — | — | — | 533B | 1.07T | 1.8T | 1.62T | 2.28T |
| Borrowings, non-current (KRW) | 59B | — | — | — | — | 509B | 557B | 818B | 1.58T | 1.48T |
| Lease liabilities (KRW) | — | — | — | 2.52B | 1.96B | 2.17B | 3.67B | 7.63B | 8.14B | 6.17B |
| Cash and deposits (KRW) | 21.6B | 22.7B | 15.7B | 34.6B | 136B | 292B | 356B | 1.12T | 954B | 1.19T |
| Intangible assets (KRW) | 20.3B | 19.6B | 16.5B | 16.6B | 17B | 622B | 421B | 415B | 409B | 431B |
| Right-of-use assets (KRW) | — | — | — | 2.61B | 2.02B | 2.31B | 4.12B | 7.38B | 8.22B | 5.86B |
| Net debt (borrowings + leases - cash) (KRW) | 115B | — | — | — | — | 753B | 1.27T | 1.51T | 2.26T | 2.58T |
| Cash flow detail | ||||||||||
| Operating cash flow (KRW) | 3.74B | 23.7B | 12.3B | -15B | 159B | -145B | -519B | 80.9B | 489B | 339B |
| Purchases of property, plant and equipment (KRW) | -60.9B | -84.2B | -113B | -214B | — | -440B | -676B | -1.08T | -1.58T | -786B |
| Purchases of intangible assets (KRW) | -2.09B | -2.12B | -709M | -1.66B | — | -1.7B | -2.28B | -671M | -7.36B | -25.6B |
| Dividends paid (cash effect) (KRW) | — | -51.1B | -52.7B | -59.6B | — | -6.56B | -10.2B | -12.5B | — | -13.2B |
| Share buybacks (cash effect) (KRW) | — | — | — | -4.94B | — | -2.14B | -2.33B | -18.9B | — | -8.53B |
| Interest paid (cash effect) (KRW) | -3.47B | -2.94B | -8.64B | -8.77B | — | -9.59B | -50.2B | -95B | -117B | -135B |
| Income taxes paid (cash effect) (KRW) | -214M | -735M | -2.19B | -6.48B | -921M | -14.8B | -172B | -115B | -82.3B | -35.4B |
| Free cash flow (OCF - PPE - intangibles) (KRW) | -59.3B | -62.6B | -102B | -231B | — | -587B | -1.2T | -997B | -1.1T | -473B |
| Income detail | ||||||||||
| Total comprehensive income (KRW) | -7.78B | -3.86B | 40.2B | 42.7B | 58.3B | 278B | 205B | 140B | -192B | -101B |
| Comprehensive income to owners (KRW) | -9.31B | -7.3B | 34.3B | 25.2B | 28.4B | 242B | 23.2B | 50.8B | -152B | -148B |
| Reported | Mar 30, 2017 | Mar 30, 2020 | Mar 30, 2020 | Mar 30, 2020 | Mar 18, 2021 | Apr 17, 2024 | Apr 17, 2024 | Apr 17, 2024 | Mar 18, 2025 | Mar 18, 2026 |
Sign up to see institutional holdings
Sign UpPodcast Mentions
Sign up to see podcast mentions and sentiment
Sign UpDisclosures filed with DART (material events and exchange disclosures), newest first, headlines as filed in Korean. The link opens the filing on DART. Press releases from the company's own website, newest first.
 **

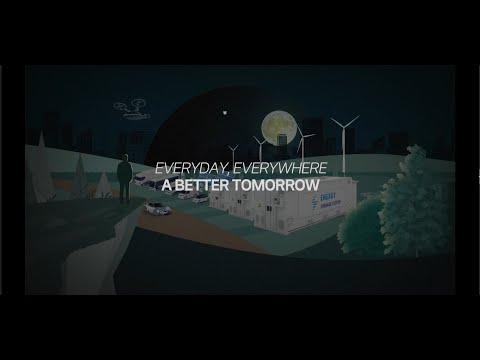
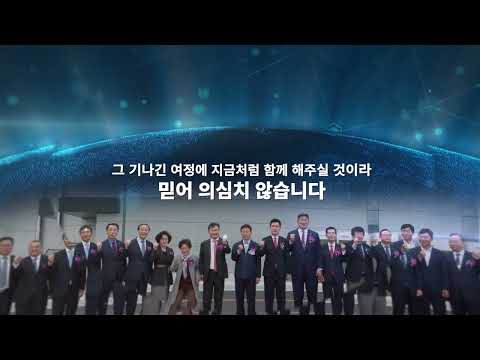
 Youtube 에코프로 유튜브 채널
 Instagram 에코프로 인스타그램
 Facebook 에코프로 페이스북














Prompts
Click prompts to add them under the company line, click again to take one out, then copy the result into your AI chat. Shared by Asian Century Stocks and Uncovered Thai Stocks. Thank you.
ECOPRO (ticker 086520), listed in South Korea.
Copied
ETFs Holding ECOPRO
Exchange-traded funds whose newest published daily portfolio holds one of the company's listings, largest weight first.
| ETF | Weight in ETF | Shares | Market value | As of |
|---|---|---|---|---|
| DFSE | 0.05% | 5,227 | $ 284.441K | Nov 12, 2026 |
| DFAE | 0.04% | 59,008 | $ 3.211M | Nov 12, 2026 |
| DEXC | 0.03% | 1,485 | $ 80.81K | Nov 12, 2026 |
| DFAX | 0.01% | 25,541 | $ 1.39M | Nov 12, 2026 |
| DFEM | 0.01% | 17,142 | $ 932.828K | Nov 12, 2026 |
| AVEM | 0.01% | 26,665 | $ 1.361M | Nov 16, 2026 |
| AVXC | 0.00% | 44 | $ 2,245.66 | Nov 16, 2026 |