[기재정정]거래처와의거래중단
Bull 0
Bear 5
Legal
079550
|
LIG Defense&Aerospace is a South Korean defense and aerospace company that researches, develops, and manufactures advanced weapon systems. The company operates through five main business segments: Precision Guided Munition, Intelligence, Surveillance and Reconnaissance, Command, Control, Communication, Computer, Cyber Security and Intelligence, Avionics and Drones, and Electronic Warfare. Its product portfolio includes air-to-surface and surface-to-air missiles, torpedoes, search and track radars, electronic-optical equipment, communication terminals, ship combat systems, and unmanned systems. The company serves government defense agencies, with the Defense Acquisition Program Administration and Agency for Defense Development as primary customers, and exports to markets in the Middle East, South America, and Asia. It holds a stake in Ghost Robotics Corporation through its subsidiary LNGR LLC to access the U.S. defense market. The company was founded in 1976 under the name Geumseong Precision Industry and later became a wholly owned defense specialist after restructuring in 2009. Summarised from the company's own disclosures, fiscal year ended Mar 2026 |
Industry Aerospace & Defense | Homepage ligdefenseaerospace.com |
| Sector Industrials | IR page ligdefenseaerospace.com | |
|
Tags
precision-guided munitions, missiles, torpedoes, radars, electronic warfare, avionics, unmanned systems, cyber security, combat systems, defense electronics, LIG Precision Technology, LNGR LLC, Ghost Robotics Corporation, Blanc de Ligeel, Firehawk, PGM, ISR, C4I, AEW
|
Press page — |
Metrics
| Valuation | |
|---|---|
| Market cap | ₩ 15.224T |
| Market cap (USD) | $ 11.205B |
| P/E | 52.78 |
| PEG | 1.94 |
| P/BV | 9.54 |
| P/S | 3.22 |
| P/OCF | -14.39 |
| P/FCF | -11.82 |
| Dividend yield | — |
| Turnover / mcap | — |
| Returns | |
|---|---|
| ROE | 19.2% |
| ROI | 17.7% |
| ROIC | 19.1% |
| Profit margin | 5.9% |
| Growth | |
|---|---|
| Revenue growing | Yes |
| Profits growing | Yes |
| Revenue up 3y | Yes |
| Revenue up 5y | Yes |
| Earnings growth 3y (net profit CAGR) | 27.3% |
| Quality | |
|---|---|
| Profitable | Yes |
| Margin expanding | No |
| Buying back stock | No |
| Diluting (TTM) | No |
| Debt/Equity | — |
| Podcast bulls (TTM) | Sign up |
| Podcast bears (TTM) | Sign up |
| Podcast sentiment (TTM) | Sign up |
| Podcast sentiment % (TTM) | Sign up |
| News sentiment (TTM) | — |
| Quality score | 23.5% |
| Insiders | |
|---|---|
| Buys, 1w | Sign up |
| Buys, 1m | Sign up |
| Buys, 1y | Sign up |
| Sells, 1w | Sign up |
| Sells, 1m | Sign up |
| Sells, 1y | Sign up |
Sign up to see this company's insider trades
| Figure | FY 2025 | FY 2024 | FY 2023 | FY 2022 | FY 2021 | FY 2020 | FY 2019 | FY 2018 | FY 2017 | FY 2016 | FY 2015 | FY 2014 | FY 2013 |
|---|---|---|---|---|---|---|---|---|---|---|---|---|---|
| Revenue | 4.307T | 3.276T | 2.309T | 2.221T | 1.822T | 1.6T | 1.453T | 1.478T | 1.761T | 1.861T | 1.904T | 1.4T | 1.208T |
| Net profit | 253.356B | 221.712B | 174.962B | 122.94B | 105.056B | 57.882B | 3.185B | 4.458B | -8.628B | 77.051B | 83.022B | 50.554B | 53.775B |
| Free cash flow | -754.085B | 454.985B | 407.874B | 410.639B | 103.006B | 160.174B | 119.766B | -125.119B | -130.625B | -184.585B | -16.011B | 21.599B | 117.276B |
Filed figures
Lines the statements and their notes report beside the headline figures, read from the filings' XBRL as filed (no restatement applied), with figures computed from one filing's own lines. Cash-flow lines carry their cash direction: an outflow is negative. Each period links to its filing; a figure's period, report date and tag are in its tooltip.
| Figure | Dec 2016 | Dec 2017 | Dec 2018 | Dec 2019 | Dec 2020 | Dec 2021 | Dec 2022 | Dec 2023 | Dec 2024 | Dec 2025 |
|---|---|---|---|---|---|---|---|---|---|---|
| Balance sheet detail | ||||||||||
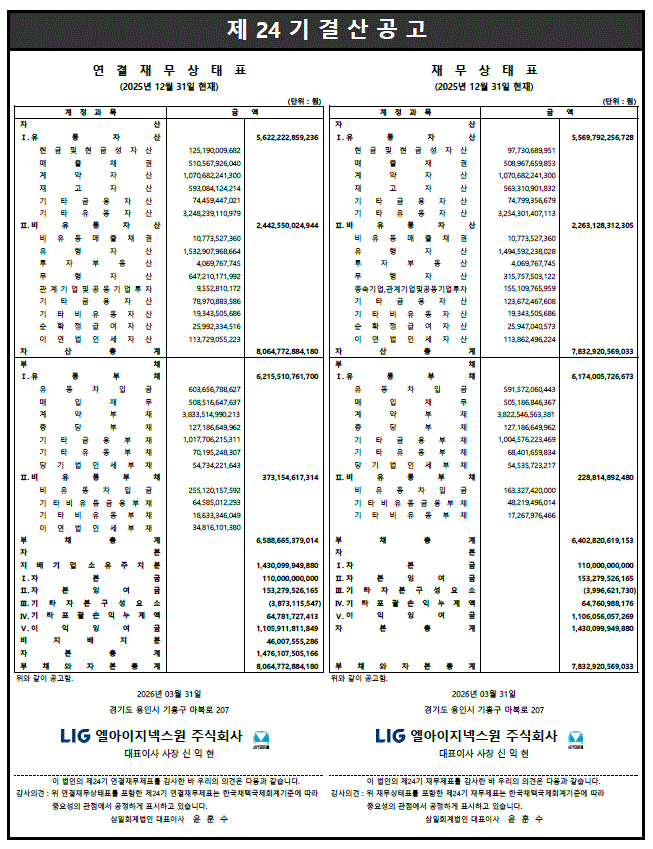
| Trade receivables (KRW) | 182B | 259B | 341B | 125B | 151B | 129B | 187B | 276B | 364B | 511B |
| ↳ YoY growth | +13.1% | +42.5% | +31.6% | -63.4% | +21.1% | -14.4% | +44.6% | +47.5% | +32.0% | +40.1% |
| ↳ 5y CAGR | +54.2% | +16.0% | -1.2% | -6.6% | -6.3% | -4.1% | +23.9% | +27.6% | ||
| Borrowings, current (KRW) | 257B | 271B | 298B | 213B | 158B | 221B | 235B | 183B | 203B | 604B |
| Borrowings, non-current (KRW) | 3.24B | 238B | 337B | 411B | 491B | 318B | 94.7B | 19.8B | 188B | 255B |
| Cash and deposits (KRW) | 12.3B | 89.3B | 53.3B | 28.7B | 51B | 74.5B | 253B | 445B | 547B | 125B |
| Intangible assets (KRW) | 81.7B | 73.5B | 76B | 97.6B | 127B | 148B | 171B | 188B | 629B | 647B |
| Net debt (borrowings + leases - cash) (KRW) | -9.05B | 421B | 582B | 596B | 599B | 464B | 76.6B | -243B | -156B | 734B |
| Cash flow detail | ||||||||||
| Operating cash flow (KRW) | -108B | -36.4B | -114B | 151B | 192B | 135B | 457B | 467B | 952B | -584B |
| Purchases of property, plant and equipment (KRW) | -76.9B | -94.2B | -11.1B | -31.2B | -31.9B | -32.2B | -45.9B | -59.4B | -497B | -170B |
| Purchases of intangible assets (KRW) | -16.1B | -13.3B | -21B | -32.2B | -42.8B | -41.8B | -28.8B | -23.7B | -70.3B | -76B |
| Dividends paid (cash effect) (KRW) | -20.7B | -20.7B | -11B | -11B | -13.2B | -19.5B | -26.2B | -32.7B | -42.5B | -52.3B |
| Share buybacks (cash effect) (KRW) | — | — | — | — | -8.52B | — | — | — | — | — |
| Interest paid (cash effect) (KRW) | -4.88B | -8.87B | -15B | -16B | -17.3B | -15.8B | -15.7B | -13.6B | -18.1B | -19.3B |
| Income taxes paid (cash effect) (KRW) | -24.7B | -15B | -2.8B | -5.04B | -10.1B | 1.07B | -791M | -30.9B | -41.7B | -37.9B |
| Free cash flow (OCF - PPE - intangibles) (KRW) | -201B | -144B | -146B | 87.6B | 117B | 61.2B | 382B | 384B | 385B | -830B |
| Income detail | ||||||||||
| Total comprehensive income (KRW) | 75.3B | -6.99B | 68.1B | -5.16B | 60.3B | 106B | 198B | 150B | 200B | 242B |
| Comprehensive income to owners (KRW) | 75.3B | -6.99B | 68.1B | -5.16B | 60.3B | 106B | 198B | 150B | 201B | 261B |
| Reported | Nov 14, 2017 | Apr 2, 2018 | Apr 3, 2020 | Apr 3, 2020 | Apr 27, 2021 | Mar 20, 2024 | Mar 20, 2024 | Mar 20, 2024 | Mar 21, 2025 | Mar 23, 2026 |
Sign up to see institutional holdings
Sign UpPodcast Mentions
Sign up to see podcast mentions and sentiment
Sign UpDisclosures filed with DART (material events and exchange disclosures), newest first, headlines as filed in Korean. The link opens the filing on DART. Press releases from the company's own website, newest first.





Prompts
Click prompts to add them under the company line, click again to take one out, then copy the result into your AI chat. Shared by Asian Century Stocks and Uncovered Thai Stocks. Thank you.
LIG Defense&Aerospace (ticker 079550), listed in South Korea.
Copied
ETFs Holding LIG Defense&Aerospace
Exchange-traded funds whose newest published daily portfolio holds one of the company's listings, largest weight first.
| ETF | Weight in ETF | Shares | Market value | As of |
|---|---|---|---|---|
| EMMF | 0.25% | 947 | $ 439.484K | Jun 30, 2026 |
| DFAE | 0.12% | 39,706 | $ 10.878M | Nov 12, 2026 |
| DGRE | 0.11% | 359 | $ 166.605K | Jun 30, 2026 |
| DEHP | 0.09% | 1,306 | $ 357.802K | Nov 12, 2026 |
| AVES | 0.06% | 3,403 | $ 903.92K | Nov 16, 2026 |
| DEXC | 0.06% | 571 | $ 156.435K | Nov 12, 2026 |
| DFEM | 0.03% | 11,063 | $ 3.031M | Nov 12, 2026 |
| AVXC | 0.03% | 431 | $ 114.484K | Nov 16, 2026 |
| AVEM | 0.02% | 23,838 | $ 6.332M | Nov 16, 2026 |
| DFAX | 0.02% | 7,395 | $ 2.026M | Nov 12, 2026 |