주요사항보고서(자기주식처분결정)
Bull 0
Bear 0
Routine
068760
|
Celltrionph is a pharmaceutical company that manufactures and sells chemical and biological drugs. The company produces oral solid dosage forms such as tablets and capsules, as well as prefilled syringes for biopharmaceuticals, operating production facilities in South Korea that hold GMP certifications from the US, EU, and Japan. It holds the exclusive domestic sales rights for a portfolio of biologic drugs developed by its parent company, Celltrion, including treatments for autoimmune diseases, oncology, and bone disorders. Celltrionph also develops its own chemical drug pipeline, featuring the liver disease treatment Godex, and provides contract manufacturing services for oral solid dosage forms and prefilled syringes to global partners. The company serves domestic and international markets, supplying products through pharmaceutical distributors and direct partnerships. Summarised from the company's own disclosures, fiscal year ended Mar 2026 |
Industry Drug Manufacturers - General | Homepage celltrionph.com |
| Sector Healthcare | IR page celltrionph.com/ko-kr/home/index | |
|
Tags
chemical drugs, biologics, biosimilars, oral solid dosage forms, prefilled syringes, contract manufacturing, autoimmune diseases, oncology, liver disease, diabetes, hypertension, Godex, Nesina, Actos, Amlozet, Rhemcim, Rhemcim SC, Uplimna, Stelara, Aptozuma, Truxima, Herzuma, Vegzelma, Stoboclo, Osenvelt, Omriclo, Celltrion, Hanseul Pharmaceutical
|
Press page — |
Metrics
| Valuation | |
|---|---|
| Market cap | — |
| Market cap (USD) | — |
| P/E | — |
| PEG | — |
| P/BV | — |
| P/S | — |
| P/OCF | — |
| P/FCF | — |
| Dividend yield | — |
| Turnover / mcap | — |
| Returns | |
|---|---|
| ROE | 9.3% |
| ROI | 8.9% |
| ROIC | 10.0% |
| Profit margin | 7.2% |
| Growth | |
|---|---|
| Revenue growing | Yes |
| Profits growing | Yes |
| Revenue up 3y | Yes |
| Revenue up 5y | No |
| Earnings growth 3y (net profit CAGR) | 14.3% |
| Quality | |
|---|---|
| Profitable | Yes |
| Margin expanding | Yes |
| Buying back stock | No |
| Diluting (TTM) | Yes |
| Debt/Equity | — |
| Podcast bulls (TTM) | Sign up |
| Podcast bears (TTM) | Sign up |
| Podcast sentiment (TTM) | Sign up |
| Podcast sentiment % (TTM) | Sign up |
| News sentiment (TTM) | — |
| Quality score | 53.8% |
| Insiders | |
|---|---|
| Buys, 1w | Sign up |
| Buys, 1m | Sign up |
| Buys, 1y | Sign up |
| Sells, 1w | Sign up |
| Sells, 1m | Sign up |
| Sells, 1y | Sign up |
Sign up to see this company's insider trades
| Figure | FY 2025 | FY 2024 | FY 2023 | FY 2022 | FY 2021 | FY 2020 | FY 2019 | FY 2018 | FY 2017 | FY 2016 | FY 2015 | FY 2014 | FY 2013 |
|---|---|---|---|---|---|---|---|---|---|---|---|---|---|
| Revenue | 536.4B | 477.835B | 388.794B | 386.04B | 398.738B | 233.568B | 173.513B | 146.88B | 135.86B | 104.811B | 74.732B | 66.744B | 52.657B |
| Net profit | 38.752B | 21.966B | 21.265B | 25.96B | 34.579B | 20.94B | 8.602B | -9.389B | 15.715B | -21.106B | 6.734B | -4.546B | 2.613B |
| Free cash flow | 70.266B | 51.646B | — | -7.943B | — | — | — | — | — | — | — | — | — |
Filed figures
Lines the statements and their notes report beside the headline figures, read from the filings' XBRL as filed (no restatement applied), with figures computed from one filing's own lines. Cash-flow lines carry their cash direction: an outflow is negative. Each period links to its filing; a figure's period, report date and tag are in its tooltip.
| Figure | Dec 2016 | Dec 2017 | Dec 2018 | Dec 2019 | Dec 2020 | Dec 2021 | Dec 2022 | Dec 2023 | Dec 2024 | Dec 2025 |
|---|---|---|---|---|---|---|---|---|---|---|
| Balance sheet detail | ||||||||||
| Trade receivables (KRW) | 80.7B | 123B | 133B | 139B | 140B | 172B | 186B | 222B | 213B | 220B |
| ↳ YoY growth | +88.6% | +53.0% | +7.5% | +4.6% | +1.2% | +22.8% | +7.7% | +19.5% | -4.1% | +3.5% |
| ↳ 5y CAGR | +30.8% | +28.5% | +26.8% | +16.4% | +8.5% | +10.8% | +8.9% | +9.4% | ||
| Other receivables (KRW) | — | — | — | — | — | — | 1.84B | 418M | 5.56B | 5.3B |
| Borrowings, current (KRW) | 49.7B | 96.1B | 113B | 123B | 135B | 141B | 139B | 154B | — | — |
| Borrowings, non-current (KRW) | 89B | 48.1B | 34.4B | 38.6B | 57.3B | 39B | 21.7B | 4.33B | 0.00 | — |
| Lease liabilities (KRW) | — | 0.00 | 0.00 | 208M | 587M | 938M | 459M | 4.38B | 17.3B | 19.3B |
| Cash and deposits (KRW) | 10.2B | 5.64B | 9.12B | 10.8B | 25.7B | 80.2B | 31.4B | 19.7B | 45.5B | 49.9B |
| Intangible assets (KRW) | 40.5B | 39.9B | 35.8B | 36.4B | 38.1B | — | 41.3B | 39.3B | 39.2B | 43.2B |
| Right-of-use assets (KRW) | — | 0.00 | 0.00 | 588M | 1.05B | 955M | 456M | 4.39B | 17.1B | 19.3B |
| Net debt (borrowings + leases - cash) (KRW) | 78.8B | 42.5B | 138B | 151B | 167B | 101B | 129B | 143B | -28.2B | — |
| Cash flow detail | ||||||||||
| Operating cash flow (KRW) | -26.2B | -10.2B | 14.3B | 27.9B | 36.2B | 93.2B | -4.05B | 8.76B | 56.6B | 86.4B |
| Purchases of property, plant and equipment (KRW) | — | — | — | — | — | — | -3.9B | -4.96B | -4.94B | -16.2B |
| Purchases of intangible assets (KRW) | — | — | — | — | — | — | -2.39B | -1.94B | -1.04B | -1.76B |
| Share buybacks (cash effect) (KRW) | -49M | -102M | — | — | — | — | -4.58B | -4.29B | -4.93B | -2.44B |
| Interest paid (cash effect) (KRW) | -6.02B | -5.48B | — | — | — | — | -6.03B | -8.26B | -7.16B | -5.9B |
| Income taxes paid (cash effect) (KRW) | 89.8M | -1.17B | 254M | 2.62B | -526M | — | 9.32B | -7.18B | -2.97B | -11.4B |
| Free cash flow (OCF - PPE - intangibles) (KRW) | — | — | — | — | — | — | -10.3B | 1.86B | 50.6B | 68.5B |
| Income detail | ||||||||||
| Total comprehensive income (KRW) | -21.1B | 15.7B | -9.19B | 9.11B | 20.6B | 34.2B | 26B | 21.3B | 22B | 38.8B |
| Comprehensive income to owners (KRW) | -21.1B | 15.7B | -9.19B | 9.11B | 20.6B | — | — | — | — | — |
| Reported | May 12, 2022 | May 12, 2022 | Mar 30, 2020 | Mar 30, 2020 | Mar 18, 2021 | Mar 18, 2024 | Mar 24, 2025 | Mar 24, 2025 | Mar 24, 2025 | Mar 16, 2026 |
Sign up to see institutional holdings
Sign UpPodcast Mentions
Sign up to see podcast mentions and sentiment
Sign UpDisclosures filed with DART (material events and exchange disclosures), newest first, headlines as filed in Korean. The link opens the filing on DART. Press releases from the company's own website, newest first.
영업(잠정)실적(공정공시)
Bull 5
Bear 0
Results
보도자료
Bull 2
Bear 0
Product/operations
셀트리온제약의 주요 소식
셀트리온제약, ‘유플라이마’ 40mg PFS-S 국내 출시... 제형 확대·약가 경쟁력으로 자가면역질환 치료 선택지 넓혀
등록일2026.11.02
- 11****월 1일 건강보험 급여 신규 등재… 동일 성분 40mg 제품 중 최저 수준 약가 책정
- 기존 펜 타입에 PFS-S 제형 추가… 주사 후 바늘을 감싸는 안전장치 적용
- 2027****년 20mg PFS 출시 계획… 오리지널과 동일한 함량·제형 갖춘 국내 라인업 완성 추진
[2026****년 11월 2일] 셀트리온제약은 자가면역질환 치료제 ‘유플라이마’(성분명 아달리무맙)의 40mg 프리필드시린지(Prefilled Syringe with Safety Guard, 이하 PFS-S) 제품이 11월 1일 건강보험 급여에 신규 등재되면서 국내 판매를 시작했다고 2일 밝혔다.
이번 출시로 셀트리온제약은 기존 펜 타입 중심의 유플라이마 제품군에 안전장치를 갖춘 PFS-S를 추가하게 됐다. PFS는 약물이 미리 충전된 주사기이며, PFS-S는 PFS에 주사 후 바늘을 감싸는 안전장치를 적용한 제품이다. 사용 후 주사침 노출을 줄이도록 설계돼 있어 의료진의 안전한 취급을 돕는다.
유플라이마 40mg PFS-S의 약가는 1회 투여분 기준 220,390원으로, 국내에서 급여가 적용되는 동일 성분 40mg 제품 중 최저 수준이다. 이를 통해 장기간 치료가 필요한 환자에게 경제적인 치료 옵션을 제공하는 한편, 기존 펜 타입과 함께 환자의 상태와 투여 환경, 선호도 등을 고려한 제품 선택을 지원할 수 있다.
셀트리온제약은 이번 40mg PFS-S 출시에 이어 2027년 유플라이마 20mg PFS도 국내에 선보일 계획이다. 저용량 제품까지 출시될 경우 오리지널 의약품이 보유한 함량과 제형을 모두 갖춘 국내 제품 라인업을 구축하게 된다. 이를 통해 환자의 상태나 필요한 투여 용량에 따라 의료진이 적합한 제품을 선택할 수 있도록 처방 기반을 넓힐 예정이다.
셀트리온제약 관계자는 “장기간 치료를 이어가는 환자에게 있어 약제의 경제성과 함께 투여 방식, 사용 후 취급까지 고려한 제품 선택이 중요하다”며 “유플라이마의 약가 경쟁력과 다양한 제품 구성을 바탕으로 환자와 의료진의 치료 수요에 대응해 나가겠다”고 말했다. (이상)
-
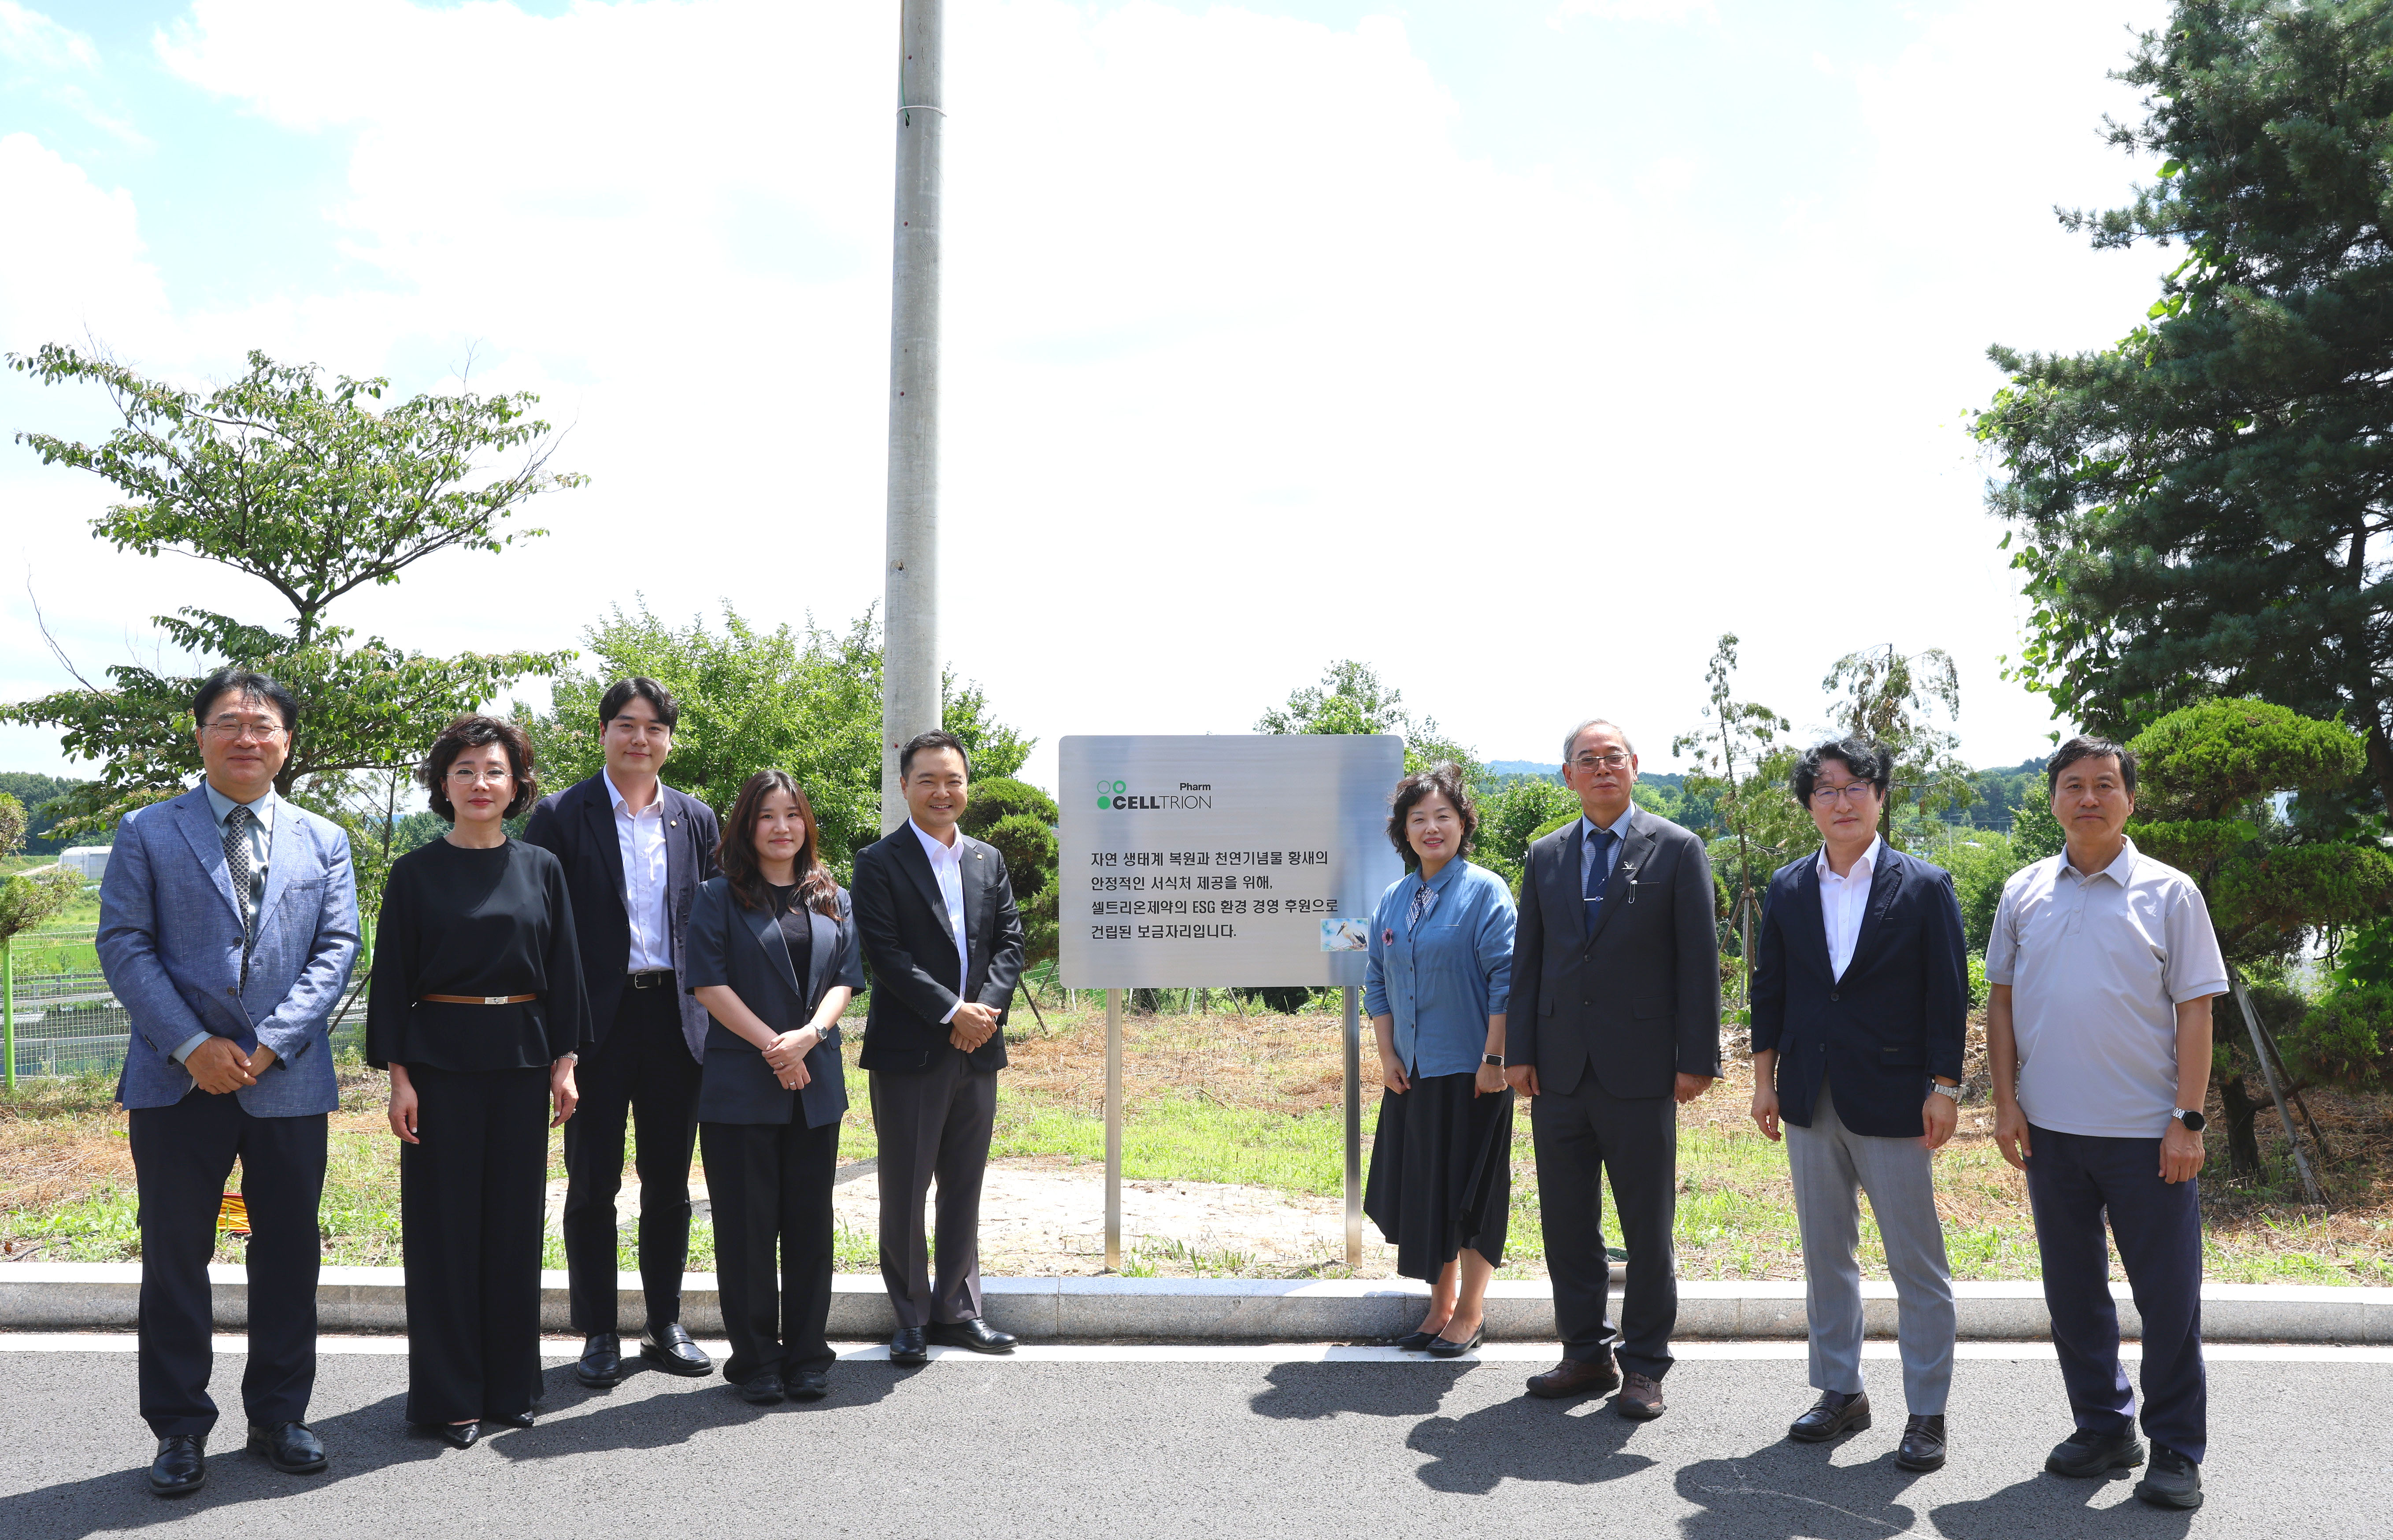
이전글 셀트리온제약, 멸종위기종 보호 위한 생물다양성 보전 활동 전개... 자연과 공존하는 ESG 경영 강화
-
다음글 다음글이 없습니다.
셀트리온제약
충청북도 청주시 청원구 오창읍 2산단로 82 TEL) 043-717-7000 FAX) 043-715-7095
Copyright © 2020 Celltrion Pharm, Inc. All rights reserved.
x 본 사이트에서 제공하는 제품 정보는 의료 정보용으로만 사용되며 홍보 또는 판매를 목적으로 하지 않습니다.
의약품 관련 자세한 사항은 의료 전문가에게 문의하십시오.
 셀트리온제약_CI.jpg


 제26기 정기주주총회 서면위임장.pdf
Prompts
Click prompts to add them under the company line, click again to take one out, then copy the result into your AI chat. Shared by Asian Century Stocks and Uncovered Thai Stocks. Thank you.
Celltrionph (ticker 068760), listed in South Korea.
Copied
ETFs Holding Celltrionph
Exchange-traded funds whose newest published daily portfolio holds one of the company's listings, largest weight first.
| ETF | Weight in ETF | Shares | Market value | As of |
|---|---|---|---|---|
| AVEE | 0.05% | 2,183 | $ 65.061K | Nov 16, 2026 |
| DFEM | 0.00% | 13,961 | $ 422.361K | Nov 12, 2026 |
| DFAE | 0.00% | 5,944 | $ 179.823K | Nov 12, 2026 |
| DEXC | 0.00% | 141 | $ 4,265.66 | Nov 12, 2026 |
| DFAX | 0.00% | 4,400 | $ 133.113K | Nov 12, 2026 |
| AVEM | 0.00% | 9,698 | $ 289.035K | Nov 16, 2026 |
| AVXC | 0.00% | 314 | $ 9,358.33 | Nov 16, 2026 |