임원ㆍ주요주주특정증권등소유상황보고서
Bull 0
Bear 0
Routine
068270
|
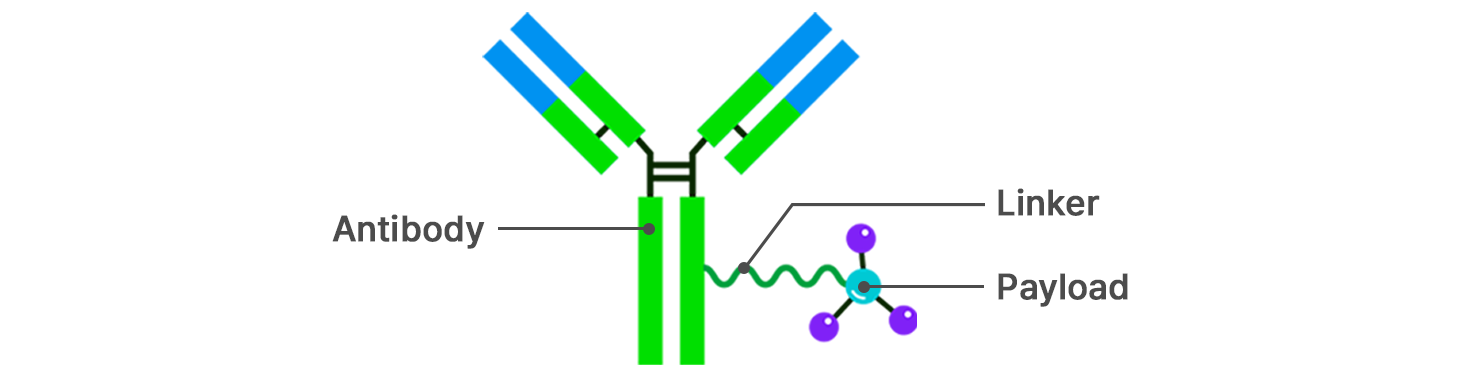
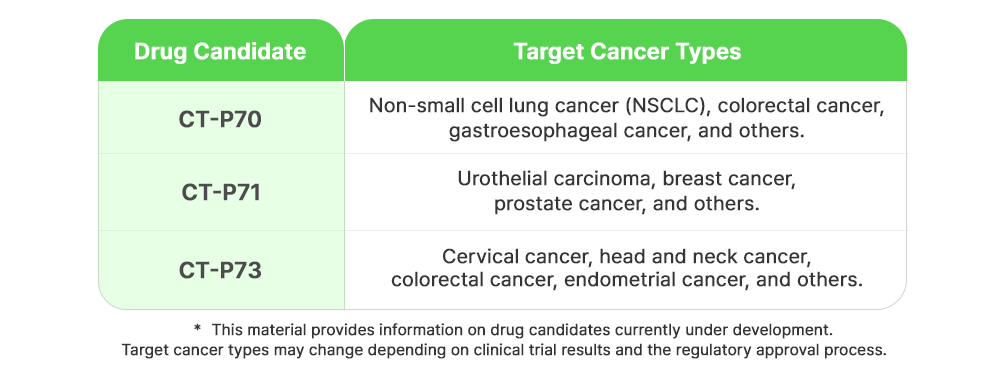
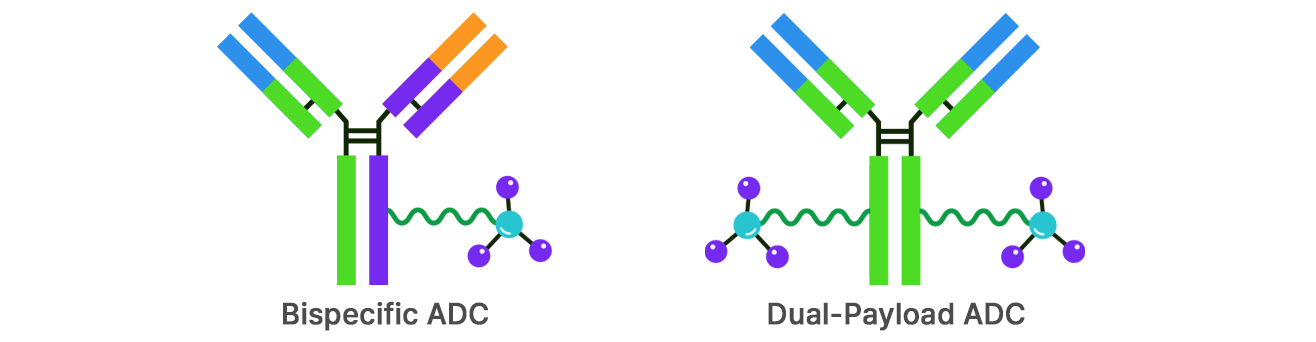
Celltrion is a global biopharmaceutical company that develops and commercializes antibody biosimilars and novel biologic drugs for the treatment of autoimmune diseases and oncology. The company's portfolio includes Remsima, Truxima, Herzuma, Yuflyma, Vezelma, Omlyclo, Eydenzelt, Steqeyma, Aptozma, and Stovoclo/Oscenbelt, alongside the novel drug Zymfentra. Celltrion is expanding its pipeline into antibody-drug conjugates (ADCs) and bispecific antibodies, with candidates such as CT-P70, CT-P71, CT-P72, and CT-P73 in clinical trials. The company maintains integrated operations spanning research and development, manufacturing, and direct global sales, utilizing production facilities in Korea and the United States. Following the merger with Celltrion Healthcare in 2023, Celltrion manages its own distribution network in Europe, the United States, Asia, and Latin America. The group also includes Celltrion Pharm, which focuses on small-molecule generics and improved new drugs, and operates contract manufacturing services. Celltrion holds strategic partnerships with various biotechnology firms for next-generation modality development. Summarised from the company's own disclosures, fiscal year ended Mar 2026 |
Industry Biotechnology | Homepage celltrion.com |
| Sector Healthcare | IR page celltrion.com/ko-kr/investment/ir | |
|
Tags
biosimilars, antibody-drug conjugates, autoimmune diseases, oncology, small-molecule drugs, contract manufacturing, direct sales, biologics, Remsima, Truxima, Herzuma, Yuflyma, Vezelma, Omlyclo, Eydenzelt, Steqeyma, Aptozma, Stovoclo, Oscenbelt, Zymfentra, Celltrion Healthcare, Celltrion Pharm, CT-P13, CT-P10, CT-P6, CT-P17, CT-P16, CT-P39, CT-P42, CT-P43, CT-P47, CT-P41, CT-P44, CT-P53, CT-P55, CT-P51, CT-P70, CT-P71, CT-P72, CT-P73, CT-P59, Lecirunumab, Nesina, Actos, Idalbi
|
Press page celltrion.com/en-us/company/media-center |
Metrics
| Valuation | |
|---|---|
| Market cap | ₩ 45.407T |
| Market cap (USD) | $ 33.419B |
| P/E | 28.29 |
| PEG | 1.17 |
| P/BV | 2.54 |
| P/S | 9.27 |
| P/OCF | 45.59 |
| P/FCF | 55.17 |
| Dividend yield | — |
| Turnover / mcap | — |
| Returns | |
|---|---|
| ROE | 5.9% |
| ROI | 6.0% |
| ROIC | 6.1% |
| Profit margin | 24.7% |
| Growth | |
|---|---|
| Revenue growing | Yes |
| Profits growing | Yes |
| Revenue up 3y | No |
| Revenue up 5y | No |
| Earnings growth 3y (net profit CAGR) | 24.2% |
| Quality | |
|---|---|
| Profitable | Yes |
| Margin expanding | No |
| Buying back stock | No |
| Diluting (TTM) | No |
| Debt/Equity | — |
| Podcast bulls (TTM) | Sign up |
| Podcast bears (TTM) | Sign up |
| Podcast sentiment (TTM) | Sign up |
| Podcast sentiment % (TTM) | Sign up |
| News sentiment (TTM) | — |
| Quality score | -11.8% |
| Insiders | |
|---|---|
| Buys, 1w | Sign up |
| Buys, 1m | Sign up |
| Buys, 1y | Sign up |
| Sells, 1w | Sign up |
| Sells, 1m | Sign up |
| Sells, 1y | Sign up |
Sign up to see this company's insider trades
| Figure | FY 2025 | FY 2024 | FY 2023 | FY 2022 | FY 2021 | FY 2020 | FY 2019 | FY 2018 | FY 2017 | FY 2016 | FY 2015 | FY 2014 | FY 2013 |
|---|---|---|---|---|---|---|---|---|---|---|---|---|---|
| Revenue | 4.162T | 3.557T | 2.176T | 2.284T | 1.893T | 1.849T | 1.128T | 982.075B | 949.08B | 670.581B | 603.413B | 471.046B | 226.208B |
| Net profit | 1.03T | 422.692B | 535.648B | 537.836B | 579.465B | 517.76B | 301.03B | 245.755B | 368.222B | 158.958B | 154.09B | 109.356B | 102.455B |
| Free cash flow | 537.827B | 766.812B | 327.112B | -110.305B | 847.78B | — | — | — | — | — | — | — | — |
Filed figures
Lines the statements and their notes report beside the headline figures, read from the filings' XBRL as filed (no restatement applied), with figures computed from one filing's own lines. Cash-flow lines carry their cash direction: an outflow is negative. Each period links to its filing; a figure's period, report date and tag are in its tooltip.
| Figure | Dec 2016 | Dec 2017 | Dec 2018 | Dec 2019 | Dec 2020 | Dec 2021 | Dec 2022 | Dec 2023 | Dec 2024 | Dec 2025 |
|---|---|---|---|---|---|---|---|---|---|---|
| Balance sheet detail | ||||||||||
| Trade receivables (KRW) | 758B | 828B | 808B | 814B | 1.25T | 1.1T | 1.62T | 939B | 1.22T | 1.79T |
| ↳ YoY growth | +14.5% | +9.2% | -2.5% | +0.8% | +53.8% | -12.1% | +47.3% | -42.1% | +29.4% | +47.3% |
| ↳ 5y CAGR | +24.4% | +16.6% | +13.6% | +7.7% | +14.4% | +3.1% | +8.3% | +7.4% | ||
| Other receivables (KRW) | — | — | — | — | — | — | 32.2B | 10.2B | 45.2B | 51.5B |
| Cash and deposits (KRW) | 268B | 419B | 411B | 546B | 684B | 1.19T | 551B | 565B | 996B | 1.12T |
| Intangible assets (KRW) | 720B | 788B | 885B | 1.01T | 1.4T | 1.49T | 1.62T | 13.3T | 13.7T | 13.8T |
| Cash flow detail | ||||||||||
| Operating cash flow (KRW) | 230B | 486B | 365B | 474B | 351B | 911B | 864M | 537B | 902B | 646B |
| Purchases of property, plant and equipment (KRW) | — | — | — | — | — | -63.4B | -111B | -210B | -135B | -108B |
| Purchases of intangible assets (KRW) | — | — | — | — | — | -258B | -201B | -144B | -198B | -224B |
| Dividends paid (cash effect) (KRW) | — | — | — | — | — | -3.78M | -102B | -51.7B | -104B | -154B |
| Share buybacks (cash effect) (KRW) | — | — | — | — | — | -39.1B | -281B | -917B | -436B | -907B |
| Interest paid (cash effect) (KRW) | — | — | — | — | — | -16B | -22.7B | -41.8B | -75.2B | -82.8B |
| Income taxes paid (cash effect) (KRW) | -45.2B | — | — | — | — | -136B | -217B | -154B | -145B | -444B |
| Free cash flow (OCF - PPE - intangibles) (KRW) | — | — | — | — | — | 590B | -311B | 183B | 568B | 314B |
| Income detail | ||||||||||
| Total comprehensive income (KRW) | 147B | 380B | 240B | 295B | 529B | 615B | 566B | 544B | 925B | 779B |
| Comprehensive income to owners (KRW) | 157B | 370B | 248B | 294B | 521B | 599B | 562B | 540B | 929B | 777B |
| Reported | May 12, 2022 | May 12, 2022 | May 12, 2022 | May 12, 2022 | May 12, 2022 | Mar 18, 2024 | Mar 17, 2025 | Nov 14, 2024 | Mar 17, 2025 | Mar 16, 2026 |
Sign up to see institutional holdings
Sign UpPodcast Mentions
Sign up to see podcast mentions and sentiment
Sign UpDisclosures filed with DART (material events and exchange disclosures), newest first, headlines as filed in Korean. The link opens the filing on DART. Press releases from the company's own website, newest first.
투자판단관련주요경영사항 (CTP13 SC(짐펜트라) 유럽 임상 3상 시험계획 승인(Part1&2) (류마티스 관절염 환자))
Bull 3
Bear 0
Clinical/regulatory
임원ㆍ주요주주특정증권등소유상황보고서
Bull 0
Bear 0
Routine

Prompts
Click prompts to add them under the company line, click again to take one out, then copy the result into your AI chat. Shared by Asian Century Stocks and Uncovered Thai Stocks. Thank you.
Celltrion (ticker 068270), listed in South Korea.
Copied
ETFs Holding Celltrion
Exchange-traded funds whose newest published daily portfolio holds one of the company's listings, largest weight first.
| ETF | Weight in ETF | Shares | Market value | As of |
|---|---|---|---|---|
| DGRE | 0.76% | 10,084 | $ 1.128M | Jun 30, 2026 |
| DFEV | 0.42% | 59,693 | $ 9.4M | Nov 12, 2026 |
| DFAE | 0.16% | 95,270 | $ 15.002M | Nov 12, 2026 |
| NTSE | 0.15% | 782 | $ 87.472K | Jun 30, 2026 |
| DFSE | 0.15% | 5,627 | $ 886.058K | Nov 12, 2026 |
| DFEM | 0.10% | 56,902 | $ 8.96M | Nov 12, 2026 |
| TIER | 0.09% | 241 | $ 31.058K | Jul 31, 2026 |
| AVSE | 0.08% | 1,021 | $ 161.634K | Nov 16, 2026 |
| DEXC | 0.07% | 1,098 | $ 172.897K | Nov 12, 2026 |
| AVEM | 0.04% | 67,914 | $ 10.751M | Nov 16, 2026 |
| AVXC | 0.04% | 1,152 | $ 182.372K | Nov 16, 2026 |
| JSTC | 0.03% | 503 | $ 80.762K | Nov 17, 2026 |
| DFAX | 0.03% | 20,688 | $ 3.258M | Nov 12, 2026 |
| DEHP | 0.01% | 247 | $ 38.894K | Nov 12, 2026 |