주식소각결정
Bull 2
Bear 0
Capital return
066570
|
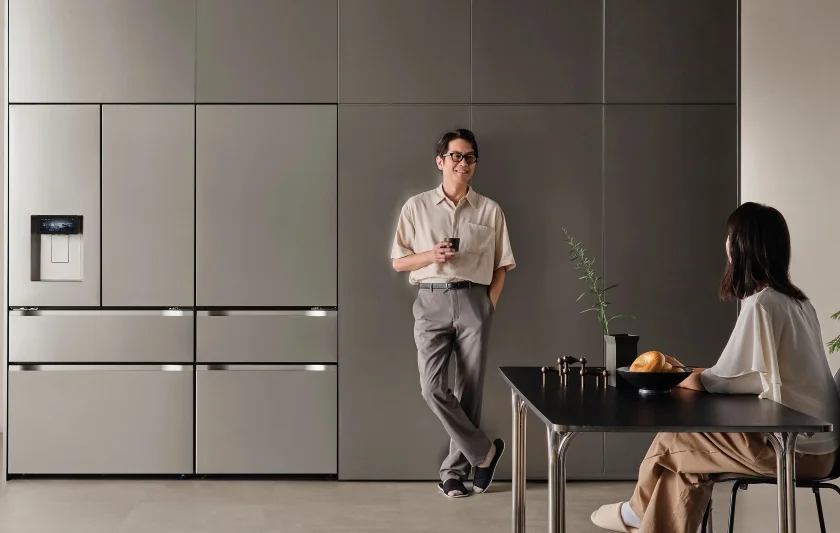
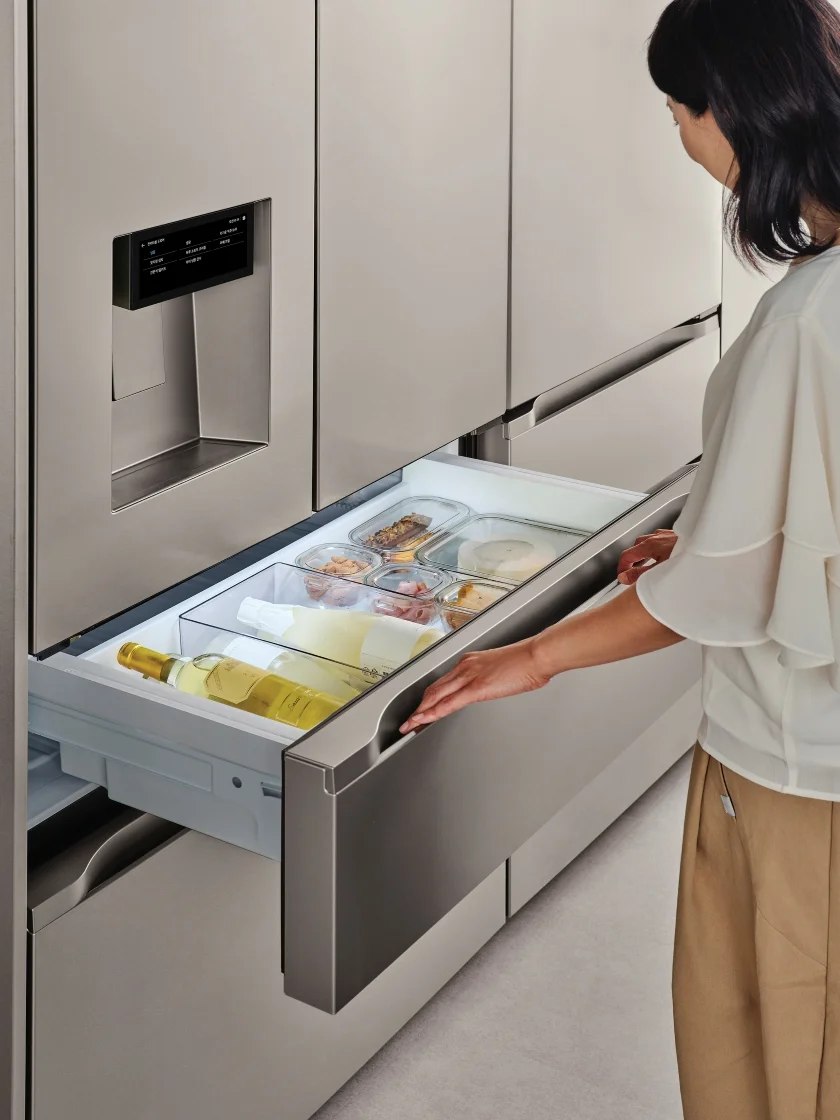
LG Electronics Inc. is a South Korean electronics manufacturer operating through four main business segments: Home Appliance Solution (HS), Media Entertainment Solution (MS), Vehicle Solution (VS), and Mobile Communications Solution (MC). The HS segment produces refrigerators, washing machines, air conditioners, and vacuum cleaners under brands such as LG DiOS, LG TROMM, and LG SIGNATURE. The MS segment manufactures televisions, monitors, audio equipment, and information displays, including LG OLED and QNED TVs, LG UltraGear gaming monitors, and the webOS smart TV platform. The VS segment develops automotive components, including telematics, audio-video navigation systems, and HVAC solutions for electric vehicles. The MC segment, primarily through the subsidiary LG Innotek, produces camera modules and other electronic components. The company serves global markets with major customers including Best Buy, Home Depot, and Lowe's. Production facilities are located in South Korea, China, Thailand, the United States, Mexico, Poland, Indonesia, Vietnam, and Austria. LG Electronics holds a global patent cross-license agreement with Google and operates R&D centers in North America, Europe, Japan, and India. Summarised from the company's own disclosures, fiscal year ended Jul 2026 |
Industry Consumer Electronics | Homepage lge.co.kr |
| Sector Technology | IR page lge.co.kr/company/investor | |
|
Tags
home appliances, televisions, automotive electronics, camera modules, smart home, oled displays, hvac systems, gaming monitors, robotics, webos, LG DiOS, LG TROMM, LG SIGNATURE, LG OLED, LG QNED, LG UltraGear, LG Innotek, LG Gram, LG Styler, LG Puricare, LG HOM-BOT, LG Code Zero, LG Objet Collection, LG Whisen, LG ThinQ, LG Magna e-Powertrain, LG-LHT Passenger Solutions, LG-LHT Aircraft Solutions, Cybellum Technologies, Bear Robotics, Alphonso, Rinse
|
Press page — |
Metrics
| Valuation | |
|---|---|
| Market cap | ₩ 43.216T |
| Market cap (USD) | $ 31.806B |
| P/E | 41.44 |
| PEG | — |
| P/BV | 1.61 |
| P/S | 0.46 |
| P/OCF | 7.45 |
| P/FCF | 13.70 |
| Dividend yield | — |
| Turnover / mcap | — |
| Returns | |
|---|---|
| ROE | 4.3% |
| ROI | 4.0% |
| ROIC | 6.9% |
| Profit margin | 1.1% |
| Growth | |
|---|---|
| Revenue growing | Yes |
| Profits growing | Yes |
| Revenue up 3y | Yes |
| Revenue up 5y | Yes |
| Earnings growth 3y (net profit CAGR) | -7.1% |
| Quality | |
|---|---|
| Profitable | Yes |
| Margin expanding | No |
| Buying back stock | No |
| Diluting (TTM) | No |
| Debt/Equity | — |
| Podcast bulls (TTM) | Sign up |
| Podcast bears (TTM) | Sign up |
| Podcast sentiment (TTM) | Sign up |
| Podcast sentiment % (TTM) | Sign up |
| News sentiment (TTM) | — |
| Quality score | 33.3% |
| Insiders | |
|---|---|
| Buys, 1w | Sign up |
| Buys, 1m | Sign up |
| Buys, 1y | Sign up |
| Sells, 1w | Sign up |
| Sells, 1m | Sign up |
| Sells, 1y | Sign up |
Sign up to see this company's insider trades
| Figure | FY 2025 | FY 2024 | FY 2023 | FY 2022 | FY 2021 | FY 2020 | FY 2019 | FY 2018 | FY 2017 | FY 2016 | FY 2015 | FY 2014 | FY 2013 |
|---|---|---|---|---|---|---|---|---|---|---|---|---|---|
| Revenue | 89.201T | 87.728T | 84.228T | 82.521T | 73.908T | 63.262T | 62.306T | 61.342T | 61.396T | 55.367T | 56.509T | 59.041T | 56.772T |
| Net profit | 960.579B | 367.515B | 712.902B | 1.196T | 1.032T | 1.968T | 31.285B | 1.24T | 1.726T | 76.879B | 124.394B | 399.35B | 176.768B |
| Free cash flow | 1.665T | 1.486T | 2.644T | -8.978B | 29.317B | 2.347T | 1.617T | 1.375T | -409.272B | 1.139T | 871.522B | -136.762B | 93.741B |
Filed figures
Lines the statements and their notes report beside the headline figures, read from the filings' XBRL as filed (no restatement applied), with figures computed from one filing's own lines. Cash-flow lines carry their cash direction: an outflow is negative. Each period links to its filing; a figure's period, report date and tag are in its tooltip.
| Figure | Dec 2016 | Dec 2017 | Dec 2018 | Dec 2019 | Dec 2020 | Dec 2021 | Dec 2022 | Dec 2023 | Dec 2024 | Dec 2025 |
|---|---|---|---|---|---|---|---|---|---|---|
| Balance sheet detail | ||||||||||
| Trade receivables (KRW) | 7.06T | 8.18T | 6.37T | 6.36T | 7.15T | 8.17T | 8.22T | 9.27T | 10.5T | 11.2T |
| ↳ YoY growth | -0.5% | +15.8% | -22.1% | -0.2% | +12.5% | +14.1% | +0.6% | +12.8% | +13.7% | +5.9% |
| ↳ 5y CAGR | -2.2% | -3.7% | +0.2% | +3.0% | +0.1% | +7.8% | +10.6% | +9.3% | ||
| Other receivables (KRW) | — | — | — | — | — | — | — | 596B | 1.58T | 792B |
| Borrowings, current (KRW) | 1.65T | 1.36T | 1.41T | 1.64T | 1.45T | 1.9T | 2.29T | 2.6T | 2.89T | 2.46T |
| Borrowings, non-current (KRW) | 7.01T | 8.09T | 9.5T | 8.84T | 8.47T | 8.04T | 8.76T | 10.7T | 11.1T | 10.2T |
| Lease liabilities (KRW) | — | 0.00 | 0.00 | 771B | 862B | 955B | 1.1T | 1.19T | 1.26T | 1.32T |
| Cash and deposits (KRW) | 3.02T | 3.35T | 4.27T | 4.78T | 5.9T | 6.05T | 6.32T | 8.49T | 7.57T | 8.77T |
| Intangible assets (KRW) | 1.57T | 1.85T | 3T | 2.69T | 3.14T | 2.44T | 2.45T | 2.87T | 3.52T | 4.37T |
| Net debt (borrowings + leases - cash) (KRW) | 3.99T | 6.1T | 6.63T | 6.48T | 4.89T | 4.84T | 5.82T | 6.03T | 7.67T | 5.19T |
| Cash flow detail | ||||||||||
| Operating cash flow (KRW) | 3.16T | 2.17T | 4.54T | 3.69T | 4.63T | 2.68T | 3.11T | 5.91T | 3.84T | 4.28T |
| Purchases of property, plant and equipment (KRW) | -2.02T | -2.58T | -3.17T | -2.07T | -2.28T | -2.65T | -3.12T | -3.27T | -2.36T | -2.62T |
| Purchases of intangible assets (KRW) | -457B | -644B | -678B | -472B | -801B | -611B | -636B | -868B | -1.31T | -1.29T |
| Dividends paid (cash effect) (KRW) | -117B | -117B | -123B | -231B | -235B | -291B | -240B | -241B | -317B | -266B |
| Interest paid (cash effect) (KRW) | -434B | -384B | -426B | -411B | -373B | -319B | -375B | -560B | -623B | -625B |
| Income taxes paid (cash effect) (KRW) | -537B | -537B | -495B | -569B | -652B | -683B | -1.15T | -1.01T | -980B | -1.13T |
| Free cash flow (OCF - PPE - intangibles) (KRW) | 682B | -1.05T | 697B | 1.14T | 1.55T | -582B | -645B | 1.78T | 175B | 373B |
| Income detail | ||||||||||
| Research and development expense (KRW) | — | — | — | — | — | 2.09T | 2.4T | 2.55T | 2.69T | 2.78T |
| Total comprehensive income (KRW) | 484B | 1.43T | 1.33T | 377B | 1.34T | 2.32T | 2.61T | 1.25T | 2.07T | 2.06T |
| Comprehensive income to owners (KRW) | 433B | 1.31T | 1.1T | 221B | 1.24T | 1.89T | 1.91T | 818B | 1.62T | 1.72T |
| Reported | Nov 14, 2017 | Mar 30, 2020 | May 15, 2019 | Mar 30, 2020 | Mar 16, 2021 | Mar 18, 2024 | Mar 18, 2024 | Jul 6, 2026 | May 15, 2025 | Jul 6, 2026 |
Sign up to see institutional holdings
Sign UpPodcast Mentions
Sign up to see podcast mentions and sentiment
Sign UpDisclosures filed with DART (material events and exchange disclosures), newest first, headlines as filed in Korean. The link opens the filing on DART. Press releases from the company's own website, newest first.


 유튜브
 인스타그램
 페이스북
 LG전자 뉴스룸
 카카오톡
 블로그




 TV
 스탠바이미
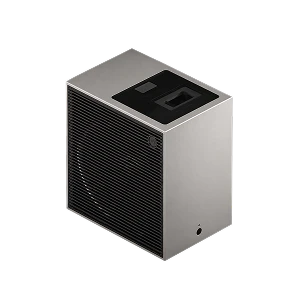 프로젝터
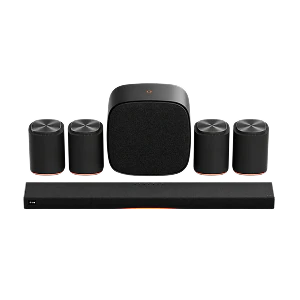 오디오
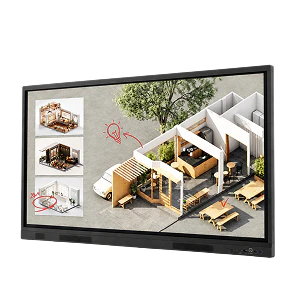 사이니지
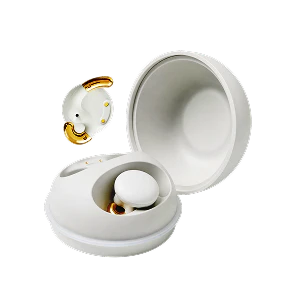 마인드웰니스
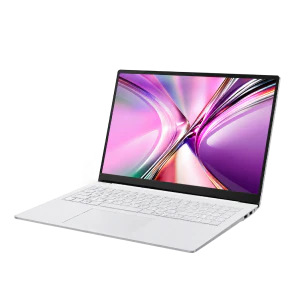 노트북
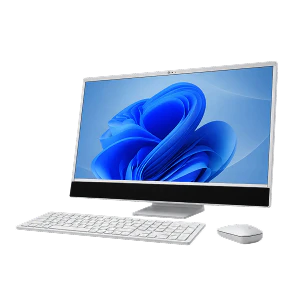 일체형/데스크톱/태블릿
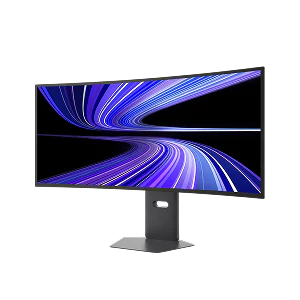 모니터
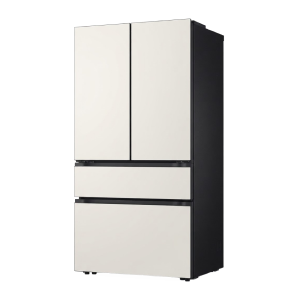 냉장고
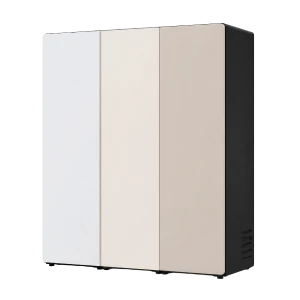 컨버터블 패키지
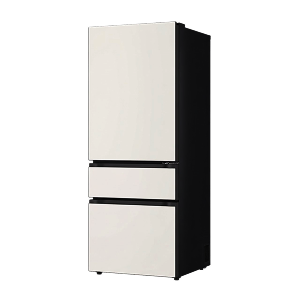 김치냉장고
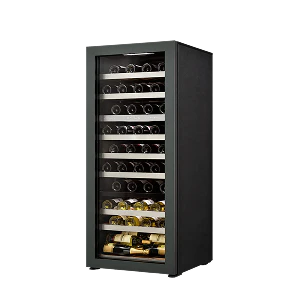 와인셀러
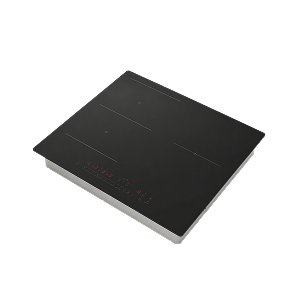 전기레인지
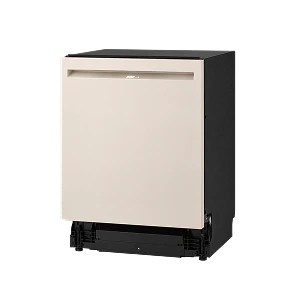 식기세척기
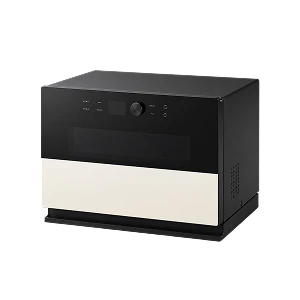 광파오븐/전자레인지
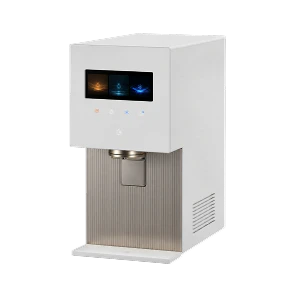 정수기
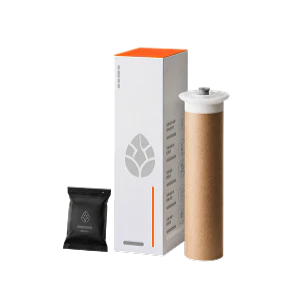 맥주제조기
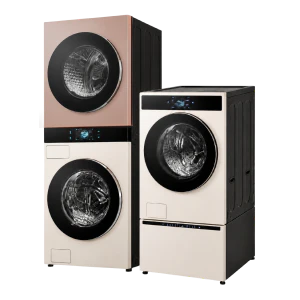 세탁 건조기
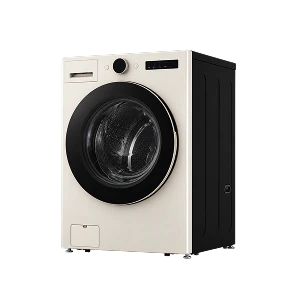 세탁기
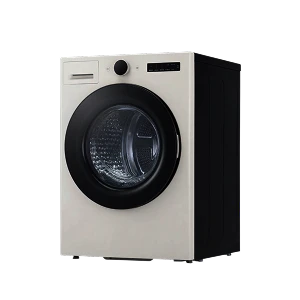 의류건조기
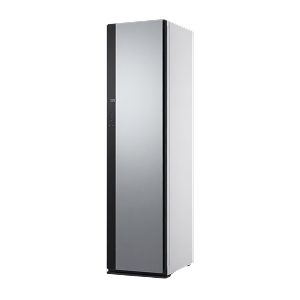 의류관리기
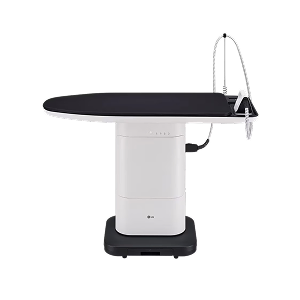 시스템 아이어닝
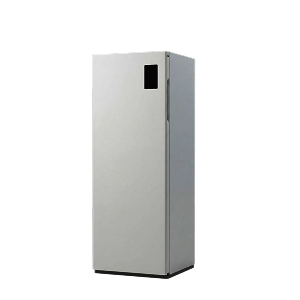 신발관리기
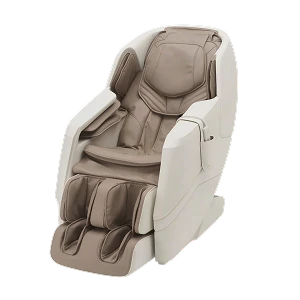 안마의자
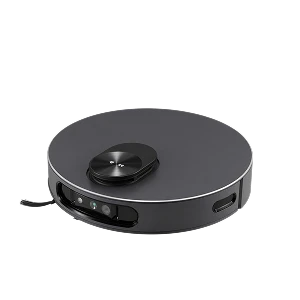 청소기
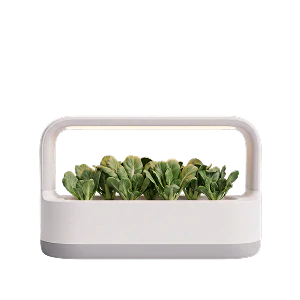 식물생활가전
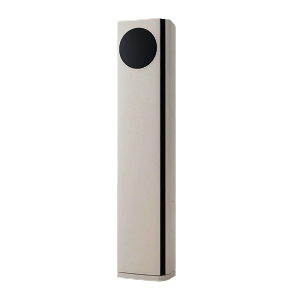 에어컨
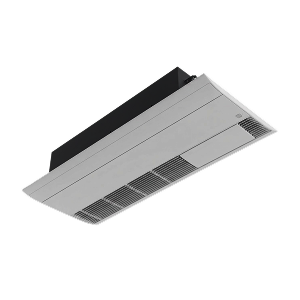 시스템 에어컨
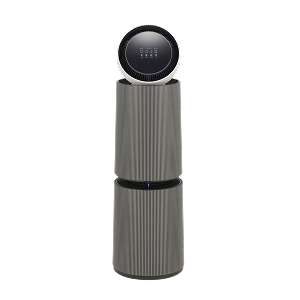 공기청정기
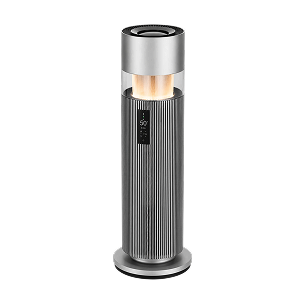 가습 공기청정기
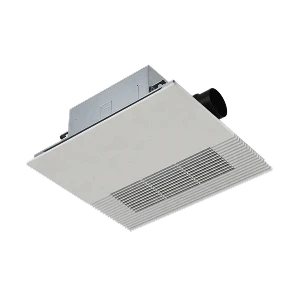 시스템 공기청정기
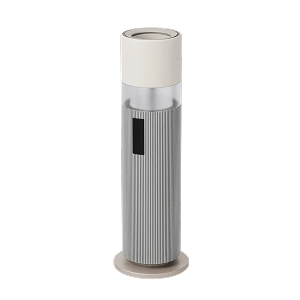 가습기
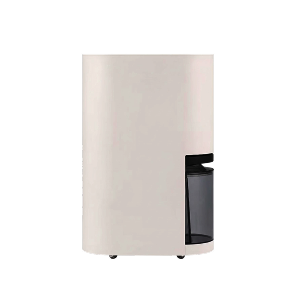 제습기
 선풍기
 환기 시스템
 바스에어시스템
 소모품/케어용품 홈
 특가 Zone
 LG UP Kit
 LG 컴포트 키트
 에어컨
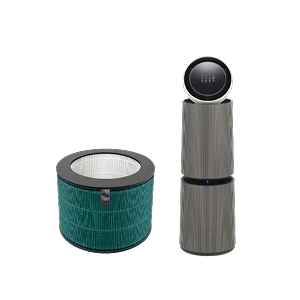 공기청정기
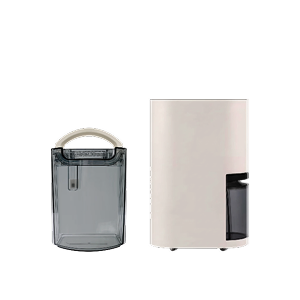 제습기
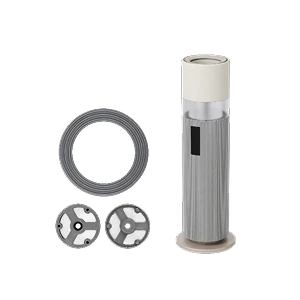 가습기
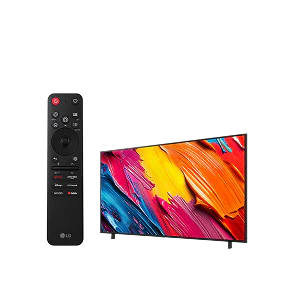 TV/오디오
 PC/노트북/프린터
 청소기
 세탁기
 건조기
 의류관리기
 신발관리기
 뷰티/의료기기
 냉장고
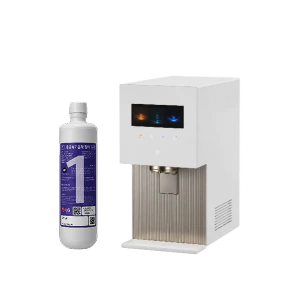 정수기
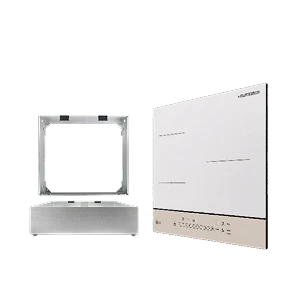 주방/조리기기
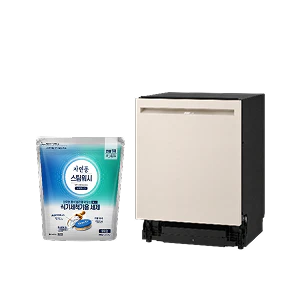 식기세척기
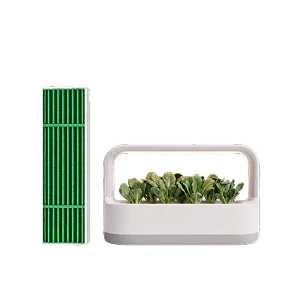 식물생활가전
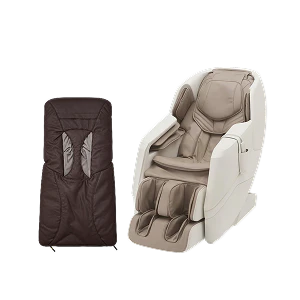 안마의자
 고객자가수리





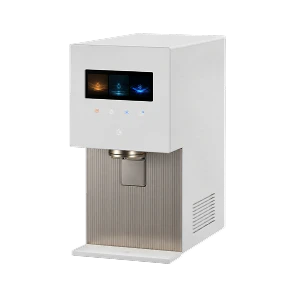 정수기
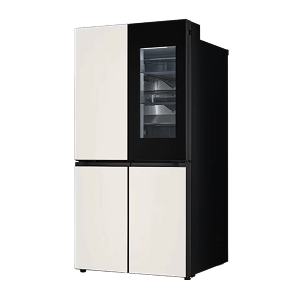 냉장고
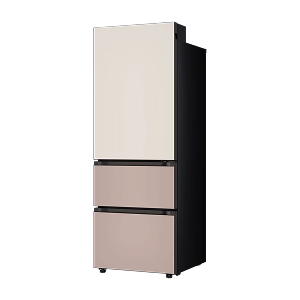 김치냉장고
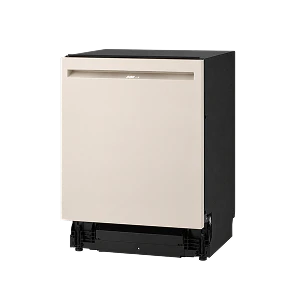 식기세척기
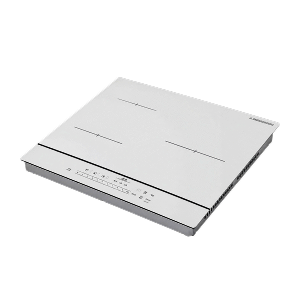 전기레인지
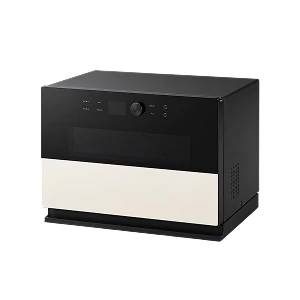 광파오븐
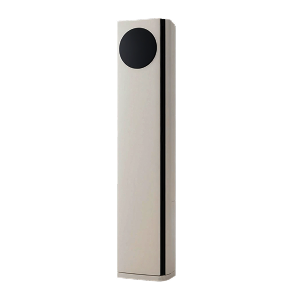 에어컨
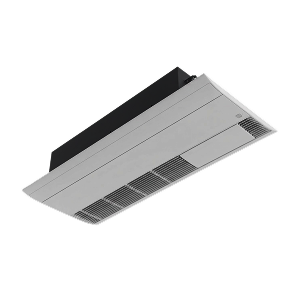 시스템 에어컨
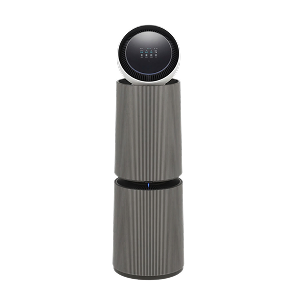 공기청정기
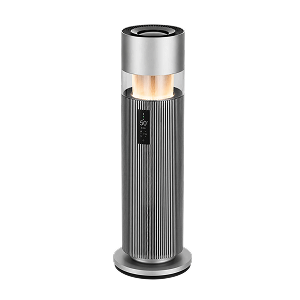 가습 공기청정기
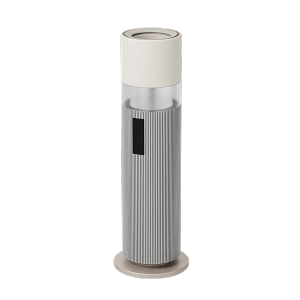 가습기
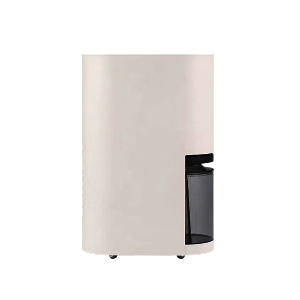 제습기
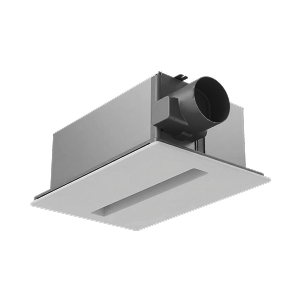 바스에어시스템
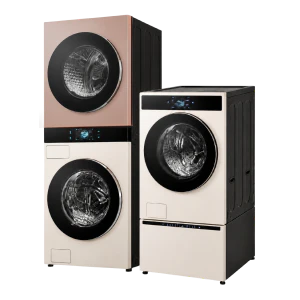 세탁 건조기
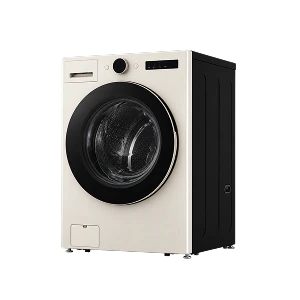 세탁기
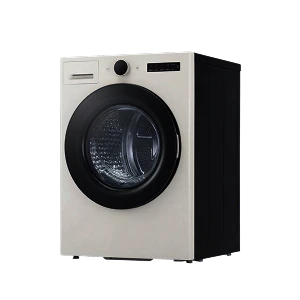 의류건조기
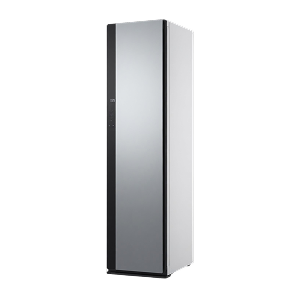 의류관리기
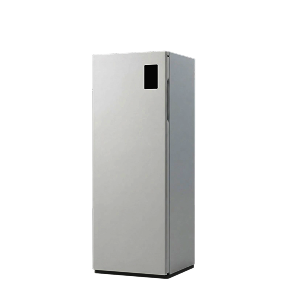 신발관리기
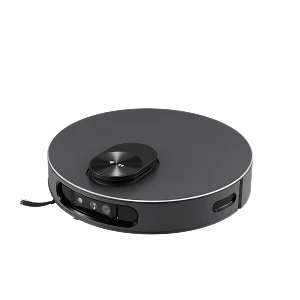 청소기
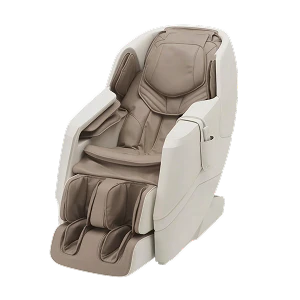 안마의자
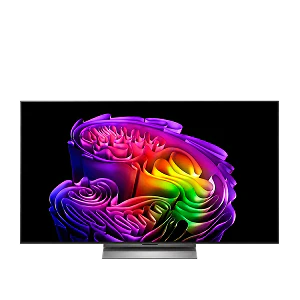 TV
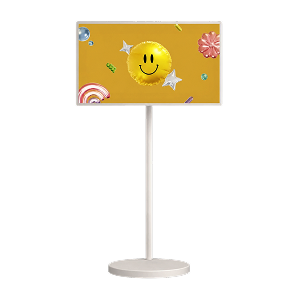 스탠바이미
 노트북
 침대
 매트리스·토퍼
 식탁·테이블
 소파
 책상
 의자
 TV거실장
 책장·수납장
 트롤리
 선반
 옷장·행거
 화장대·콘솔
 가벽·파티션
 유아동가구
 아웃도어가구
 침구
 베개
 쿠션·방석
 커튼·블라인드
 러그·매트
 타월
 홈패브릭
 키친패브릭
 유아동패브릭
 포터블조명
 천장·팬던트조명
 벽조명
 스탠드조명
 데스크조명
 실링팬
 시계
 홈프래그런스
 갤러리·월데코
 거울
 오브제
 그릇·식기
 수저·커트러리
 컵·텀블러
 저장용기·도시락
 냄비·팬·솥
 조리도구
 와인·칵테일용품
 커피·티용품
 주방수납·정리
 수납·리빙박스
 청소·빨래
 욕실
 생활전기용품
 생필품
 기타생활소품
 인테리어
 커뮤니티
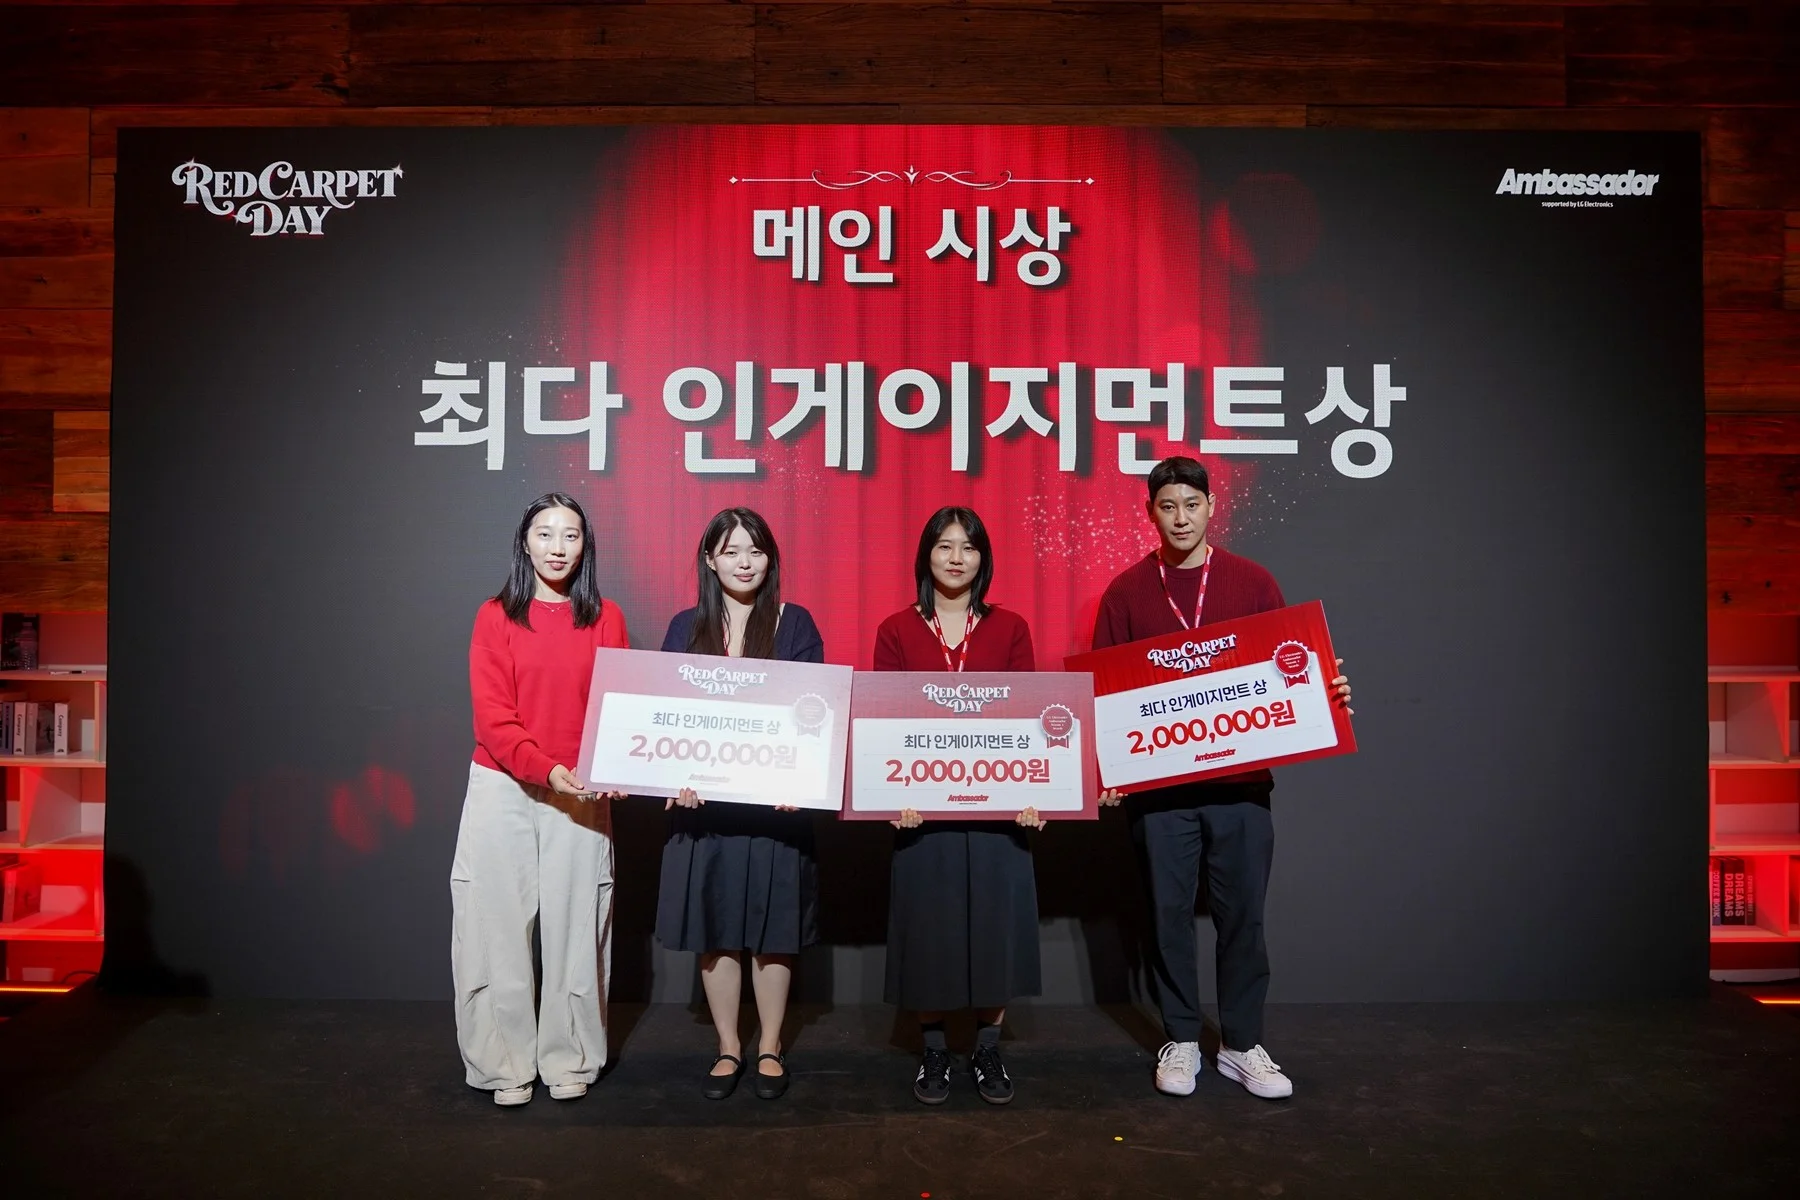
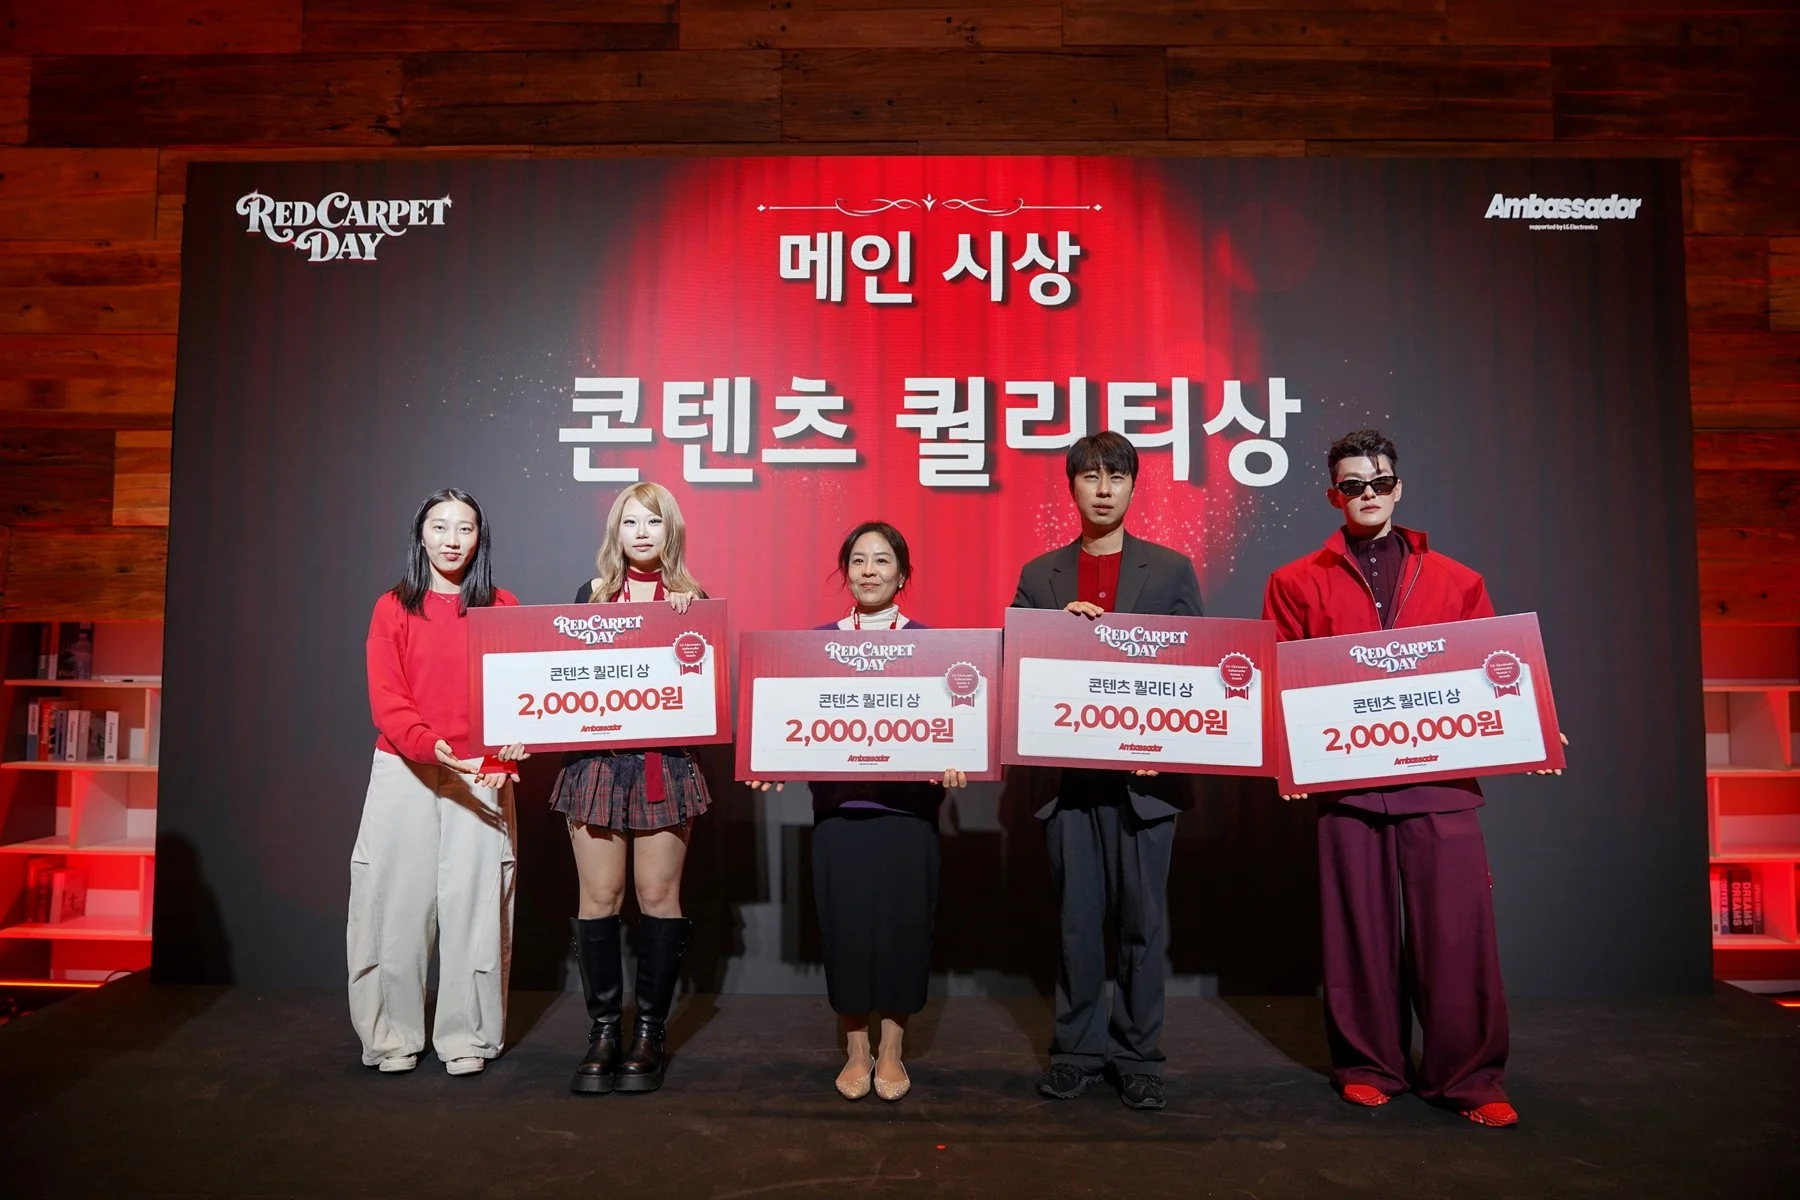
Prompts
Click prompts to add them under the company line, click again to take one out, then copy the result into your AI chat. Shared by Asian Century Stocks and Uncovered Thai Stocks. Thank you.
LG ELECTRONICS INC. (ticker 066570), listed in South Korea.
Copied
ETFs Holding LG ELECTRONICS INC.
Exchange-traded funds whose newest published daily portfolio holds one of the company's listings, largest weight first.
| ETF | Weight in ETF | Shares | Market value | As of |
|---|---|---|---|---|
| AVES | 0.86% | 129,629 | $ 12.455M | Nov 16, 2026 |
| FEMR | 0.66% | 7,942 | $ 1.041M | Jun 30, 2026 |
| DEHP | 0.45% | 17,638 | $ 1.819M | Nov 12, 2026 |
| AVEM | 0.39% | 1,077,044 | $ 103.483M | Nov 16, 2026 |
| SEEM | 0.35% | 16,304 | $ 2.136M | Jun 30, 2026 |
| AVXC | 0.35% | 15,068 | $ 1.448M | Nov 16, 2026 |
| AVSE | 0.34% | 7,579 | $ 728.198K | Nov 16, 2026 |
| REMG | 0.30% | 2,426 | $ 317.871K | Jun 30, 2026 |
| DFEV | 0.28% | 59,833 | $ 6.17M | Nov 12, 2026 |
| DFSE | 0.26% | 14,656 | $ 1.511M | Nov 12, 2026 |
| COPY | 0.25% | 6,563 | $ 1.038M | Aug 31, 2026 |
| DEXC | 0.21% | 5,281 | $ 544.593K | Nov 12, 2026 |
| DFEM | 0.15% | 126,098 | $ 13.004M | Nov 12, 2026 |
| NTSE | 0.13% | 564 | $ 73.899K | Jun 30, 2026 |
| DFAE | 0.12% | 109,905 | $ 11.334M | Nov 12, 2026 |
| DFAX | 0.07% | 77,359 | $ 7.977M | Nov 12, 2026 |