기업가치제고계획예고(안내공시)
Bull 0
Bear 0
Routine
051900
|
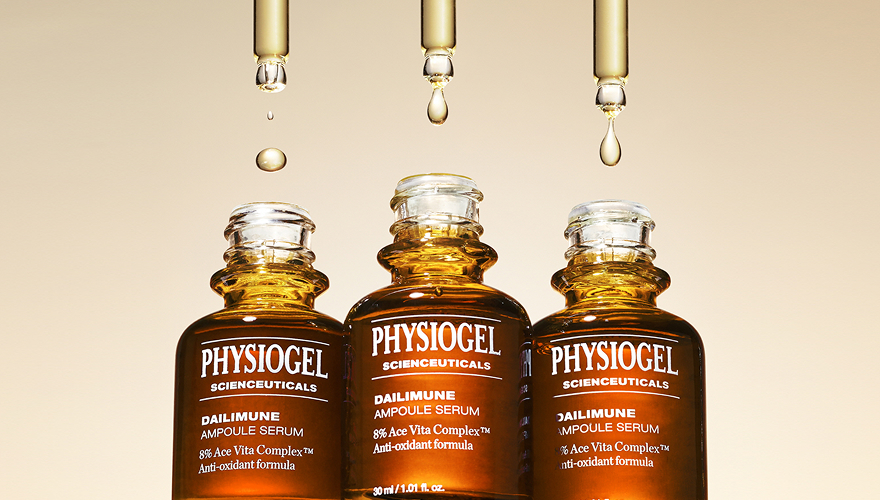
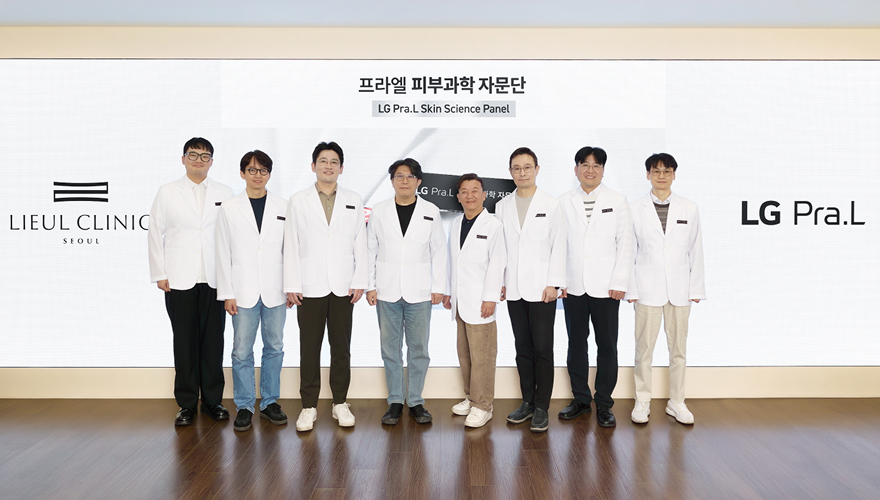
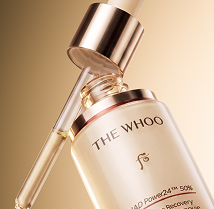
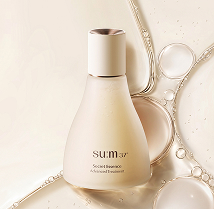
LG H&H is a South Korean consumer goods company operating in three main business segments: Beauty, Home Care & Daily Beauty (HDB), and Refreshment. The Beauty segment includes luxury and premium brands such as The History of Whoo, Sulwhasoo, O HUI, Belif, and The Face Shop, as well as dermocosmetic and color cosmetics brands like CNP, hince, and Glint. The HDB segment covers daily beauty products including shampoos, toothpastes, and body washes, alongside home care items like laundry detergents and dish soaps, featuring brands such as Physiogel, Dr. Groot, and Yucalmol. The Refreshment segment involves the manufacturing and distribution of carbonated and non-carbonated beverages, primarily acting as a bottling partner for The Coca-Cola Company in South Korea, with brands including Coca-Cola, Sprite, and Monster Energy. The company serves domestic and international markets, with significant operations in China, Japan, and North America through subsidiaries like LG H&H USA, Inc., The Avon Company, and The Creme Shop, Inc. It maintains a global R&D network and distribution infrastructure to support its portfolio of personal care, household, and beverage products. Summarised from the company's own disclosures, fiscal year ended Mar 2026 |
Industry Household & Personal Products | Homepage lghnh.com |
| Sector Consumer Defensive | IR page lghnh.com/index.jsp | |
|
Tags
cosmetics, personal care, home care, beverages, bottling, luxury beauty, dermocosmetics, oral care, hair care, cleaning products, The History of Whoo, Sulwhasoo, O HUI, Belif, CNP, The Face Shop, Glint, Freshian, hince, Physiogel, Dr. Groot, Yucalmol, Coca-Cola, Sprite, Monster Energy, Powerade, Coca-Cola Beverage Co. Ltd., LG H&H USA Inc., The Avon Company, The Creme Shop Inc., Ginza Stefany Inc., Everlife Co. Ltd., Boinca, Pra.L, Viva Wave, LG H&H Trading (Shanghai) Co. Ltd., LG H&H Tokyo R&D Center Inc., LG Unicharm, Sofy, Riche, Luchefelo, Fruits & Passion, Violet Dream, Farouk Systems, LG CHI Color Master, O's Sirius, Urim Water, Imprintu, Scent Berry Perfume House
|
Press page — |
Metrics
| Valuation | |
|---|---|
| Market cap | — |
| Market cap (USD) | — |
| P/E | -51.17 |
| PEG | — |
| P/BV | — |
| P/S | — |
| P/OCF | — |
| P/FCF | — |
| Dividend yield | — |
| Turnover / mcap | — |
| Returns | |
|---|---|
| ROE | -1.8% |
| ROI | -1.8% |
| ROIC | 2.3% |
| Profit margin | -1.6% |
| Growth | |
|---|---|
| Revenue growing | No |
| Profits growing | No |
| Revenue up 3y | No |
| Revenue up 5y | No |
| Earnings growth 3y (net profit CAGR) | — |
| Quality | |
|---|---|
| Profitable | No |
| Margin expanding | No |
| Buying back stock | — |
| Diluting (TTM) | — |
| Debt/Equity | — |
| Podcast bulls (TTM) | Sign up |
| Podcast bears (TTM) | Sign up |
| Podcast sentiment (TTM) | Sign up |
| Podcast sentiment % (TTM) | Sign up |
| News sentiment (TTM) | — |
| Quality score | -50.0% |
| Insiders | |
|---|---|
| Buys, 1w | Sign up |
| Buys, 1m | Sign up |
| Buys, 1y | Sign up |
| Sells, 1w | Sign up |
| Sells, 1m | Sign up |
| Sells, 1y | Sign up |
Sign up to see this company's insider trades
| Figure | FY 2025 | FY 2024 | FY 2023 | FY 2022 | FY 2021 | FY 2020 | FY 2019 | FY 2018 | FY 2017 | FY 2016 | FY 2015 | FY 2014 | FY 2013 |
|---|---|---|---|---|---|---|---|---|---|---|---|---|---|
| Revenue | 6.355T | 6.812T | 6.805T | 7.186T | 8.092T | 7.845T | 7.685T | 6.748T | 6.27T | 6.094T | 5.328T | 4.677T | 4.326T |
| Net profit | -100.095B | 189.135B | 142.755B | 236.572B | 844.523B | 797.629B | 778.098B | 682.743B | 606.653B | 568.221B | 460.351B | 349.432B | 357.304B |
| Free cash flow | 367.554B | 396.487B | 506.643B | 340.254B | 662.607B | 499.099B | 813.552B | 460.832B | 451.271B | 381.888B | 336.127B | 278.559B | 255.061B |
Filed figures
Lines the statements and their notes report beside the headline figures, read from the filings' XBRL as filed (no restatement applied), with figures computed from one filing's own lines. Cash-flow lines carry their cash direction: an outflow is negative. Each period links to its filing; a figure's period, report date and tag are in its tooltip.
| Figure | Dec 2016 | Dec 2017 | Dec 2018 | Dec 2019 | Dec 2020 | Dec 2021 | Dec 2022 | Dec 2023 | Dec 2024 | Dec 2025 |
|---|---|---|---|---|---|---|---|---|---|---|
| Balance sheet detail | ||||||||||
| Trade receivables (KRW) | 493B | 523B | 556B | 611B | 586B | 555B | 551B | 529B | 576B | 488B |
| ↳ YoY growth | +13.0% | +6.1% | +6.4% | +9.9% | -4.2% | -5.2% | -0.7% | -4.0% | +8.9% | -15.4% |
| ↳ 5y CAGR | +5.6% | +7.4% | +6.1% | +2.4% | +1.1% | -1.0% | -1.2% | -3.6% | ||
| Other receivables (KRW) | — | — | — | — | — | 38.1B | 52B | 38.4B | 30.7B | 40.8B |
| Borrowings, current (KRW) | 277B | 336B | 374B | 391B | 190B | 30B | 223B | 0.00 | 243B | 55.8B |
| Borrowings, non-current (KRW) | 7.76B | 18.3B | 7.13B | 3.57B | 22.8B | 17.3B | 14.8B | 1.99B | 0.00 | 0.00 |
| Bonds payable (KRW) | 180B | 260B | 150B | 100B | — | 30B | 0.00 | 0.00 | — | — |
| Cash and deposits (KRW) | 339B | 386B | 397B | 647B | 434B | 735B | 655B | 910B | 1.25T | 1.09T |
| Intangible assets (KRW) | 690B | 1.39T | 1.54T | 1.79T | 2.06T | 2.17T | 2.1T | 2.01T | 1.96T | 1.8T |
| Right-of-use assets (KRW) | — | 0.00 | 0.00 | 273B | 220B | 204B | 181B | 152B | 123B | 96.1B |
| Net debt (borrowings + leases - cash) (KRW) | -331B | -31.8B | -15.2B | -252B | -221B | -687B | -417B | -908B | -1.01T | -1.03T |
| Cash flow detail | ||||||||||
| Operating cash flow (KRW) | 713B | 735B | 817B | 1.14T | 1T | 984B | 497B | 659B | 528B | 446B |
| Purchases of property, plant and equipment (KRW) | -332B | -284B | -356B | -326B | -506B | -322B | -157B | -152B | -131B | -78.9B |
| Purchases of intangible assets (KRW) | -8.08B | -6.6B | -7.84B | -8.97B | -13.1B | -10.3B | -9.39B | -11.1B | -16.2B | -15.8B |
| Change in receivables (cash effect) (KRW) | -48.1B | -62.3B | 3.68B | -22.6B | 22.5B | 48.8B | 12.9B | 23.5B | -32.5B | 87B |
| Change in inventories (cash effect) (KRW) | -92.5B | -16.6B | -43.5B | -31B | -67.8B | -148B | 62B | 75.4B | -3.29B | 86.4B |
| Change in payables (cash effect) (KRW) | 9.01B | 10.3B | -42.7B | 2.41B | -30.1B | 5.13B | -65.2B | 39.4B | -33B | -24.8B |
| Dividends paid (cash effect) (KRW) | -93.3B | -134B | — | — | — | -186B | -201B | -97.1B | -59.8B | -97.5B |
| Interest paid (cash effect) (KRW) | -20.7B | -14.4B | -11.6B | -10.2B | -8.7B | -7.98B | -11.8B | -16.1B | -18.6B | -20B |
| Income taxes paid (cash effect) (KRW) | -165B | -235B | -237B | -316B | -337B | -303B | -244B | -166B | -104B | -110B |
| Operating cash flow before change in receivables (KRW) | 762B | 798B | 813B | 1.16T | 982B | 936B | 484B | 636B | 560B | 359B |
| Free cash flow (OCF - PPE - intangibles) (KRW) | 374B | 445B | 453B | 805B | 486B | 652B | 331B | 496B | 380B | 352B |
| Income detail | ||||||||||
| Total comprehensive income (KRW) | 602B | 602B | 692B | 802B | 803B | 941B | 265B | 136B | 251B | -56.7B |
| Comprehensive income to owners (KRW) | 591B | 591B | 683B | 792B | 787B | 923B | 241B | 116B | 229B | -71.7B |
| Provision for credit losses (KRW) | 1.55B | 1.34B | -182M | 231M | 595M | 3.73B | -429M | 1.29B | 713M | -387M |
| Credit cost ratio (credit losses / average receivables) (%) | 0.3% | 0.3% | 0.0% | 0.0% | 0.1% | 0.6% | 0.1% | 0.2% | 0.1% | 0.1% |
| Reported | Apr 2, 2018 | Mar 30, 2020 | Mar 11, 2021 | Mar 30, 2020 | Mar 11, 2021 | Mar 18, 2024 | Mar 18, 2024 | Mar 18, 2024 | Mar 17, 2025 | Mar 16, 2026 |
Sign up to see institutional holdings
Sign UpPodcast Mentions
Sign up to see podcast mentions and sentiment
Sign UpDisclosures filed with DART (material events and exchange disclosures), newest first, headlines as filed in Korean. The link opens the filing on DART. Press releases from the company's own website, newest first.







Prompts
Click prompts to add them under the company line, click again to take one out, then copy the result into your AI chat. Shared by Asian Century Stocks and Uncovered Thai Stocks. Thank you.
LG H&H (ticker 051900), listed in South Korea.
Copied
ETFs Holding LG H&H
Exchange-traded funds whose newest published daily portfolio holds one of the company's listings, largest weight first.
| ETF | Weight in ETF | Shares | Market value | As of |
|---|---|---|---|---|
| AVEE | 0.19% | 1,399 | $ 245.138K | Nov 16, 2026 |
| DFEV | 0.05% | 6,489 | $ 1.112M | Nov 12, 2026 |
| DFSE | 0.03% | 1,174 | $ 201.189K | Nov 12, 2026 |
| DFEM | 0.03% | 14,117 | $ 2.419M | Nov 12, 2026 |
| AVSE | 0.02% | 215 | $ 37.673K | Nov 16, 2026 |
| DFAE | 0.01% | 7,957 | $ 1.364M | Nov 12, 2026 |
| DFAX | 0.01% | 8,639 | $ 1.48M | Nov 12, 2026 |
| AVEM | 0.01% | 21,446 | $ 3.758M | Nov 16, 2026 |
| DEXC | 0.01% | 113 | $ 19.365K | Nov 12, 2026 |
| NTSE | 0.01% | 24 | $ 3,555.15 | Jun 30, 2026 |
| AVXC | 0.00% | 116 | $ 20.326K | Nov 16, 2026 |