주식등의대량보유상황보고서(약식)
Bull 0
Bear 0
Routine
035900
|
JYP Entertainment is a comprehensive entertainment company that discovers and trains artists, plans and produces music and video content, and manages artist activities including concerts and appearances. The company operates through two main business segments: the music business, which involves the production and distribution of physical albums and digital music, and the management business, which includes concert production, artist services, and IP licensing. Key artists managed by the company include TWICE, Stray Kids, ITZY, NiziU, Xdinary Heroes, NMIXX, and NEXZ. JYP Entertainment serves global markets, with a strong presence in South Korea, Japan, and expanding into North America, Europe, and other regions. The company has established strategic partnerships with global music distributors such as Sony Music, Tencent Music Entertainment, and Republic Records, as well as a strategic partnership with Live Nation for global concert promotion. Additionally, the company operates a subsidiary, Blue Garage, to develop platform businesses and expand IP utilization. Summarised from the company's own disclosures, fiscal year ended Mar 2026 |
Industry Entertainment | Homepage jype.com |
| Sector Communication Services | IR page jype.com | |
|
Tags
k-pop, artist management, music production, concert promotion, ip licensing, talent development, digital music, physical albums, global tours, content distribution, TWICE, Stray Kids, ITZY, NiziU, Xdinary Heroes, NMIXX, NEXZ, DAY6, JUN. K, Young K, GIRLSET, KickFlip, CIIU, dodree, Blue Garage, JYP America, JYP Hong Kong, INNIT Entertainment, Beyond Live Corporation, Live Nation, Sony Music, Tencent Music Entertainment, Republic Records
|
Press page jype.com/board/ir-news |
Metrics
| Valuation | |
|---|---|
| Market cap | — |
| Market cap (USD) | — |
| P/E | — |
| PEG | — |
| P/BV | — |
| P/S | — |
| P/OCF | — |
| P/FCF | — |
| Dividend yield | — |
| Turnover / mcap | — |
| Returns | |
|---|---|
| ROE | 29.2% |
| ROI | 25.9% |
| ROIC | 18.0% |
| Profit margin | 19.5% |
| Growth | |
|---|---|
| Revenue growing | Yes |
| Profits growing | Yes |
| Revenue up 3y | Yes |
| Revenue up 5y | Yes |
| Earnings growth 3y (net profit CAGR) | 33.5% |
| Quality | |
|---|---|
| Profitable | Yes |
| Margin expanding | No |
| Buying back stock | — |
| Diluting (TTM) | — |
| Debt/Equity | — |
| Podcast bulls (TTM) | Sign up |
| Podcast bears (TTM) | Sign up |
| Podcast sentiment (TTM) | Sign up |
| Podcast sentiment % (TTM) | Sign up |
| News sentiment (TTM) | — |
| Quality score | 72.7% |
| Insiders | |
|---|---|
| Buys, 1w | Sign up |
| Buys, 1m | Sign up |
| Buys, 1y | Sign up |
| Sells, 1w | Sign up |
| Sells, 1m | Sign up |
| Sells, 1y | Sign up |
Sign up to see this company's insider trades
| Figure | FY 2025 | FY 2024 | FY 2023 | FY 2022 | FY 2021 | FY 2020 | FY 2019 | FY 2018 | FY 2017 | FY 2016 | FY 2015 | FY 2014 | FY 2013 |
|---|---|---|---|---|---|---|---|---|---|---|---|---|---|
| Revenue | 821.855B | 601.788B | 566.501B | 345.892B | 193.9B | 144.399B | 155.436B | 124.821B | 102.242B | 73.645B | 50.557B | 48.482B | 21.324B |
| Net profit | 160.562B | 97.759B | 105.467B | 67.484B | 67.461B | 29.534B | 31.302B | 23.845B | 16.369B | 8.38B | 3.19B | 7.702B | -3.713B |
| Free cash flow | 118.088B | — | — | — | — | 18.404B | 49.196B | — | — | — | — | — | — |
Filed figures
Lines the statements and their notes report beside the headline figures, read from the filings' XBRL as filed (no restatement applied), with figures computed from one filing's own lines. Cash-flow lines carry their cash direction: an outflow is negative. Each period links to its filing; a figure's period, report date and tag are in its tooltip.
| Figure | Dec 2016 | Dec 2017 | Dec 2018 | Dec 2019 | Dec 2020 | Dec 2021 | Dec 2022 | Dec 2023 | Dec 2024 | Dec 2025 |
|---|---|---|---|---|---|---|---|---|---|---|
| Balance sheet detail | ||||||||||
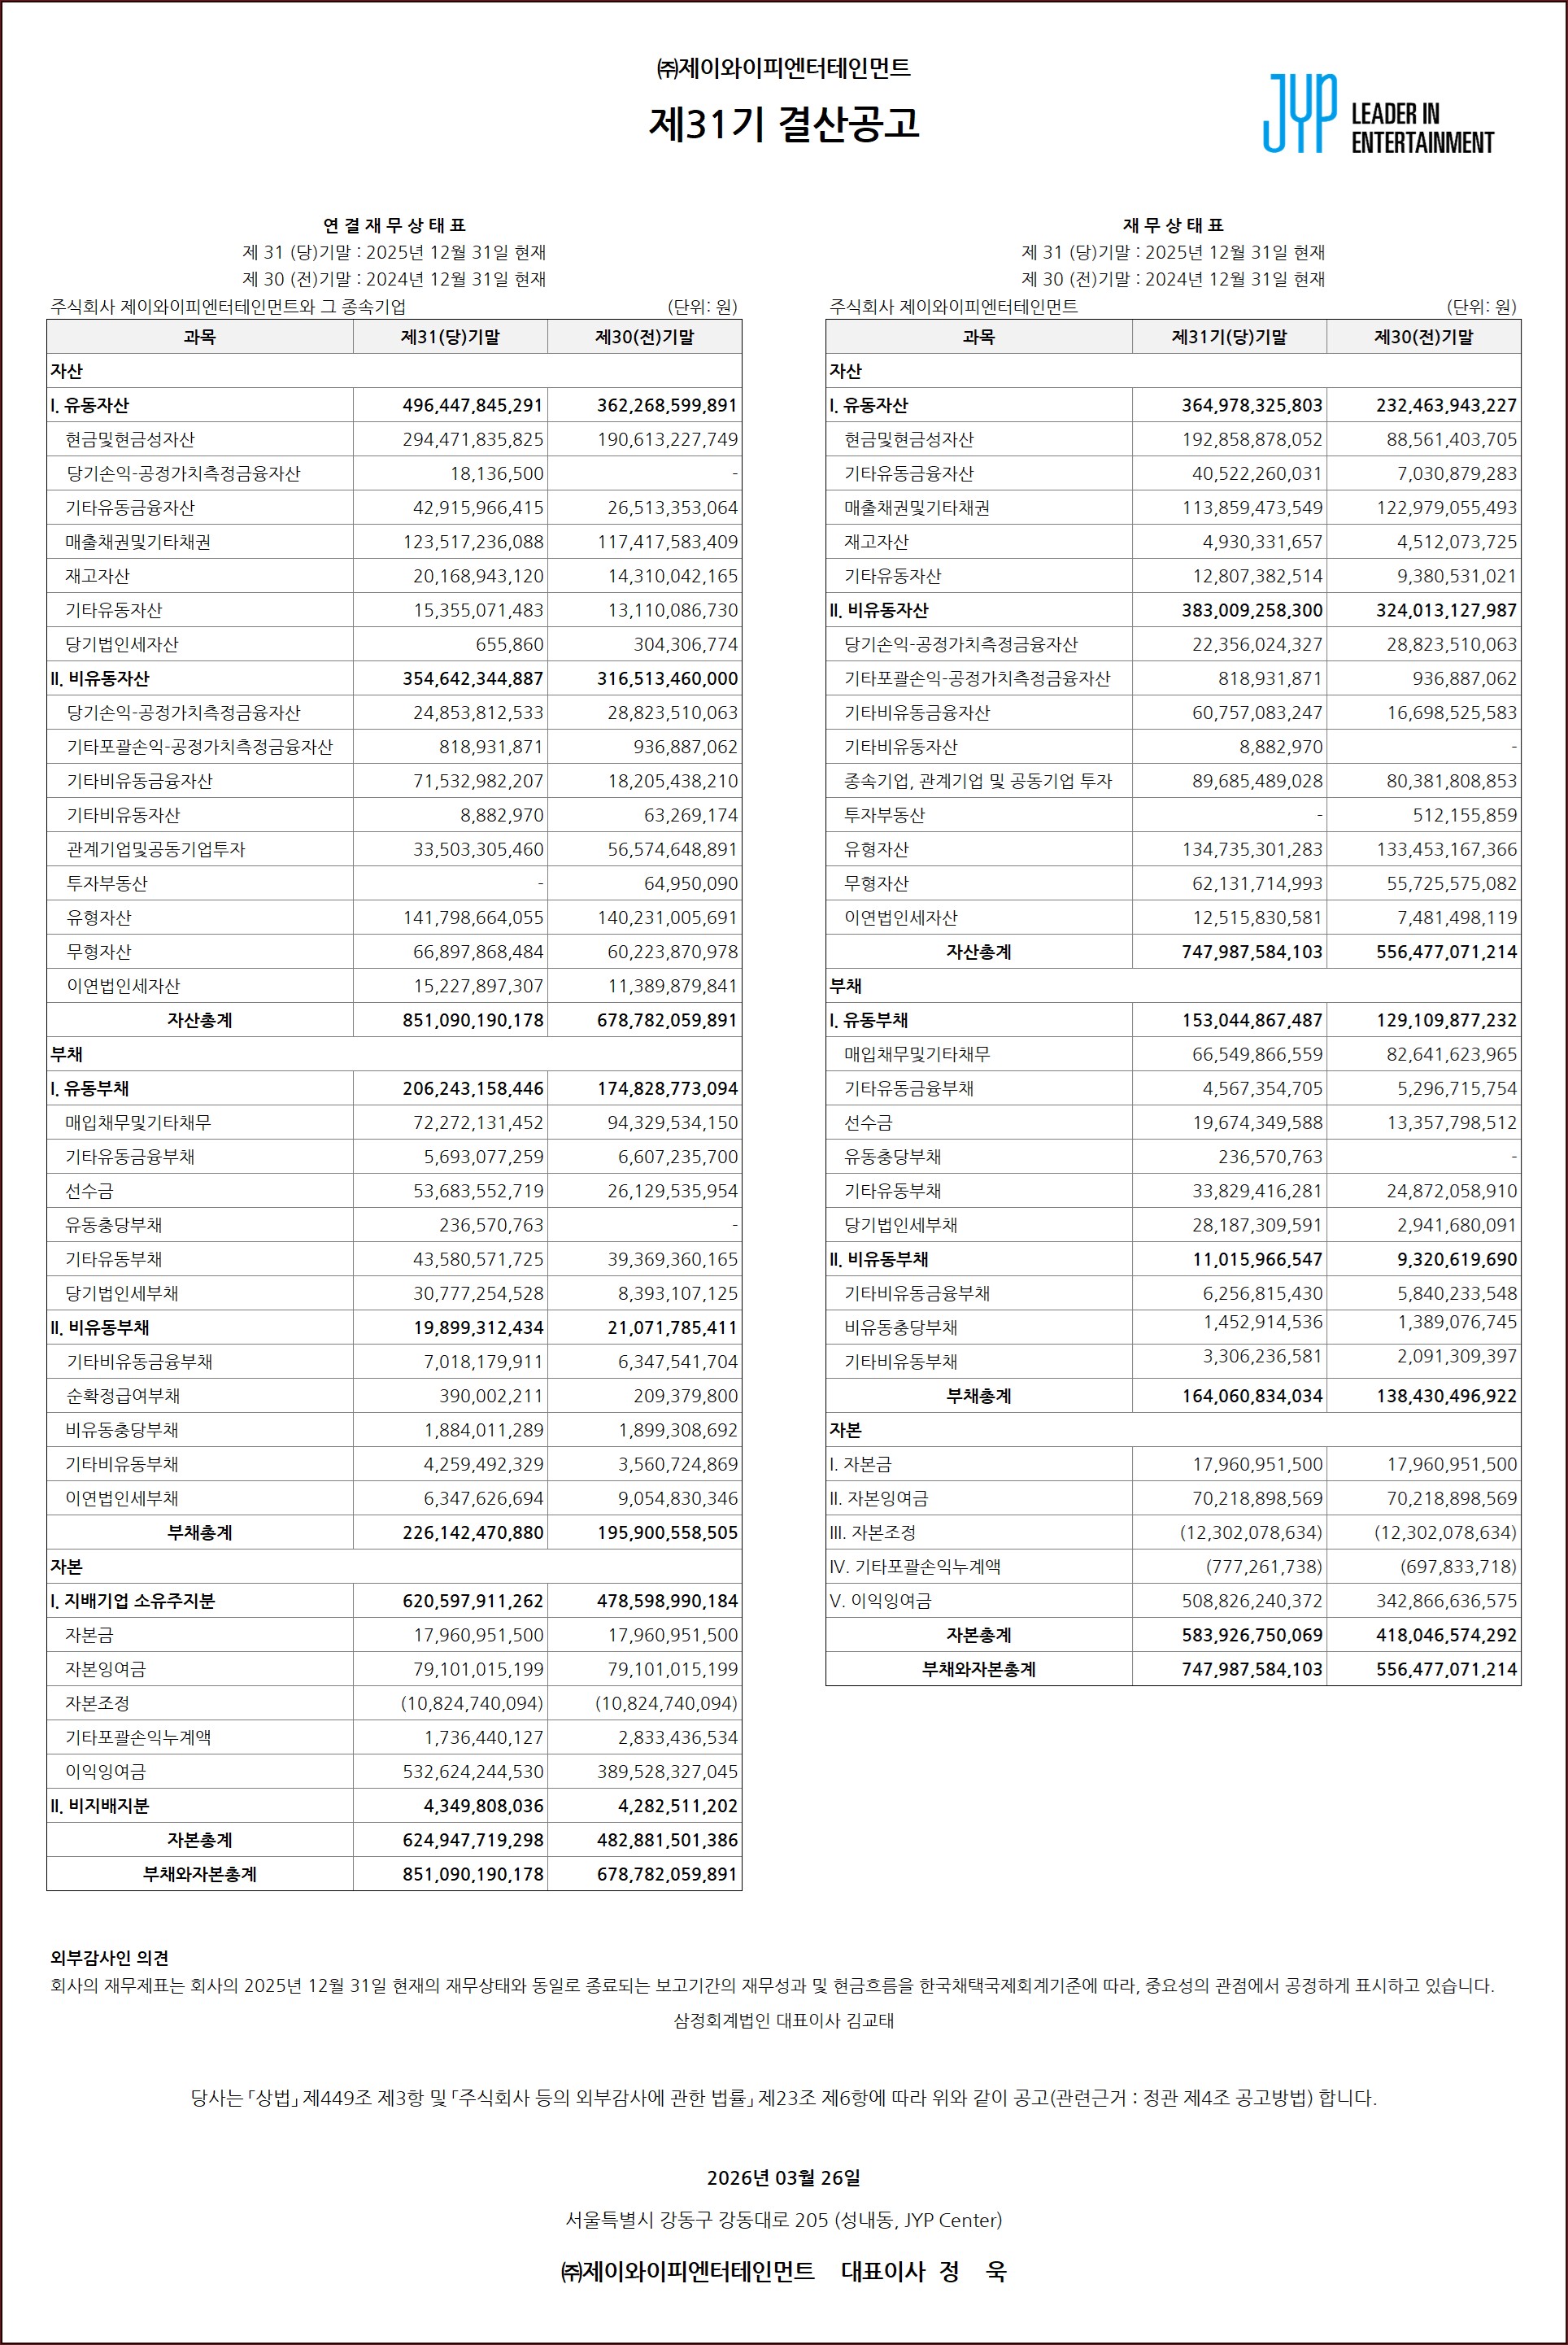
| Trade receivables (KRW) | 7.6B | 11.1B | 13.9B | 14.3B | 19.5B | 46.9B | 68.2B | 71B | 117B | 124B |
| ↳ YoY growth | +7.7% | +45.5% | +25.7% | +3.1% | +35.9% | +141.3% | +45.3% | +4.2% | +65.3% | +5.2% |
| ↳ 5y CAGR | +10.1% | +17.1% | +22.5% | +43.9% | +43.9% | +38.6% | +52.3% | +44.7% | ||
| Cash and deposits (KRW) | 24.8B | 25.4B | 45B | 38.7B | 34.5B | 49.1B | 140B | 217B | 191B | 294B |
| Intangible assets (KRW) | — | — | — | — | — | — | — | 40.6B | 60.2B | 66.9B |
| Cash flow detail | ||||||||||
| Operating cash flow (KRW) | 15.4B | 27.1B | 22.4B | 50.9B | 22.1B | 45.8B | 87.6B | 151B | 89.3B | 124B |
| Purchases of property, plant and equipment (KRW) | — | -24.8B | -12.8B | -1.75B | -3.66B | — | — | -12.3B | -87.3B | -6.24B |
| Purchases of intangible assets (KRW) | — | -728M | -250M | -216M | -333M | — | — | -709M | -24.1B | -16.3B |
| Change in receivables (cash effect) (KRW) | — | — | — | — | — | -28.8B | -24.2B | 17.6B | -39.2B | -6.16B |
| Change in inventories (cash effect) (KRW) | -445M | -281M | 172M | 791M | -194M | -985M | -919M | -21.9B | 2.72B | -9.4B |
| Change in payables (cash effect) (KRW) | — | — | — | — | — | 3.53B | 18.5B | 3.65B | 35.8B | -21.9B |
| Dividends paid (cash effect) (KRW) | — | — | 0.00 | -4.02B | -5.13B | -5.1B | -12.2B | -12.2B | -19B | -17.7B |
| Interest paid (cash effect) (KRW) | — | — | — | — | — | — | -90.5M | -237M | -472M | -388M |
| Income taxes paid (cash effect) (KRW) | -2.15B | -3.79B | -8.06B | -3.71B | -14.5B | -11.1B | -20.7B | -43.7B | -55.2B | -46.8B |
| Share-based compensation (KRW) | 185M | 3.37B | 4.12B | 85.3M | 0.00 | 67.3M | 315M | 248M | 0.00 | 0.00 |
| Operating cash flow before change in receivables (KRW) | — | — | — | — | — | 74.6B | 112B | 134B | 128B | 130B |
| Free cash flow (OCF - PPE - intangibles) (KRW) | — | 1.61B | 9.57B | 49B | 18.1B | — | — | 138B | -22.1B | 102B |
| Income detail | ||||||||||
| Total comprehensive income (KRW) | 8.25B | 16.2B | 24.5B | 31.9B | 29B | 69.3B | 63.8B | 105B | 103B | 160B |
| Comprehensive income to owners (KRW) | 8.08B | 16B | 24B | 31.9B | 28.9B | 68.9B | 63.8B | 105B | 103B | 160B |
| Provision for credit losses (KRW) | 160M | -120M | 227M | 182M | 2.03M | 905M | -752M | -5.76M | 41M | 351M |
| Credit cost ratio (credit losses / average receivables) (%) | 2.2% | 1.3% | 1.8% | 1.3% | 0.0% | 2.7% | 1.3% | 0.0% | 0.0% | 0.3% |
| Reported | Mar 30, 2018 | Mar 31, 2020 | Mar 18, 2021 | Mar 31, 2020 | Mar 18, 2021 | Mar 18, 2024 | Mar 18, 2024 | Mar 18, 2026 | Mar 18, 2026 | Mar 18, 2026 |
Sign up to see institutional holdings
Sign UpPodcast Mentions
Sign up to see podcast mentions and sentiment
Sign UpDisclosures filed with DART (material events and exchange disclosures), newest first, headlines as filed in Korean. The link opens the filing on DART. Press releases from the company's own website, newest first.
Prompts
Click prompts to add them under the company line, click again to take one out, then copy the result into your AI chat. Shared by Asian Century Stocks and Uncovered Thai Stocks. Thank you.
JYP Ent. (ticker 035900), listed in South Korea.
Copied
ETFs Holding JYP Ent.
Exchange-traded funds whose newest published daily portfolio holds one of the company's listings, largest weight first.
| ETF | Weight in ETF | Shares | Market value | As of |
|---|---|---|---|---|
| AVEE | 0.05% | 2,164 | $ 70.314K | Nov 16, 2026 |
| DFSE | 0.04% | 6,750 | $ 228.814K | Nov 12, 2026 |
| DFEV | 0.04% | 22,942 | $ 777.695K | Nov 12, 2026 |
| DFEM | 0.02% | 53,760 | $ 1.822M | Nov 12, 2026 |
| AVSE | 0.02% | 1,001 | $ 32.525K | Nov 16, 2026 |
| DFAE | 0.01% | 33,552 | $ 1.137M | Nov 12, 2026 |
| AVEM | 0.01% | 85,449 | $ 2.776M | Nov 16, 2026 |
| AVES | 0.01% | 5,779 | $ 187.775K | Nov 16, 2026 |
| AVXC | 0.01% | 919 | $ 29.861K | Nov 16, 2026 |
| DEXC | 0.01% | 746 | $ 25.288K | Nov 12, 2026 |
| DFAX | 0.01% | 19,546 | $ 662.576K | Nov 12, 2026 |