[기재정정]신규시설투자등
Bull 0
Bear 0
Routine
034220
|
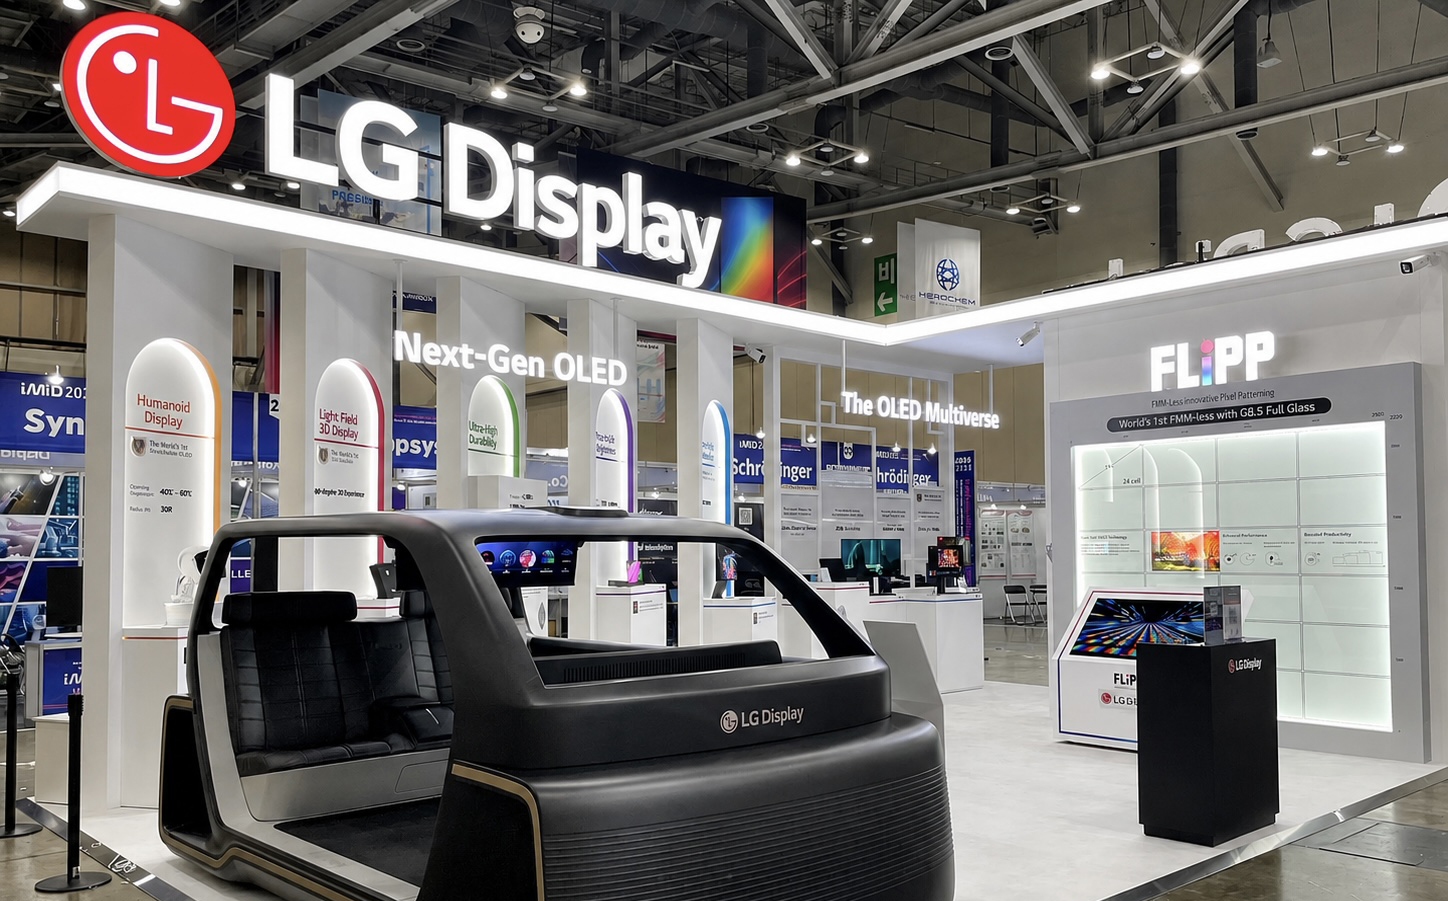
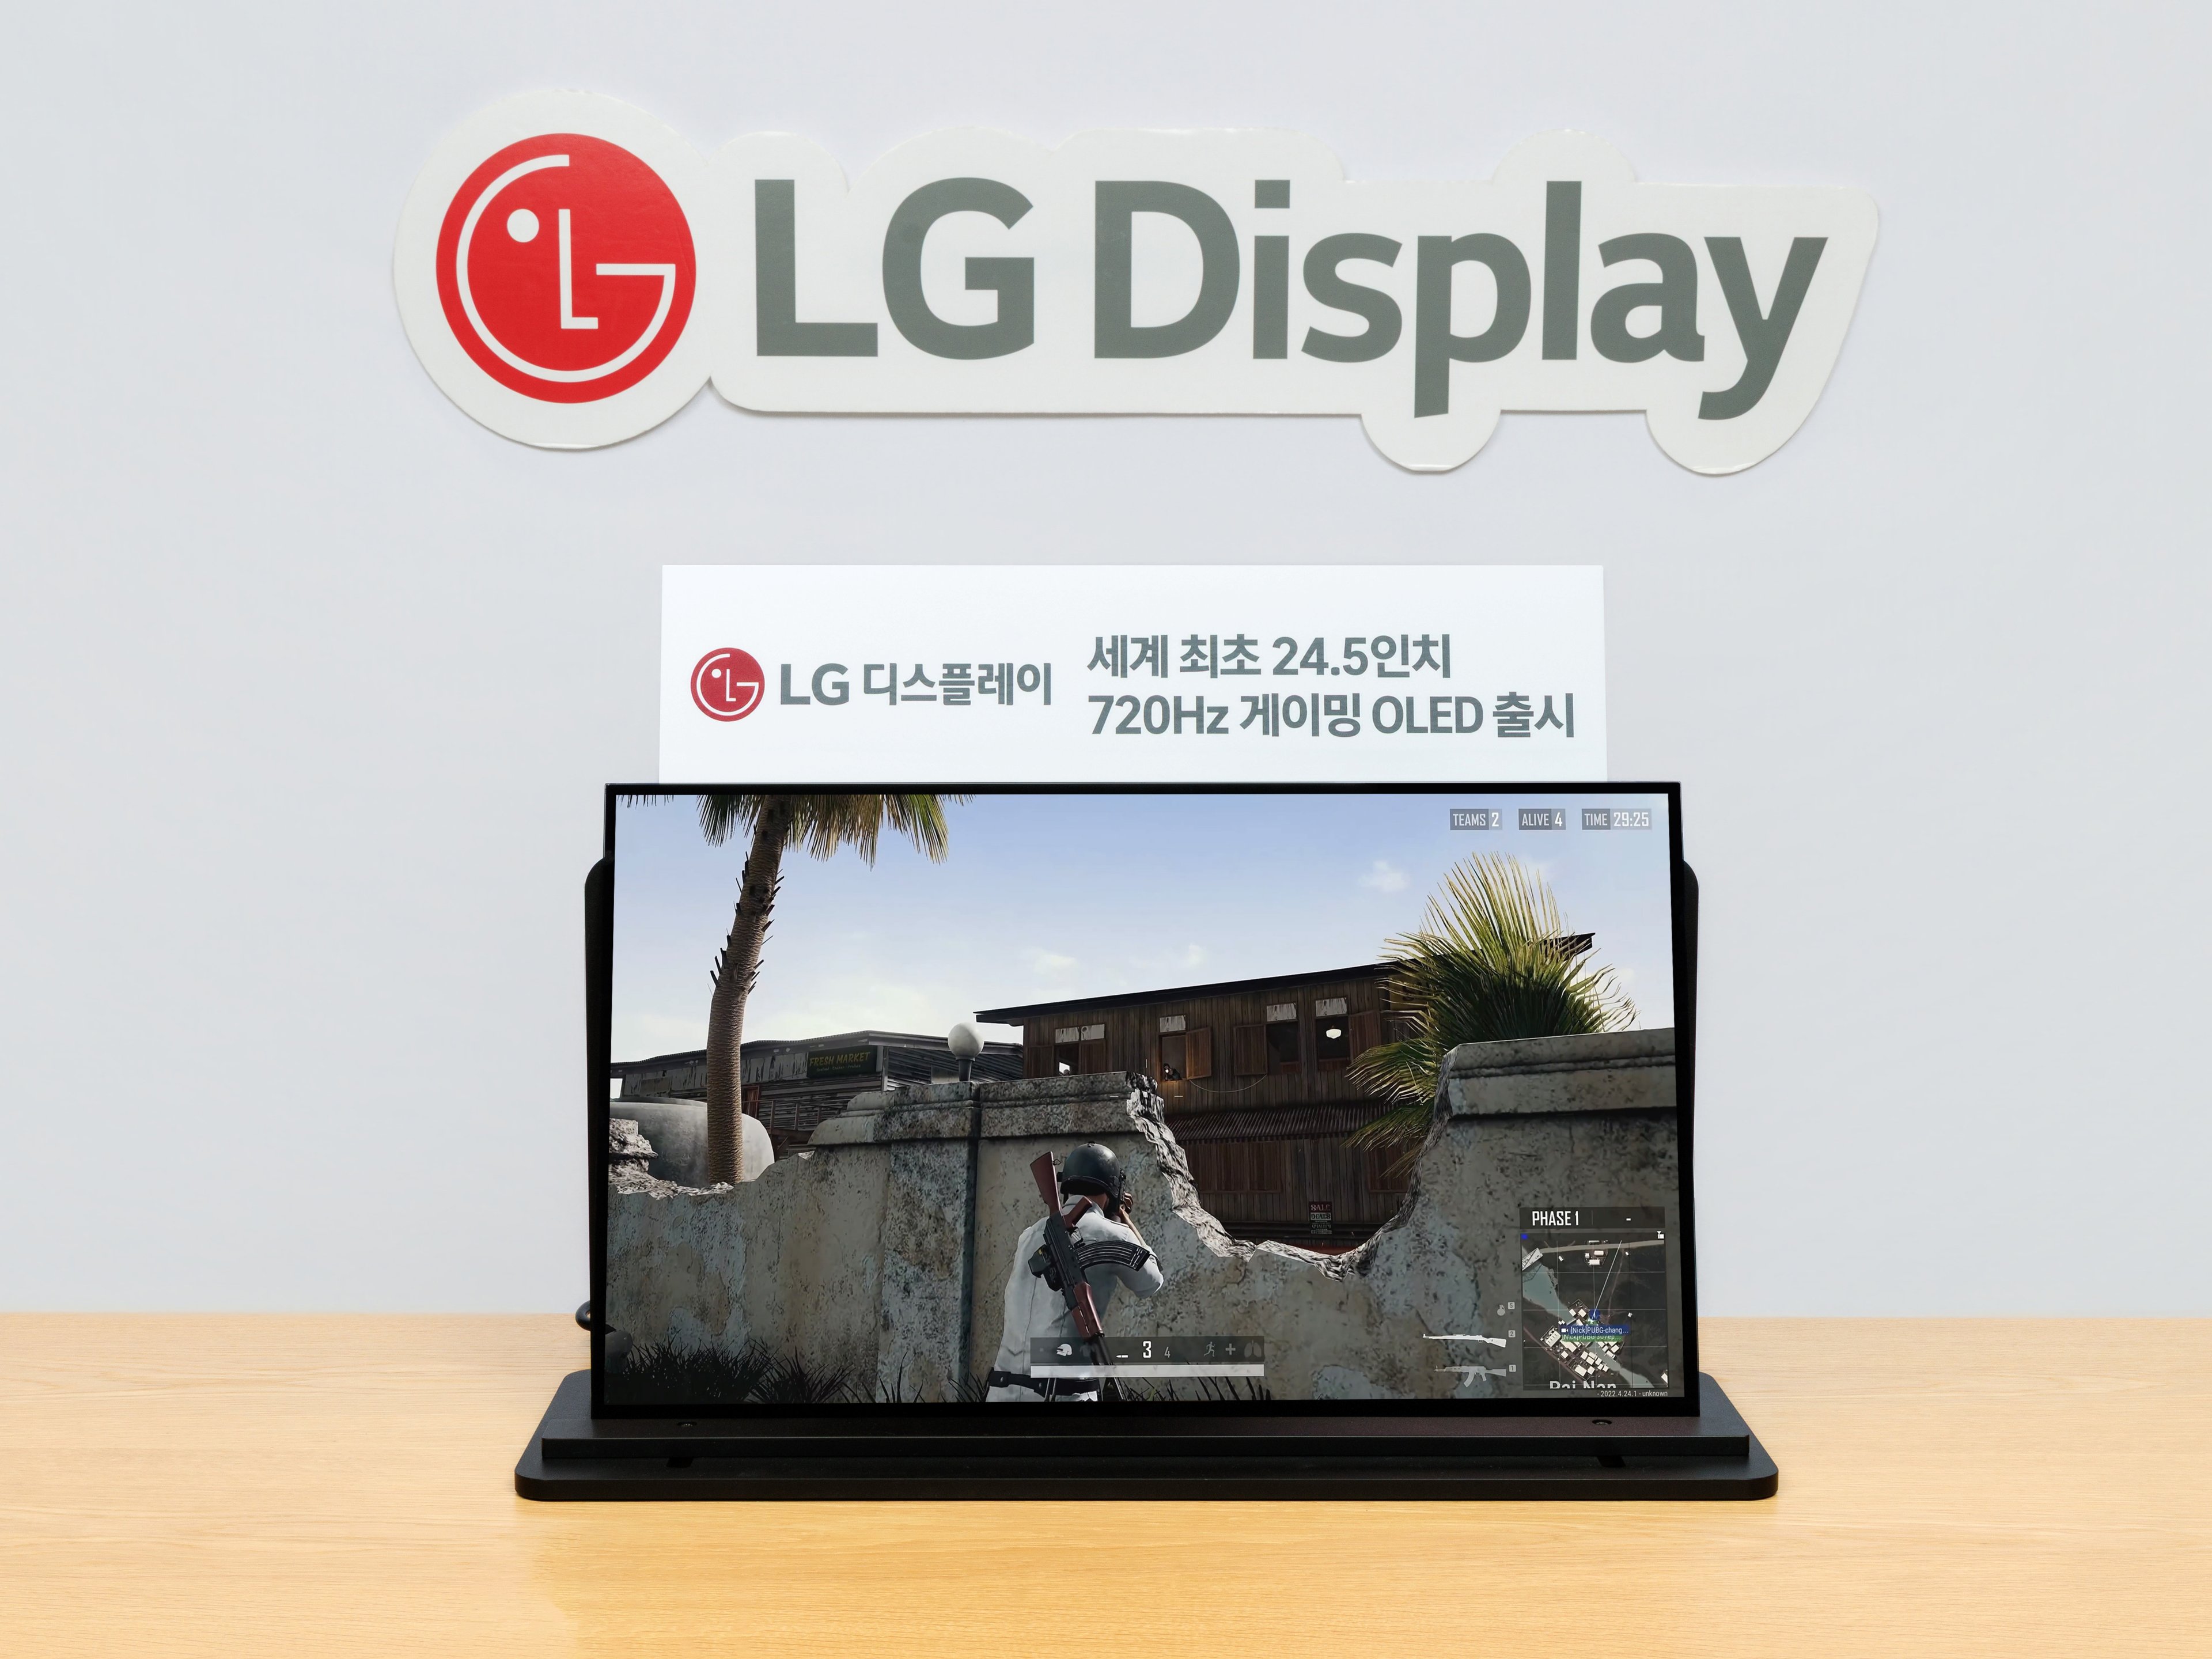
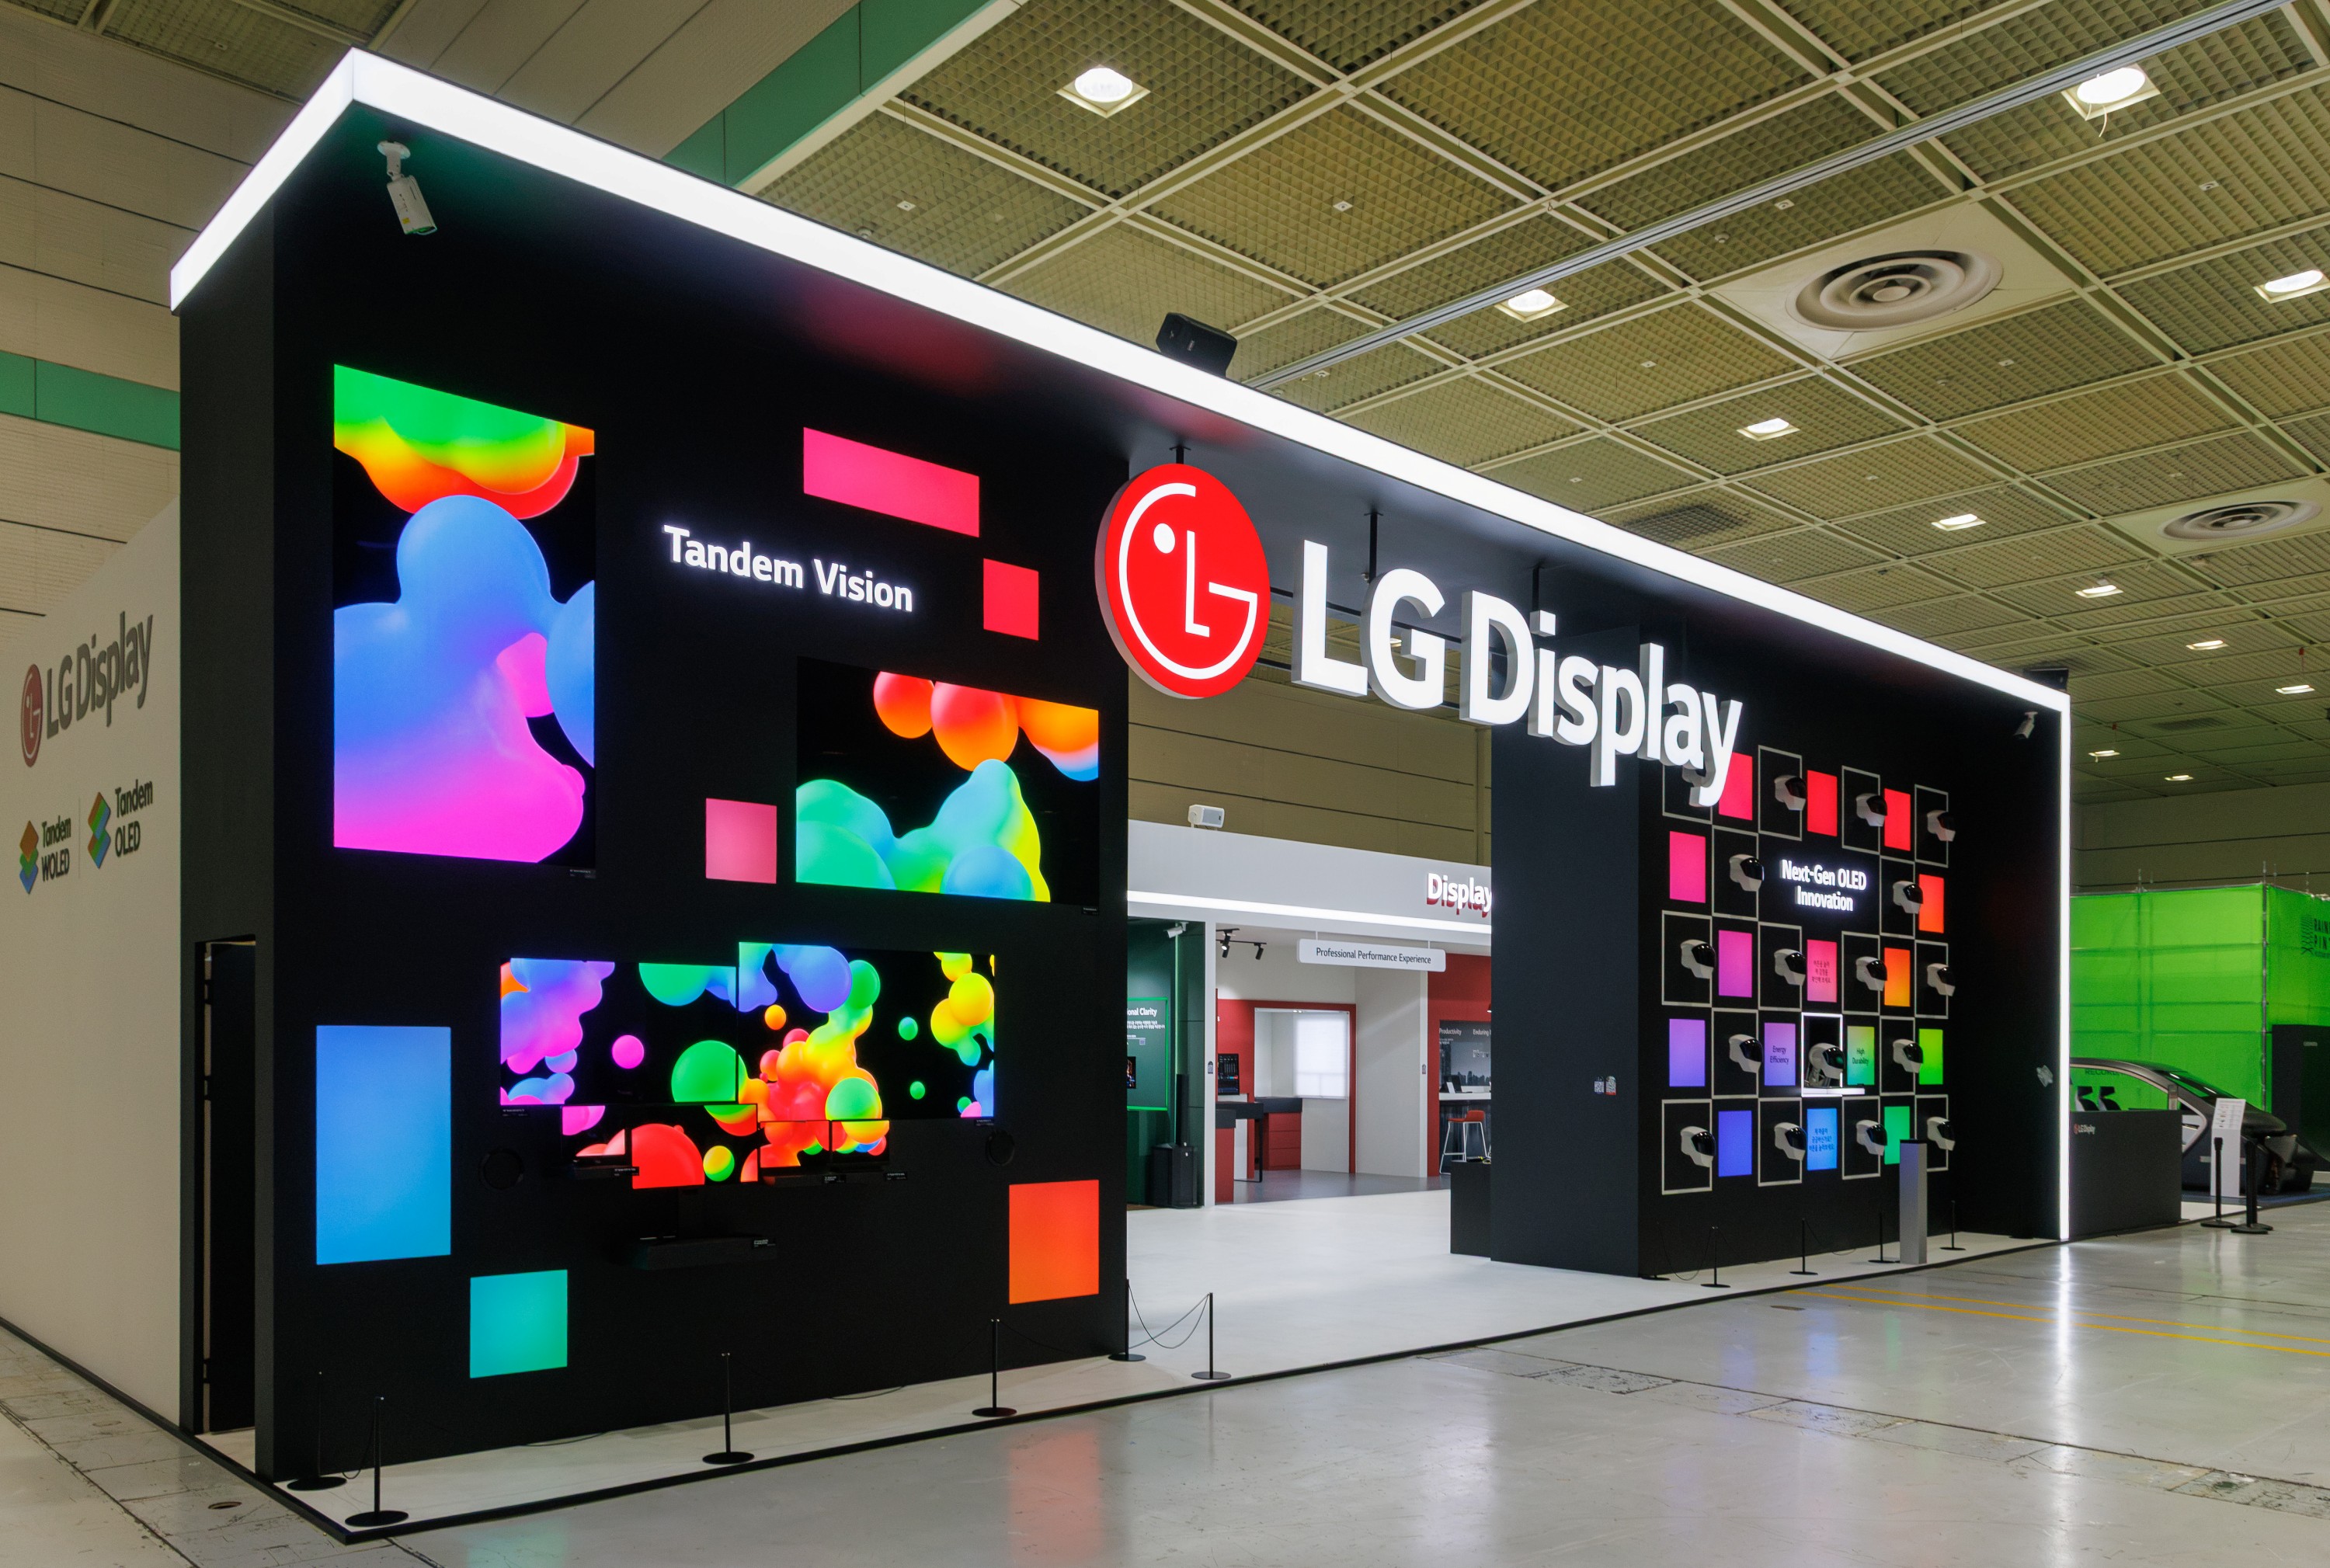
LG Display is a South Korean manufacturer of display panels, specializing in OLED and TFT-LCD technologies. The company develops, manufactures, and sells display products for four main segments: TV, IT, Mobile, and Automotive. Key technologies include WOLED, Plastic OLED, IPS, Oxide, and in-TOUCH. LG Display serves global set makers and system assemblers, with major customers including leading electronics brands. The company operates production facilities in South Korea, China, and Vietnam, and maintains sales subsidiaries in the United States, Germany, Japan, Taiwan, China, and Singapore. LG Display supplies panels for applications ranging from large-format TVs and gaming displays to high-resolution IT monitors, smartphones, smartwatches, and automotive infotainment systems. The company engages in strategic partnerships for patent licensing with entities such as Semiconductor Energy Laboratory, AU Optronics, and Hannstar. LG Display was formerly known as LG Philips LCD before being renamed in 2013. Summarised from the company's own disclosures, fiscal year ended Mar 2026 |
Industry Electronic Components | Homepage lgdisplay.com |
| Sector Technology | IR page lgdisplay.com/kor | |
|
Tags
oled, tft-lcd, display panels, tv displays, it displays, mobile displays, automotive displays, plastic oled, wored, ips, oxide, in-touch, LG Display (China) Co. Ltd., LG Display Vietnam, LG Display US, LG Display Germany, LG Display Japan, LG Display Taiwan, LG Display Singapore, LG Display Korea, LG Display Automotive, LG Display IT, LG Display Mobile, LG Display TV
|
Press page — |
Metrics
| Valuation | |
|---|---|
| Market cap | ₩ 7.685T |
| Market cap (USD) | $ 5.656B |
| P/E | -5.68 |
| PEG | — |
| P/BV | 1.22 |
| P/S | 0.30 |
| P/OCF | 2.47 |
| P/FCF | 5.06 |
| Dividend yield | — |
| Turnover / mcap | — |
| Returns | |
|---|---|
| ROE | 3.4% |
| ROI | 3.4% |
| ROIC | 4.7% |
| Profit margin | 0.88% |
| Growth | |
|---|---|
| Revenue growing | No |
| Profits growing | Yes |
| Revenue up 3y | No |
| Revenue up 5y | No |
| Earnings growth 3y (net profit CAGR) | — |
| Quality | |
|---|---|
| Profitable | Yes |
| Margin expanding | Yes |
| Buying back stock | No |
| Diluting (TTM) | No |
| Debt/Equity | — |
| Podcast bulls (TTM) | Sign up |
| Podcast bears (TTM) | Sign up |
| Podcast sentiment (TTM) | Sign up |
| Podcast sentiment % (TTM) | Sign up |
| News sentiment (TTM) | — |
| Quality score | 11.8% |
| Insiders | |
|---|---|
| Buys, 1w | Sign up |
| Buys, 1m | Sign up |
| Buys, 1y | Sign up |
| Sells, 1w | Sign up |
| Sells, 1m | Sign up |
| Sells, 1y | Sign up |
Sign up to see this company's insider trades
| Figure | FY 2025 | FY 2024 | FY 2023 | FY 2022 | FY 2021 | FY 2020 | FY 2019 | FY 2018 | FY 2017 | FY 2016 | FY 2015 | FY 2014 | FY 2013 |
|---|---|---|---|---|---|---|---|---|---|---|---|---|---|
| Revenue | 25.81T | 26.615T | 21.331T | 26.152T | 29.878T | 24.23T | 23.476T | 24.337T | 27.79T | 26.504T | 28.384T | 26.456T | 27.033T |
| Net profit | 226.312B | -2.563T | -2.734T | -3.072T | 1.186T | -89.342B | -2.83T | -207.239B | 1.803T | 906.713B | 966.553B | 904.268B | 426.118B |
| Free cash flow | 1.004T | 282.026B | -1.8T | -2.068T | 2.612T | -316.597B | -4.22T | -3.458T | 171.766B | -95.042B | 361.589B | -118.028B | 111.714B |
Filed figures
Lines the statements and their notes report beside the headline figures, read from the filings' XBRL as filed (no restatement applied), with figures computed from one filing's own lines. Cash-flow lines carry their cash direction: an outflow is negative. Each period links to its filing; a figure's period, report date and tag are in its tooltip.
| Figure | Dec 2016 | Dec 2017 | Dec 2018 | Dec 2019 | Dec 2020 | Dec 2021 | Dec 2022 | Dec 2023 | Dec 2024 | Dec 2025 |
|---|---|---|---|---|---|---|---|---|---|---|
| Balance sheet detail | ||||||||||
| Trade receivables (KRW) | 4.96T | 4.33T | 2.83T | 3.15T | 3.52T | 4.57T | 2.36T | 3.22T | 3.62T | 2.36T |
| ↳ YoY growth | +21.0% | -12.8% | -34.6% | +11.5% | +11.5% | +30.1% | -48.4% | +36.4% | +12.6% | -34.9% |
| ↳ 5y CAGR | -3.0% | -1.6% | -11.4% | +2.6% | +2.8% | -7.7% | ||||
| Other receivables (KRW) | 144B | 165B | 169B | 474B | 144B | — | 169B | 127B | 250B | 180B |
| Cash and deposits (KRW) | 1.56T | 2.6T | 2.37T | 3.34T | 4.22T | 3.54T | 1.82T | 2.26T | 2.02T | 1.57T |
| Intangible assets (KRW) | — | — | — | — | — | 1.64T | 1.75T | 1.77T | 1.56T | 1.48T |
| Cash flow detail | ||||||||||
| Operating cash flow (KRW) | 3.64T | 6.76T | 4.48T | 2.71T | 2.29T | 5.75T | 3.01T | 1.68T | 2.41T | 2.35T |
| Purchases of property, plant and equipment (KRW) | -3.74T | -6.59T | -7.94T | -6.93T | -2.6T | -3.14T | -5.08T | -3.48T | -2.13T | -1.35T |
| Purchases of intangible assets (KRW) | -405B | -454B | -481B | -541B | -353B | -636B | -831B | -672B | -787B | -759B |
| Change in receivables (cash effect) (KRW) | -554B | 485B | 1.3T | -1.01T | -936B | -964B | 1.83T | -1.01T | — | — |
| Change in inventories (cash effect) (KRW) | 106B | -56B | -450B | 632B | -128B | -1.12T | 391B | 337B | — | — |
| Change in payables (cash effect) (KRW) | -48B | 221B | 156B | 1.64T | 234B | 1.11T | -908B | 276B | — | — |
| Dividends paid (cash effect) (KRW) | -179B | -179B | -179B | 0.00 | 0.00 | 0.00 | -233B | 0.00 | 0.00 | — |
| Interest paid (cash effect) (KRW) | -126B | -136B | -212B | -416B | -552B | -470B | -501B | -991B | -916B | -711B |
| Income taxes paid (cash effect) (KRW) | -188B | -417B | -487B | -253B | -157B | -118B | -154B | -290B | -140B | -161B |
| Operating cash flow before change in receivables (KRW) | 4.19T | 6.28T | 3.18T | 3.71T | 3.22T | 6.72T | 1.18T | 2.7T | — | — |
| Free cash flow (OCF - PPE - intangibles) (KRW) | -500B | -283B | -3.94T | -4.76T | -670B | 1.98T | -2.9T | -2.47T | -505B | 245B |
| Income detail | ||||||||||
| Research and development expense (KRW) | — | — | — | — | — | 1.22T | 1.38T | 1.38T | 1.45T | 1.41T |
| Total comprehensive income (KRW) | 953B | 1.7T | -195B | -2.67T | 87.8B | 2.04T | -3.15T | -2.51T | -1.61T | 196B |
| Comprehensive income to owners (KRW) | 942B | 1.6T | -215B | -2.64T | 59.7B | 1.72T | -3.01T | -2.65T | -1.92T | 94.6B |
| Reported | Apr 1, 2019 | Aug 14, 2018 | Apr 1, 2019 | Mar 30, 2020 | Mar 15, 2021 | Mar 14, 2024 | Mar 14, 2024 | Nov 14, 2024 | Mar 12, 2025 | Mar 11, 2026 |
Sign up to see institutional holdings
Sign UpPodcast Mentions
Sign up to see podcast mentions and sentiment
Sign UpDisclosures filed with DART (material events and exchange disclosures), newest first, headlines as filed in Korean. The link opens the filing on DART. Press releases from the company's own website, newest first.
기업가치제고계획예고(안내공시)
Bull 0
Bear 0
Routine
LG디스플레이, 생물다양성 보전을 위한 업무협약 체결
Bull 0
Bear 0
Routine
프레스센터 / 2026. 11. 03 2026. 11. 03 / AX , LG Display , LG디스플레이 , OLED , 생물다양성
■ 국립생태원과 파주 사업장 인근 생태계 보전·복원 및 자연자본 공시 대응 위한 업무협약 체결
■ DMZ 민통선 내 멸종 위기 종인 두루미/재두루미 서식지 조성·관리
■ 김성희 CSEO, “기업 활동이 자연에 미치는 영향을 체계적으로 파악하고, 지역 생태계 보전으로 이어지는 환경경영을 실천할 것”

LG디스플레이(대표이사 사장 정철동/www.lgdisplay.com )가 파주 사업장 인근 생물다양성 보전을 위해 국립생태원과 손잡고 체계적인 자연환경 관리 시스템을 갖춘다.
LG디스플레이는 기후에너지환경부 산하 국립생태원과 사업장 인근 생태계 보전·복원 및 자연자본 공시 (TNFD) 대응을 위한 업무협약을 체결했다고 3일 밝혔다.
이번 협약을 통해 LG디스플레이는 전문기관인 국립생태원과 △자연자본 공시 평가를 위한 생태정보·교육·자문 제공 △사업장 인근 생태계 보전·복원사업 공동 발굴 등을 함께 추진하게 된다. 평가를 통해 확인한 과제를 실제 생태계 보호 활동에 반영하고, 그 성과를 지속가능경영 공시에도 활용한다.
자연자본 공시는 기업의 경영활동이 자연환경과 생물다양성에 미치는 영향과 자연환경 변화로 인해 기업이 받게 되는 재무적 위험·기회를 체계적으로 파악해 공개하는 것으로, 지난 2021년 출범한 ‘자연 관련 재무정보 공개 협의체(TNFD)’를 통해 국제적으로 확산되고 있다.
대표적으로 LG디스플레이는 파주 사업장과 인접한 DMZ 민통선 내 멸종 위기 종인 두루미∙재두루미 서식지 조성·관리를 통해 멸종 위기 종 개체 복원 활동을 펼칠 계획이다. 이 밖에도 국립생태원의 전문성을 바탕으로 공시의 기초가 되는 환경정보를 체계적으로 관리하고, 사업장 주변 생물다양성 보전활동을 구체화할 예정이다.
한편, LG디스플레이는 글로벌 패널 공급사로서 제품이 환경에 미치는 영향을 최소화하기 위한 AX 혁신을 통해 친환경 경영에도 속도를 내고 있다. 원료, 제조, 운반, 사용, 폐기 단계에 이르는 제품의 생애주기 전 과정에 대해 친환경성을 측정하는 ‘전 과정 평가(Life Cycle Assessment, LCA)’에 AX를 접목하여 제품 탄소배출량 산출 데이터를 체계적으로 관리하고 제품 생애주기 별 탄소 배출량이 자동으로 계산 및 요약될 수 있도록 시스템화 했다.
LG디스플레이 김성희 최고안전환경책임자(CSEO)는 “생물다양성 보전은 기업의 지속가능한 성장을 위한 중요한 과제”라며 “국립생태원과의 협력을 통해 기업 활동이 자연에 미치는 영향을 체계적으로 파악하고, 지역 생태계 보전으로 이어지는 환경경영을 실천하겠다”고 말했다.
TAGS AX , LG Display , LG디스플레이 , OLED , 생물다양성
글 내비게이션
Related Posts

[‘기술 중심 회사’ LG디스플레이, \
SID ‘칼 페르디난드 브라운상’ 수상 및 석학회원 선정 영예](https://news.lgdisplay.com/2026/03/2603191156/)

[LG디스플레이 윤수영 CTO, \
제16회 디스플레이의 날 ‘은탑산업훈장’ 수훈](https://news.lgdisplay.com/2025/09/lg%eb%94%94%ec%8a%a4%ed%94%8c%eb%a0%88%ec%9d%b4-%ec%9c%a4%ec%88%98%ec%98%81-cto-%ec%a0%9c16%ed%9a%8c-%eb%94%94%ec%8a%a4%ed%94%8c%eb%a0%88%ec%9d%b4%ec%9d%98-%eb%82%a0-%ec%9d%80%ed%83%91/)

[“차별적 고객가치 적용한 새로운 드라이빙 경험” \
LG디스플레이, ‘초대형 차량용 디스플레이 설루션’ 40인치 필러투필러(Pillar to Pillar, P2P) 양산](https://news.lgdisplay.com/2025/02/%ec%b0%a8%eb%b3%84%ec%a0%81-%ea%b3%a0%ea%b0%9d%ea%b0%80%ec%b9%98-%ec%a0%81%ec%9a%a9%ed%95%9c-%ec%83%88%eb%a1%9c%ec%9a%b4-%eb%93%9c%eb%9d%bc%ec%9d%b4%eb%b9%99-%ea%b2%bd%ed%97%98-lg/)
SUBSCRIBE
KOR


ENG

COPYRIGHT © 2021 LG DISPLAY CO., LTD.
ALL RIGHTS RESERVED.

Privacy Policy User Guide Direct Marketing
COPYRIGHT © 2021 LG DISPLAY CO., LTD. ALL RIGHTS RESERVED.
SUBSCRIBE


COPYRIGHT © 2021 LG DISPLAY CO., LTD. ALL RIGHTS RESERVED.

Search for:
추천 검색어 : K-display 2026 | 탠덤 WOLED | 탠덤 OLED | 휴머노이드 |
Scroll to Top
이 사이트는 쿠키를 사용합니다. 사이트를 서치하는 것은 당사 쿠키 사용에 동의한 것으로 판단합니다. 자세한 내용은 다음을 참조하십시오.개인정보 처리방침 닫기








 Strictly Necessary Cookies


 기업정보
 제품
 기술
 ESG
 채용
 투자정보
 뉴스룸




Prompts
Click prompts to add them under the company line, click again to take one out, then copy the result into your AI chat. Shared by Asian Century Stocks and Uncovered Thai Stocks. Thank you.
LG Display (ticker 034220), listed in South Korea.
Copied
ETFs Holding LG Display
Exchange-traded funds whose newest published daily portfolio holds one of the company's listings, largest weight first.
| ETF | Weight in ETF | Shares | Market value | As of |
|---|---|---|---|---|
| EMMF | 0.42% | 100,813 | $ 750.257K | Jun 30, 2026 |
| DEXC | 0.03% | 15,569 | $ 83.202K | Nov 12, 2026 |
| NTSE | 0.03% | 2,104 | $ 15.658K | Jun 30, 2026 |
| DFEM | 0.03% | 433,389 | $ 2.316M | Nov 12, 2026 |
| DFEV | 0.02% | 75,121 | $ 401.451K | Nov 12, 2026 |
| DFAE | 0.02% | 290,063 | $ 1.55M | Nov 12, 2026 |
| DEHP | 0.01% | 6,733 | $ 35.982K | Nov 12, 2026 |
| DFAX | 0.01% | 187,555 | $ 1.002M | Nov 12, 2026 |