분기보고서 (2026.09)
Bull 0
Bear 0
Routine
033500
|
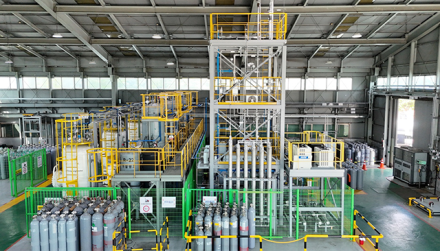
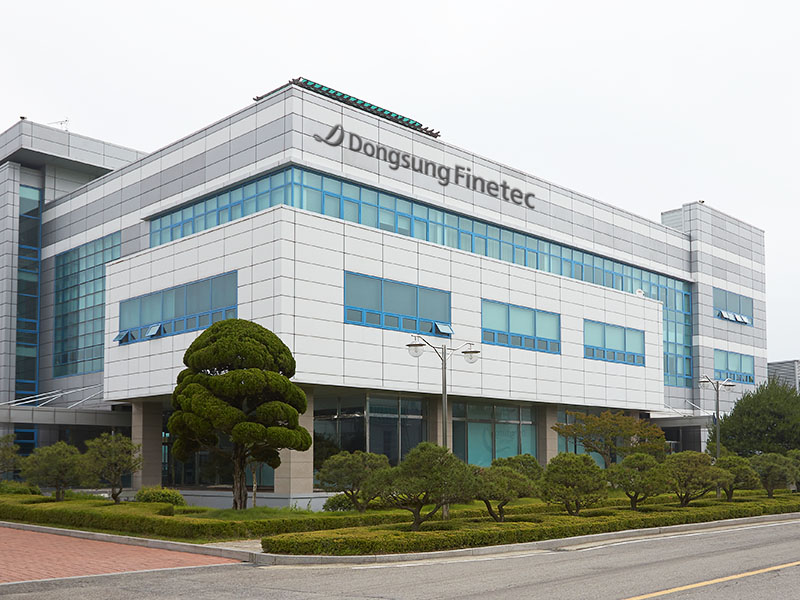
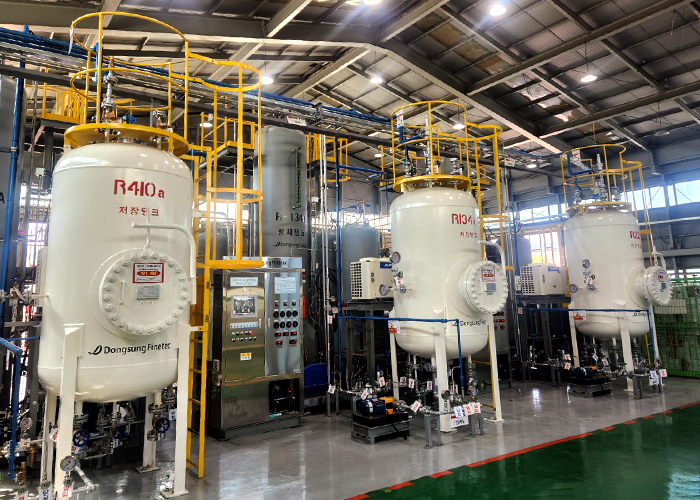
Dongsung Finetec is a South Korean manufacturer of cryogenic insulation materials and polyurethane systems. The company operates two main business segments: PU insulation and gas. The PU insulation segment produces cryogenic insulation materials for LNG carriers, LPG carriers, LNG fuel tanks for propulsion vessels, gas transport pipes, and onshore gas storage tanks. It also manufactures polyurethane (PU) and polyol systems for foam and non-foam applications in construction, home appliances, and industrial sectors. The gas segment involves the import, sub-packaging, and sale of fluorinated refrigerants, including HCFC, HFC, and HFO series, as well as a refrigerant recycling business. The company supplies intermediate materials to shipbuilders, construction firms, and electronics manufacturers. Key customers include major domestic shipbuilders, Samsung Electronics, LG Electronics, Hyundai Motor, Kia, HD Hyundai Infracore, and SK Hynix. Dongsung Finetec is part of the Dongsung Chemical group and operates production facilities in Anseong and Tongyeong for insulation materials and Ulsan for gas products. Summarised from the company's own disclosures, fiscal year ended Mar 2026 |
Industry Specialty Chemicals | Homepage dsfinetec.co.kr |
| Sector Basic Materials | IR page dsfinetec.co.kr | |
|
Tags
cryogenic insulation, polyurethane systems, refrigerants, lng carriers, shipbuilding materials, refrigerant recycling, b2b materials, industrial insulation, Dongsung Chemical, Genewell
|
Press page dsfinetec.co.kr/en/sub/news |
Metrics
| Valuation | |
|---|---|
| Market cap | — |
| Market cap (USD) | — |
| P/E | — |
| PEG | — |
| P/BV | — |
| P/S | — |
| P/OCF | — |
| P/FCF | — |
| Dividend yield | — |
| Turnover / mcap | — |
| Returns | |
|---|---|
| ROE | 24.2% |
| ROI | 21.6% |
| ROIC | 21.4% |
| Profit margin | 7.5% |
| Growth | |
|---|---|
| Revenue growing | Yes |
| Profits growing | Yes |
| Revenue up 3y | Yes |
| Revenue up 5y | No |
| Earnings growth 3y (net profit CAGR) | 80.6% |
| Quality | |
|---|---|
| Profitable | Yes |
| Margin expanding | Yes |
| Buying back stock | — |
| Diluting (TTM) | — |
| Debt/Equity | — |
| Podcast bulls (TTM) | Sign up |
| Podcast bears (TTM) | Sign up |
| Podcast sentiment (TTM) | Sign up |
| Podcast sentiment % (TTM) | Sign up |
| News sentiment (TTM) | — |
| Quality score | 72.7% |
| Insiders | |
|---|---|
| Buys, 1w | Sign up |
| Buys, 1m | Sign up |
| Buys, 1y | Sign up |
| Sells, 1w | Sign up |
| Sells, 1m | Sign up |
| Sells, 1y | Sign up |
Sign up to see this company's insider trades
| Figure | FY 2025 | FY 2024 | FY 2023 | FY 2022 | FY 2021 | FY 2020 | FY 2019 | FY 2018 | FY 2017 | FY 2016 | FY 2015 | FY 2014 | FY 2013 |
|---|---|---|---|---|---|---|---|---|---|---|---|---|---|
| Revenue | 742.186B | 597.41B | 531.409B | 439.007B | 365.039B | 387.986B | 253.272B | 188.129B | 230.97B | 335.005B | 347.135B | 420.799B | 409.45B |
| Net profit | 55.883B | 39.343B | 28.746B | 9.483B | 26.464B | 21.278B | 16.877B | -12.232B | -32.196B | 8.669B | 14.147B | 23.502B | 9.794B |
| Free cash flow | 69.063B | 44.334B | 64.595B | 5.004B | -6.109B | 54.839B | -12.647B | 15.541B | 16.238B | 8.169B | -410.09M | 23.095B | 37.65B |
Filed figures
Lines the statements and their notes report beside the headline figures, read from the filings' XBRL as filed (no restatement applied), with figures computed from one filing's own lines. Cash-flow lines carry their cash direction: an outflow is negative. Each period links to its filing; a figure's period, report date and tag are in its tooltip.
| Figure | Dec 2016 | Dec 2017 | Dec 2018 | Dec 2019 | Dec 2020 | Dec 2021 | Dec 2022 | Dec 2023 | Dec 2024 | Dec 2025 |
|---|---|---|---|---|---|---|---|---|---|---|
| Balance sheet detail | ||||||||||
| Trade receivables (KRW) | 78.6B | 49.2B | 19.4B | 30.8B | 22.4B | 43.1B | 37.8B | 40.5B | 82.9B | 61.1B |
| ↳ YoY growth | +20.1% | -37.4% | -60.5% | +58.9% | -27.4% | +92.6% | -12.3% | +7.2% | +104.6% | -26.3% |
| ↳ 5y CAGR | -24.1% | -12.9% | -19.3% | -11.3% | -5.1% | +15.9% | +21.9% | +22.2% | ||
| Borrowings, current (KRW) | 37B | 19.7B | 81.9B | 53.3B | 57.8B | 56.7B | 58.3B | 21.5B | 17.4B | — |
| Borrowings, non-current (KRW) | 33B | 44.7B | 4.5B | 50.1B | 1.63B | — | — | — | — | — |
| Bonds payable (KRW) | 0.00 | 0.00 | 0.00 | 34B | 32.9B | 9.17B | 2.1B | 0.00 | 0.00 | — |
| Lease liabilities (KRW) | — | 0.00 | 0.00 | 2.79B | 2.53B | 535M | 270M | 6.93B | 4.36B | 11B |
| Cash and deposits (KRW) | 3.2B | 14.3B | 14.6B | 23.1B | 23.7B | 23.2B | 27.1B | 26.9B | 57.4B | 80.8B |
| Intangible assets (KRW) | 1.2B | 958M | 712M | 719M | 477M | 526M | 429M | 599M | 503M | 822M |
| Right-of-use assets (KRW) | — | 0.00 | 0.00 | 2.77B | 925M | 514M | 286M | 6.76B | 4.12B | 10.9B |
| Net debt (borrowings + leases - cash) (KRW) | 66.8B | 50.1B | 71.7B | 83.1B | 38.3B | 34B | 31.5B | 1.52B | -35.7B | — |
| Cash flow detail | ||||||||||
| Operating cash flow (KRW) | 11.8B | 20.3B | 18.2B | -5.52B | 62.3B | -5.62B | 9.73B | 64.7B | 67.6B | 84.7B |
| Purchases of property, plant and equipment (KRW) | -3.65B | -4.09B | -2.67B | -7.12B | -7.43B | -492M | -22.8M | -130M | -23.2B | -15.6B |
| Purchases of intangible assets (KRW) | -62.3M | -151M | -68.9M | -178M | -38.3M | -33.7M | 0.00 | 0.00 | -296M | -501M |
| Change in receivables (cash effect) (KRW) | — | — | — | — | — | — | — | -242M | -42.1B | 21.7B |
| Change in inventories (cash effect) (KRW) | — | — | — | — | — | — | — | -22B | -7.66B | -12.4B |
| Change in payables (cash effect) (KRW) | — | — | — | — | — | — | — | -13.5B | 44.7B | -19.3B |
| Dividends paid (cash effect) (KRW) | -3.46B | -3.46B | 0.00 | 0.00 | -5.86B | -9.29B | -9.82B | -10.1B | -7.26B | -10.2B |
| Share buybacks (cash effect) (KRW) | 0.00 | 0.00 | 0.00 | 0.00 | -5B | — | — | — | — | — |
| Interest paid (cash effect) (KRW) | -2.56B | -2.8B | -2.96B | -2.53B | -1.63B | -925M | -1.48B | -4.24B | -1.46B | -621M |
| Income taxes paid (cash effect) (KRW) | -1.1B | -3.83B | -3.91M | -635M | -1.22B | -2.46B | -9.6B | -3.49B | -8.47B | -14.3B |
| Share-based compensation (KRW) | — | — | — | — | — | — | — | 0.00 | 0.00 | 483M |
| Operating cash flow before change in receivables (KRW) | — | — | — | — | — | — | — | 65B | 110B | 63B |
| Free cash flow (OCF - PPE - intangibles) (KRW) | 8.11B | 16.1B | 15.5B | -12.8B | 54.8B | -6.14B | 9.71B | 64.6B | 44B | 68.6B |
| Income detail | ||||||||||
| Total comprehensive income (KRW) | 8.61B | -30.9B | -10.2B | 15.9B | 22.1B | 25B | 9.07B | 28.2B | 38.7B | 55.2B |
| Comprehensive income to owners (KRW) | 9.75B | -29.8B | -12.5B | 15.9B | 22.1B | 25B | 9.07B | 28.2B | 38.7B | 55.2B |
| Reported | Feb 11, 2022 | Mar 30, 2022 | Feb 11, 2022 | Mar 30, 2022 | Feb 11, 2022 | Mar 21, 2024 | Mar 21, 2024 | Mar 18, 2026 | Mar 18, 2026 | Mar 18, 2026 |
Sign up to see institutional holdings
Sign UpPodcast Mentions
Sign up to see podcast mentions and sentiment
Sign UpDisclosures filed with DART (material events and exchange disclosures), newest first, headlines as filed in Korean. The link opens the filing on DART. Press releases from the company's own website, newest first.
단일판매ㆍ공급계약체결
Bull 5
Bear 0
Order/contract
 2026.10.12
 349
 동성화인텍
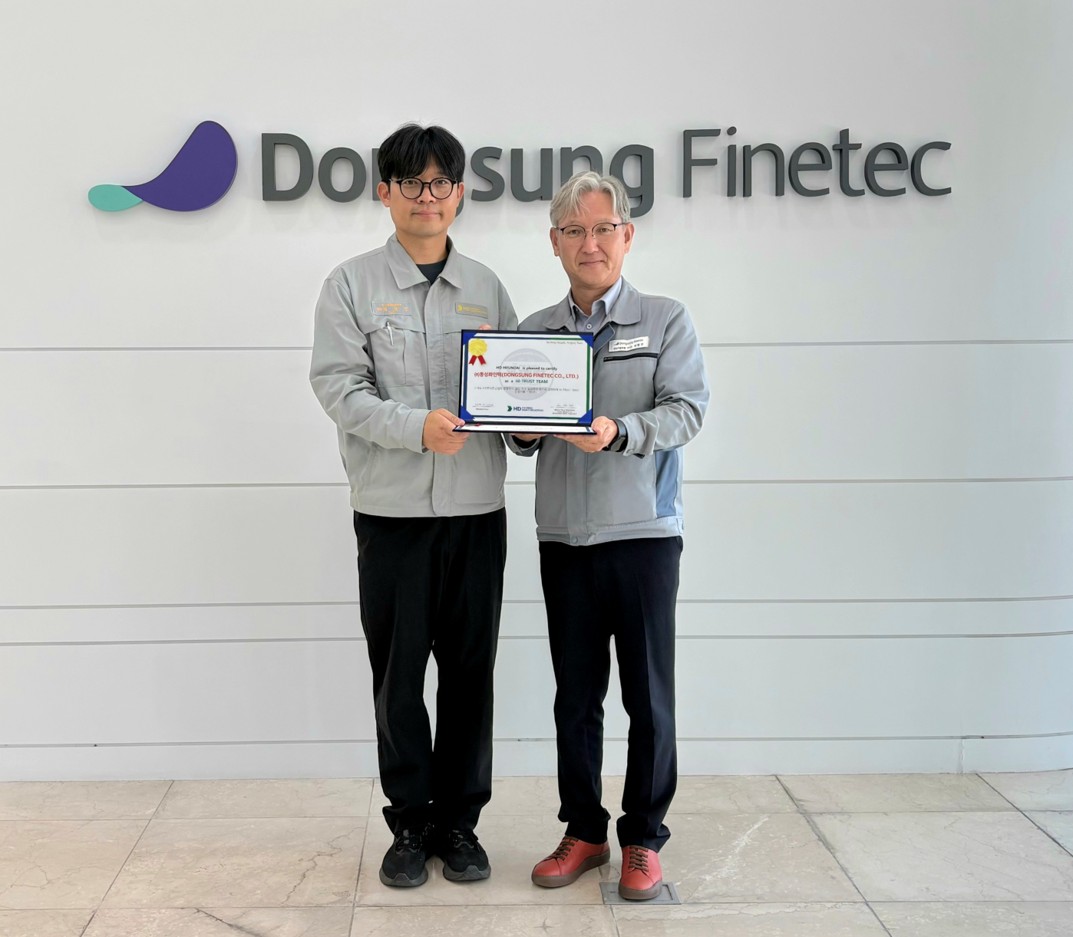
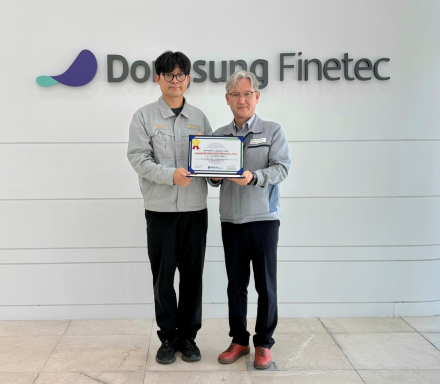
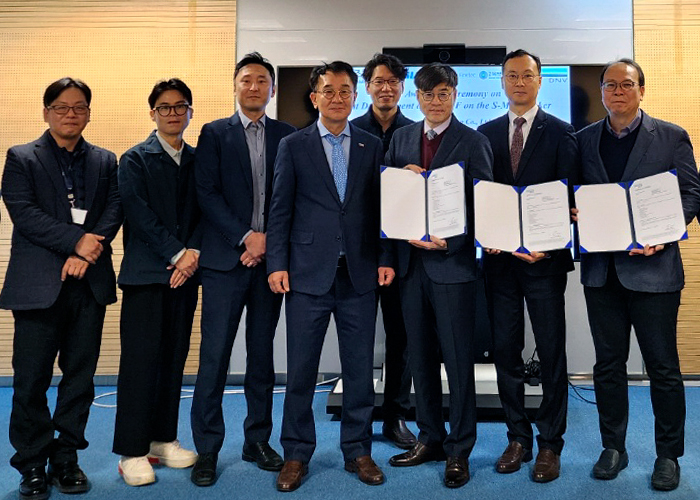
동성화인텍이 HD현대중공업으로부터 'Hi-TRUST TEAM' 우수협력사 인증서를 수여받고 기념촬영을 하고 있다.
- 자체 생산성 향상·품질관리 체계 고도화 노력 높은 평가
- 주요 선주·고객사 대상 우수협력사 소개…대외 신뢰도 제고
글로벌 에너지 솔루션 기업 동성화인텍(033500)이 HD현대중공업의 ‘Hi-TRUST TEAM’ 우수 협력사로 선정됐다고 8일 밝혔다.
HD현대중공업의 ‘Hi-TRUST TEAM’은 사외 협력사의 품질관리 역량과 현장 실적 등을 종합적으로 평가해 우수 협력사를 공식 인증하는 제도다.
동성화인텍은 자체 생산성 향상과 품질관리 체계 고도화를 지속 추진해 온 점에서 높은 평가를 받았다.
이번 인증으로 동성화인텍은 HD현대중공업의 주요 선주 및 고객사를 대상으로 우수 협력사로 소개된다. 이를 통해 동성화인텍의 초저온 보냉재 생산 및 품질 역량을 대외적으로 알리는 계기가 될 것으로 기대된다.
‘Hi-TRUST TEAM’ 인증 및 현판 수여식은 지난 7일 동성화인텍 안성공장에서 열렸다. 행사에는 이형진 동성화인텍 생산기술부문 부사장과 HD현대중공업 관계자가 참석했다.
이형진 동성화인텍 생산기술부문 부사장은 “이번 선정은 생산 현장에서 품질 경쟁력 향상을 위해 노력해 온 임직원들이 함께 만든 뜻깊은 성과”라며 “앞으로도 고객의 높은 품질 기준에 선제적으로 대응하며 신뢰받는 파트너로서 경쟁력을 높여 나가겠다”라고 말했다.
 LIST


-

-

-
-
-------Company-------
-
--------Brand--------
-

동성화인텍(안성공장) 대표전화
- T. 031-677-7000
- F. 031-677-7007
문의 남겨주시면 소중한 의견에
최선의 답변을 드리도록 노력하겠습니다.

Copyright ⓒ Dongsung Finetec. All rights reserved.
 2026.10.12
 111
 Dongsung Finetec
 LIST


 SEARCH





Prompts
Click prompts to add them under the company line, click again to take one out, then copy the result into your AI chat. Shared by Asian Century Stocks and Uncovered Thai Stocks. Thank you.
DONGSUNG FINETEC (ticker 033500), listed in South Korea.
Copied
ETFs Holding DONGSUNG FINETEC
Exchange-traded funds whose newest published daily portfolio holds one of the company's listings, largest weight first.