연결재무제표기준영업(잠정)실적(공정공시)
Bull 2
Bear 0
Results
032350
|
LOTTE TOUR is a South Korean travel and hospitality company established in 1971. The company operates in four main business segments: travel, hotel, casino, and retail. Its travel division offers domestic and international package tours, charter flights, airline ticket sales, and corporate travel services through a network of direct branches and franchise agents. The hotel segment is centered on the Jeju Dream Tower Complex, where the Grand Hyatt Jeju operates rooms, restaurants, bars, and an observation deck. The company also manages the LT Casino, a foreigner-only casino located within the complex, which it acquired in 2018. In the retail sector, LOTTE TOUR operates HAN Collection, a K-fashion and beauty concept store featuring curated items from domestic designers and brands. The company serves domestic and international tourists, with a significant focus on the Jeju Island market and inbound visitors from China, Japan, and other regions. Key partnerships include Hyatt Group for hotel management and CSCEC for the construction of the Jeju Dream Tower Complex. Summarised from the company's own disclosures, fiscal year ended Mar 2026 |
Industry Travel Services | Homepage lottetour.com |
| Sector Consumer Cyclical | IR page lottetour.com/welcome | |
|
Tags
package tours, charter flights, hotel operations, casino operations, fashion retail, beauty retail, inbound tourism, outbound tourism, corporate travel, k-fashion, Jeju Dream Tower Complex, Grand Hyatt Jeju, LT Casino, HAN Collection, Dream Gift Shop, Hyatt Group, CSCEC, Donghwa Investment Development
|
Press page — |
Metrics
| Valuation | |
|---|---|
| Market cap | ₩ 921.454B |
| Market cap (USD) | $ 678.174M |
| P/E | 17.02 |
| PEG | — |
| P/BV | 2.44 |
| P/S | 1.26 |
| P/OCF | 7.17 |
| P/FCF | 8.52 |
| Dividend yield | — |
| Turnover / mcap | — |
| Returns | |
|---|---|
| ROE | 8.1% |
| ROI | 7.5% |
| ROIC | 28.9% |
| Profit margin | 4.2% |
| Growth | |
|---|---|
| Revenue growing | Yes |
| Profits growing | Yes |
| Revenue up 3y | Yes |
| Revenue up 5y | Yes |
| Earnings growth 3y (net profit CAGR) | — |
| Quality | |
|---|---|
| Profitable | Yes |
| Margin expanding | Yes |
| Buying back stock | No |
| Diluting (TTM) | Yes |
| Debt/Equity | — |
| Podcast bulls (TTM) | Sign up |
| Podcast bears (TTM) | Sign up |
| Podcast sentiment (TTM) | Sign up |
| Podcast sentiment % (TTM) | Sign up |
| News sentiment (TTM) | — |
| Quality score | 41.2% |
| Insiders | |
|---|---|
| Buys, 1w | Sign up |
| Buys, 1m | Sign up |
| Buys, 1y | Sign up |
| Sells, 1w | Sign up |
| Sells, 1m | Sign up |
| Sells, 1y | Sign up |
Sign up to see this company's insider trades
| Figure | FY 2025 | FY 2024 | FY 2023 | FY 2022 | FY 2021 | FY 2020 | FY 2019 | FY 2018 | FY 2017 | FY 2016 | FY 2015 | FY 2014 | FY 2013 |
|---|---|---|---|---|---|---|---|---|---|---|---|---|---|
| Revenue | 653.448B | 471.468B | 313.548B | 183.671B | 107.072B | 16.769B | 88.449B | 76.076B | 70.292B | 50.376B | 44.668B | 42.32B | 45.116B |
| Net profit | 27.765B | -116.575B | -202.22B | -224.701B | -200.585B | -81.926B | -13.935B | -108.467B | 3.343B | 1.532B | -49.962B | 775.289M | -3.88B |
| Free cash flow | 90.229B | 114.347B | -22.188B | -76.479B | -138.435B | -667.011B | -240.036B | -7.755B | 1.41B | -5.772B | -1.693B | 848.941M | -8.195B |
Filed figures
Lines the statements and their notes report beside the headline figures, read from the filings' XBRL as filed (no restatement applied), with figures computed from one filing's own lines. Cash-flow lines carry their cash direction: an outflow is negative. Each period links to its filing; a figure's period, report date and tag are in its tooltip.
| Figure | Dec 2016 | Dec 2017 | Dec 2018 | Dec 2019 | Dec 2020 | Dec 2021 | Dec 2022 | Dec 2023 | Dec 2024 | Dec 2025 |
|---|---|---|---|---|---|---|---|---|---|---|
| Balance sheet detail | ||||||||||
| Trade receivables (KRW) | 14.2B | 15.3B | 662M | 393M | 624M | 2.55B | 3.92B | 4.56B | 2.84B | 4.93B |
| ↳ YoY growth | +14.2% | +7.5% | -95.7% | -40.7% | +58.8% | +308.9% | +53.7% | +16.2% | -37.8% | +73.6% |
| ↳ 5y CAGR | -45.1% | -29.1% | -23.8% | +47.1% | +48.5% | +51.2% | ||||
| Other receivables (KRW) | 5.14B | 8.67B | 8.07B | 14.1B | 34.7B | 963M | 3.35B | 6.35B | — | — |
| Borrowings, current (KRW) | 12.7B | 6.96B | 31.9B | 70.5B | 80.6B | 110B | 855B | 950B | 239B | 84.6B |
| Borrowings, non-current (KRW) | — | — | 0.00 | 0.00 | 722B | 822B | 109B | 47.9B | — | — |
| Bonds payable (KRW) | 0.00 | 40B | 31B | 69.5B | 58.8B | 214B | 229B | 238B | 239B | 84.6B |
| Lease liabilities (KRW) | — | — | — | — | — | — | 326B | 327B | 317B | 320B |
| Cash and deposits (KRW) | 12.3B | 45.5B | 13.1B | 16.3B | 58.2B | 60.7B | 28.6B | 33.6B | 44.3B | 62.1B |
| Intangible assets (KRW) | 4.35B | 4.45B | 49.8B | 49.3B | 50.2B | 50.9B | 49.1B | 47.2B | 46.4B | 46.3B |
| Right-of-use assets (KRW) | — | — | — | — | — | 185B | 317B | 306B | 287B | 280B |
| Net debt (borrowings + leases - cash) (KRW) | 377M | -38.5B | 18.7B | 54.2B | 744B | 872B | 935B | 965B | 512B | 342B |
| Cash flow detail | ||||||||||
| Operating cash flow (KRW) | 3.12B | 6.49B | 2.05B | -25B | -114B | -50.9B | -62.9B | -13.1B | 122B | 100B |
| Purchases of property, plant and equipment (KRW) | -8.89B | -5.08B | -9.81B | -215B | -553B | -87.5B | -13.6B | -9.11B | -7.34B | -9.86B |
| Purchases of intangible assets (KRW) | -198M | -447M | -18.2B | -473M | -3.86B | -2.49B | -615M | -974M | -1.39B | -1.6B |
| Change in receivables (cash effect) (KRW) | -2.71B | -4.64B | 427M | -5.83B | — | — | — | — | — | — |
| Change in inventories (cash effect) (KRW) | 0.00 | 0.00 | 24.4M | -4.03B | — | — | — | — | — | — |
| Change in payables (cash effect) (KRW) | 3.24B | 5.97B | -5.25B | 16.5B | — | — | — | — | — | — |
| Interest paid (cash effect) (KRW) | -11.8M | -715M | -571M | -428M | -13.6B | -37.6B | -53.6B | -86.9B | -99.9B | -94.8B |
| Income taxes paid (cash effect) (KRW) | -1.54M | -266M | -93M | -716M | 302M | 82.1M | 768M | 94.4M | -190M | — |
| Operating cash flow before change in receivables (KRW) | 5.83B | 11.1B | 1.63B | -19.1B | — | — | — | — | — | — |
| Free cash flow (OCF - PPE - intangibles) (KRW) | -5.97B | 963M | -25.9B | -241B | -671B | -141B | -77.1B | -23.2B | 113B | 88.6B |
| Income detail | ||||||||||
| Total comprehensive income (KRW) | 952M | 3.53B | -109B | -18.2B | -79.6B | -197B | 126B | -211B | 243B | 20.4B |
| Comprehensive income to owners (KRW) | 964M | 3.49B | -105B | -18B | -79.5B | -197B | 126B | -211B | 243B | 20.5B |
| Provision for credit losses (KRW) | 37.4M | 52.5M | 14.8B | 79.5M | — | — | — | — | — | — |
| Credit cost ratio (credit losses / average receivables) (%) | 0.2% | 0.2% | 90.6% | 0.7% | — | — | — | — | — | — |
| Reported | Mar 29, 2019 | Mar 29, 2019 | Jul 1, 2022 | Aug 14, 2020 | Jul 1, 2022 | Mar 21, 2024 | Mar 20, 2025 | Mar 20, 2025 | Mar 20, 2025 | Mar 19, 2026 |
Sign up to see institutional holdings
Sign UpPodcast Mentions
Sign up to see podcast mentions and sentiment
Sign UpDisclosures filed with DART (material events and exchange disclosures), newest first, headlines as filed in Korean. The link opens the filing on DART. Press releases from the company's own website, newest first.




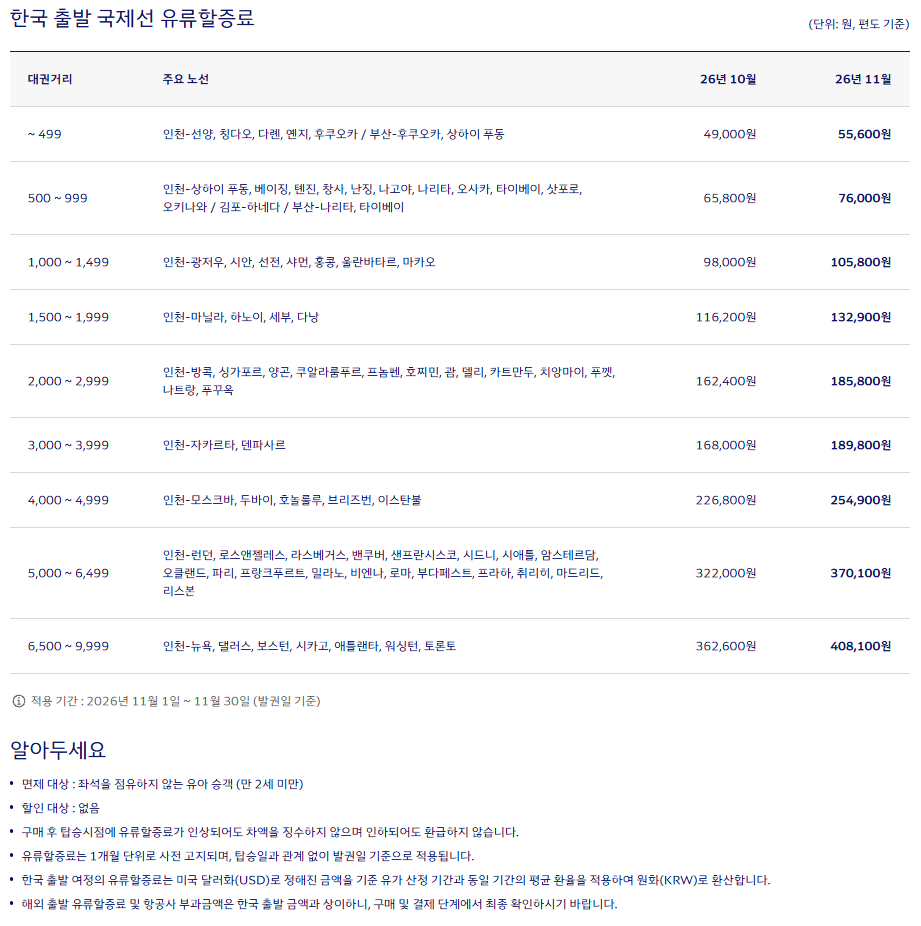 ▣ 아시아나항공
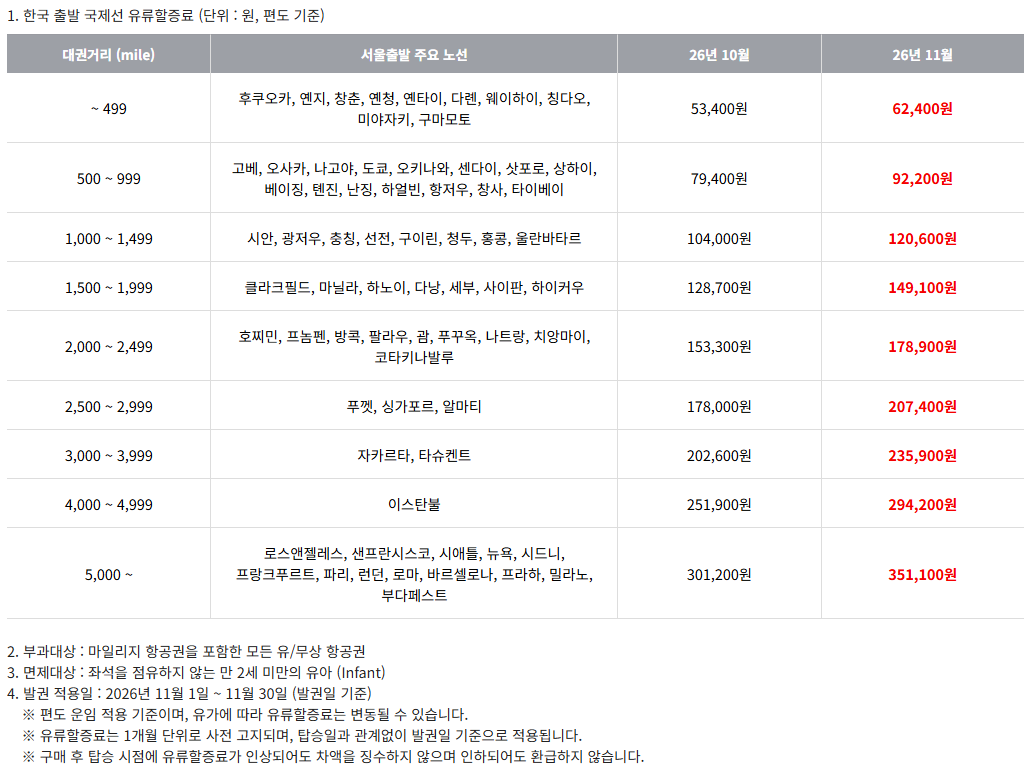


 * 아시아나항공과 대한항공의 공동운항편 이관은 2026년 12월 7일부터 12월 9일까지 진행됩니다. * 통합 추진 일정에 따라 이관 시점은 변동될 수 있습니다. ■ 개인정보 이관 통합 이후에도 원활한 서비스가 제공될 수 있도록 항공권 예약정보 및 이에 포함되어 있는 고객님의 개인정보가 대한항공으로 이관됩니다. -이관 항목 : 성명, 연락처, 이메일, 여권번호, 신용카드번호, 생년월일, 성별, 회원번호, 예약번호 등 항공권 예약정보와 관련된 개인정보 일체 개인정보를 이전받는 존속회사의 정보는 다음과 같습니다. -회 사 명 : (주) 대한항공 -주 소 : 서울특별시 강서구 하늘길 260 -대표전화 (한국) : 1588-2001, 82-2-2656-2001 대한항공은 이전받는 개인정보를 관련 법령에 따라 안전하게 관리하며 이전 당시의 본래 목적으로만 이용하고 처리할 것입니다. 항공권 예약정보 및 이에 따른 개인정보 이관에 동의하지 않으시는 경우에는 아시아나항공 및 롯데관광 1:1온라인 상담으로 2026년 10월 27일(화) 16시(당사 영업일 기준 한국시간) 이전까지 개인정보 이전 거부에 관한 의사를 통보하여 주시기 바랍니다. 정보 이관 미 동의 시, 아시아나항공 또는 최초 예매처를 통해 예약 취소 및 항공권 환불이 진행되며 이에 따른 항공사수수료는 면제됩니다. 이전에 동의하지 않은 개인정보는 합병기일 이후 지체없이 파기하되 관계법령상 보존이 필요한 경우, 대한항공이 정해진 기간 동안 별도 보관 후 파기할 예정입니다. ■ 여객운송약관 적용 2026년 12월 17일부터 아시아나항공과 대한항공의 통합에 따라 기존에 구매하신 아시아나항공 항공권에 대한항공 여객운송약관이 적용됩니다. 단, 고객에게 더 유리한 일부 조항에 대해서는 아시아나항공의 여객운송약관을 적용할 수 있습니다. 항공편명 변경 및 예약정보 이관 후, 아시아나항공을 통해 아시아나항공 운항편과 2026년 12월 17일 이후 출발하는 대한항공 운항편(기존 아시아나항공 편명)을 함께 구매한 경우, 대한항공 운항편에는 대한항공 여객운송약관이 적용됩니다. 자세한 사항은 아시아나항공 홈페이지 공지사항을 확인해 주시기 바랍니다.


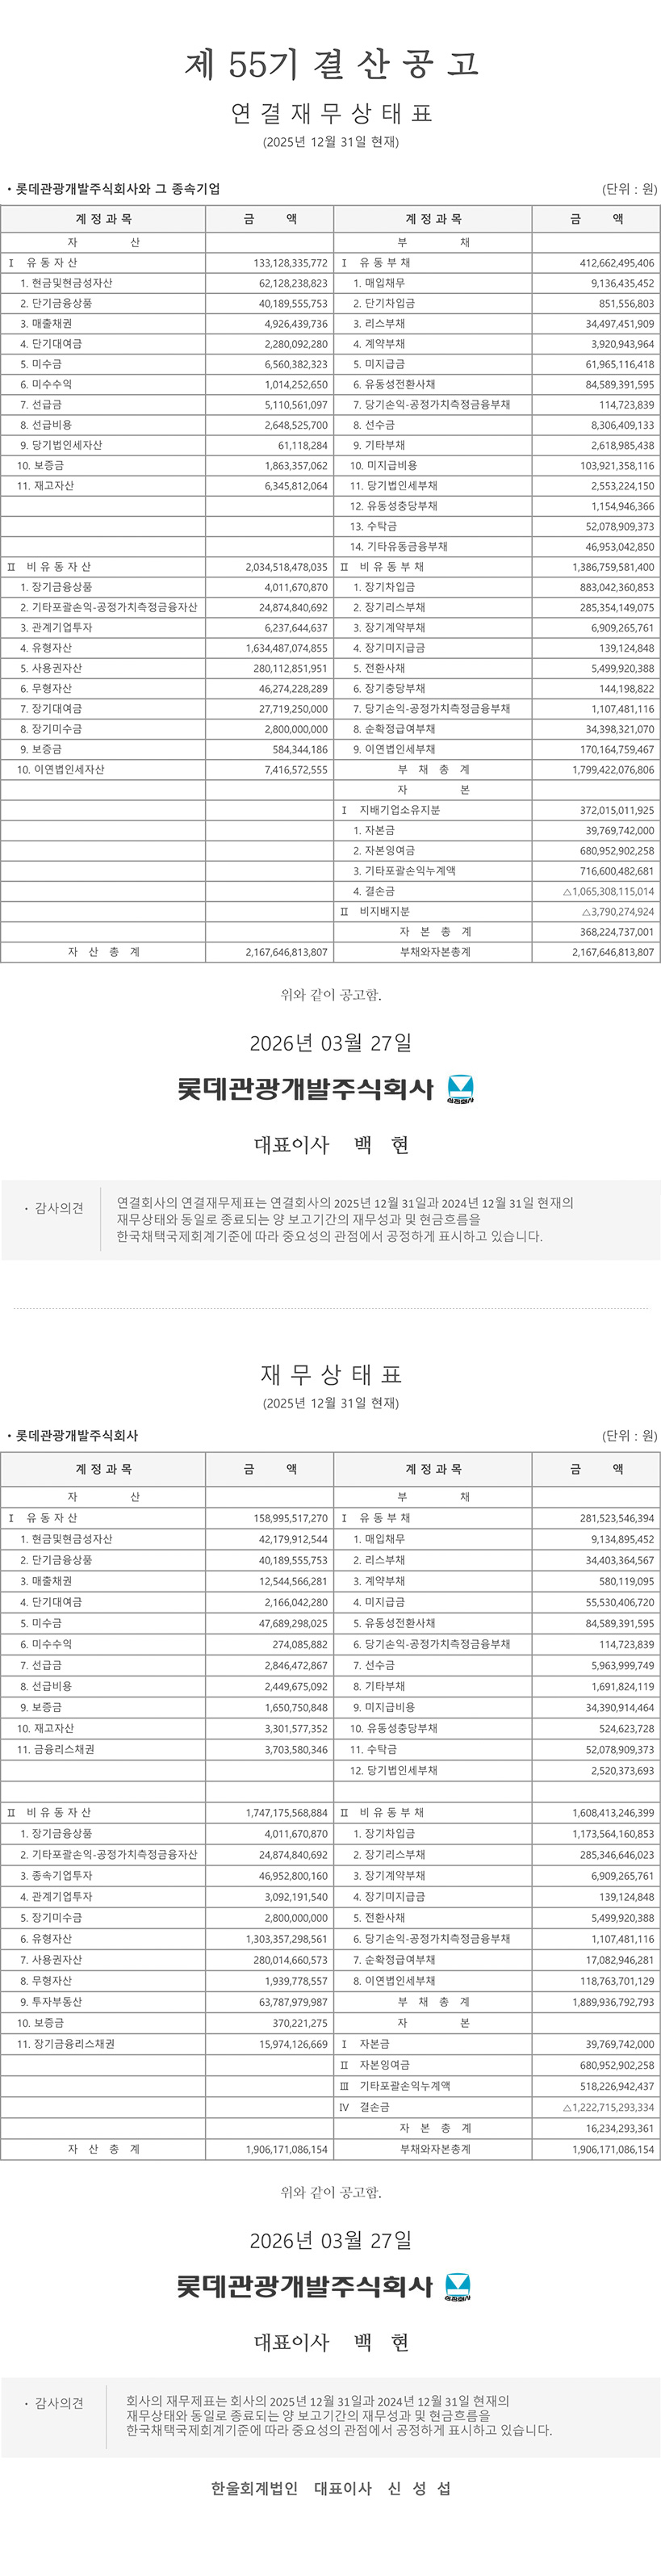

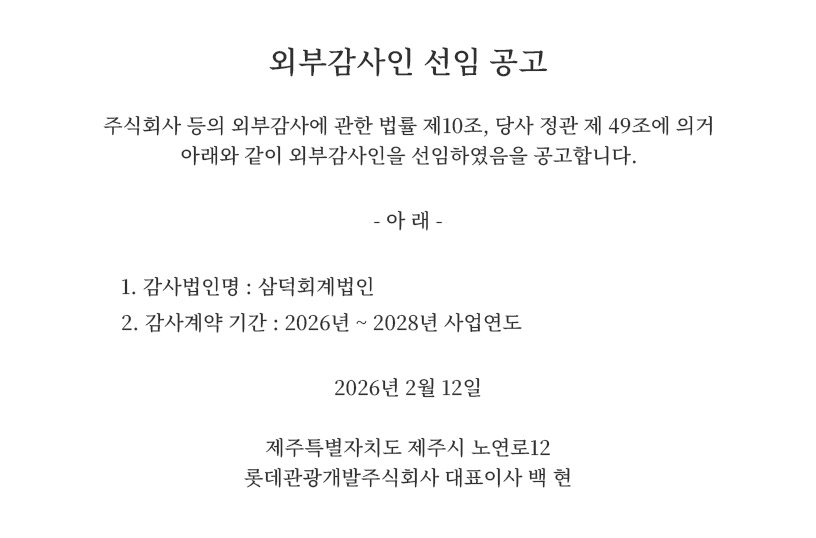
Prompts
Click prompts to add them under the company line, click again to take one out, then copy the result into your AI chat. Shared by Asian Century Stocks and Uncovered Thai Stocks. Thank you.
LOTTE TOUR (ticker 032350), listed in South Korea.
Copied
ETFs Holding LOTTE TOUR
Exchange-traded funds whose newest published daily portfolio holds one of the company's listings, largest weight first.