주식등의대량보유상황보고서(일반)
Bull 0
Bear 0
Routine
030520
|
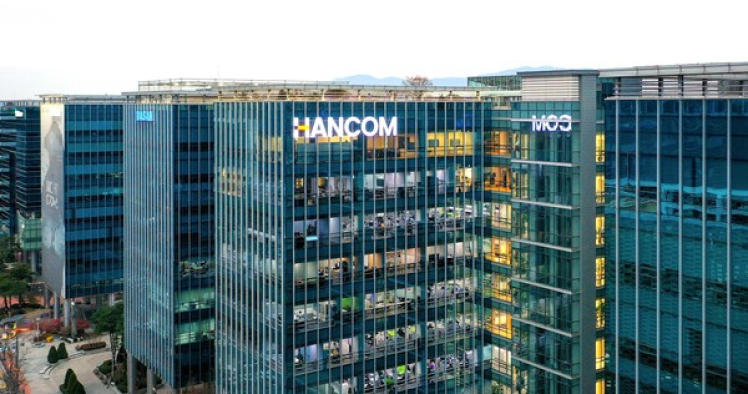
HANCOM is a South Korean software and technology group that develops office productivity software, AI solutions, and personal protective equipment. Its primary business segment is office software and services, where it produces the Hancom Office suite, including the HWP document format, and offers cloud-based subscription services such as Hancom Docs and AI-integrated tools like Hancom Docs AI, Hancom Assistant, and Hancom Pedia. The company also operates in the manufacturing sector through its subsidiary Hancom Life Care, which produces personal protective equipment (PPE) such as protective suits, respiratory gear, and masks, as well as defense-related products including laser engagement training systems and warrior platforms. Additionally, the group includes UDM, a marketing agency and brand management firm, and Hancom Value Investment, a financial services subsidiary focused on venture investment and lending. HANCOM serves public sector, enterprise, and consumer markets in South Korea and internationally, with a focus on expanding its AI and cloud service offerings. Summarised from the company's own disclosures, fiscal year ended Mar 2026 |
Industry Software - Application | Homepage hancom.com |
| Sector Technology | IR page hancom.com/about/ir/stock | |
|
Tags
office software, ai solutions, cloud services, personal protective equipment, defense systems, marketing services, venture investment, document management, saas, ai agents, Hancom Office, Hancom Docs, Hancom Docs AI, Hancom Assistant, Hancom Pedia, Hancom Life Care, UDM, Hancom Value Investment, HWPX, Web Hancom, Hancom SDK, Live Training System, Warrior Platform, Ters, Dallo, Dr. Seed
|
Press page hancom.com/news |
Metrics
| Valuation | |
|---|---|
| Market cap | ₩ 419.712B |
| Market cap (USD) | $ 308.901M |
| P/E | 10.52 |
| PEG | — |
| P/BV | 1.09 |
| P/S | 1.16 |
| P/OCF | 7.66 |
| P/FCF | 9.49 |
| Dividend yield | — |
| Turnover / mcap | — |
| Returns | |
|---|---|
| ROE | 9.6% |
| ROI | 9.4% |
| ROIC | 8.7% |
| Profit margin | 10.5% |
| Growth | |
|---|---|
| Revenue growing | Yes |
| Profits growing | Yes |
| Revenue up 3y | Yes |
| Revenue up 5y | No |
| Earnings growth 3y (net profit CAGR) | -9.7% |
| Quality | |
|---|---|
| Profitable | Yes |
| Margin expanding | No |
| Buying back stock | No |
| Diluting (TTM) | No |
| Debt/Equity | — |
| Podcast bulls (TTM) | Sign up |
| Podcast bears (TTM) | Sign up |
| Podcast sentiment (TTM) | Sign up |
| Podcast sentiment % (TTM) | Sign up |
| News sentiment (TTM) | — |
| Quality score | 41.2% |
| Insiders | |
|---|---|
| Buys, 1w | Sign up |
| Buys, 1m | Sign up |
| Buys, 1y | Sign up |
| Sells, 1w | Sign up |
| Sells, 1m | Sign up |
| Sells, 1y | Sign up |
Sign up to see this company's insider trades
| Figure | FY 2025 | FY 2024 | FY 2023 | FY 2022 | FY 2021 | FY 2020 | FY 2019 | FY 2018 | FY 2017 | FY 2016 | FY 2015 | FY 2014 | FY 2013 |
|---|---|---|---|---|---|---|---|---|---|---|---|---|---|
| Revenue | 326.745B | 304.773B | 271.1B | 242.008B | 241.73B | 401.369B | 319.256B | 215.761B | 134.111B | 101.244B | 84.941B | 75.837B | 68.525B |
| Net profit | 34.377B | 13.879B | 15.081B | 46.757B | 18.007B | 37.097B | 19.263B | 6.526B | 20.121B | 14.91B | 24.016B | 20.084B | 19.07B |
| Free cash flow | 58.612B | 40.779B | 31.83B | 7.167B | 39.131B | 42.404B | 34.31B | 47.64B | 44.236B | 19.839B | 29.213B | 43.696B | 26.557B |
Filed figures
Lines the statements and their notes report beside the headline figures, read from the filings' XBRL as filed (no restatement applied), with figures computed from one filing's own lines. Cash-flow lines carry their cash direction: an outflow is negative. Each period links to its filing; a figure's period, report date and tag are in its tooltip.
| Figure | Dec 2016 | Dec 2017 | Dec 2018 | Dec 2019 | Dec 2020 | Dec 2021 | Dec 2022 | Dec 2023 | Dec 2024 | Dec 2025 |
|---|---|---|---|---|---|---|---|---|---|---|
| Balance sheet detail | ||||||||||
| Trade receivables (KRW) | 27.8B | 29.8B | 57.5B | 59B | 55.9B | 46.6B | 40B | 39.1B | 39.9B | 53.8B |
| ↳ YoY growth | +27.4% | +7.0% | +92.7% | +2.7% | -5.2% | -16.6% | -14.3% | -2.2% | +2.0% | +34.9% |
| ↳ 5y CAGR | +9.7% | +24.0% | +20.7% | +10.9% | +6.0% | -7.4% | -7.5% | -0.8% | ||
| Borrowings, current (KRW) | 360M | 44.4B | 32.6B | 27.1B | 38.8B | 36B | 38.7B | 7.67B | 11.7B | 1.98B |
| Borrowings, non-current (KRW) | 1.44B | 93.4B | 92.7B | 67.7B | 41.8B | 16.4B | 6.7B | 826M | 17.4B | 22.2B |
| Bonds payable (KRW) | 0.00 | 82.8B | 102B | 86.5B | 73.2B | 34.3B | 28.3B | 0.00 | 1.72B | 1.98B |
| Cash and deposits (KRW) | 27.7B | 57.8B | 69.5B | 82.6B | 91.5B | 163B | 107B | 80.9B | 107B | 132B |
| Intangible assets (KRW) | 55.3B | 249B | 255B | 252B | 244B | 259B | 156B | 87.7B | 101B | 105B |
| Right-of-use assets (KRW) | — | 0.00 | 0.00 | 6.92B | 5.59B | 9.61B | 5.83B | 19.1B | 20.1B | 19.5B |
| Net debt (borrowings + leases - cash) (KRW) | -25.9B | 80B | 55.8B | 12.1B | -10.9B | -110B | -61.3B | -72.4B | -78.3B | -108B |
| Cash flow detail | ||||||||||
| Operating cash flow (KRW) | 20.7B | 46.1B | 60.5B | 40.5B | 67.2B | 54.2B | 23.8B | 47.1B | 56B | 69.7B |
| Purchases of property, plant and equipment (KRW) | -857M | -1.91B | -12.9B | -6.2B | -24.8B | -15.1B | -16.6B | -15.3B | -15.2B | -11.1B |
| Purchases of intangible assets (KRW) | -6.06B | -4.93B | -4.13B | -7.85B | -7.17B | -14.8B | -4.36B | -4.27B | -6.69B | -4.99B |
| Dividends paid (cash effect) (KRW) | -8.7B | -4.37B | -6.55B | -5.71B | 0.00 | — | 0.00 | 0.00 | -9.79B | -9.87B |
| Share buybacks (cash effect) (KRW) | -18M | 0.00 | 0.00 | — | — | 0.00 | -9.99B | -206M | -6.58M | -7B |
| Interest paid (cash effect) (KRW) | 0.00 | -764M | -2.82B | -2.58B | -1.68B | -1.09B | -1.35B | -980M | -1.25B | -2.02B |
| Income taxes paid (cash effect) (KRW) | -9.87B | -7.3B | -2.03B | -15.6B | -13.2B | -17.9B | -13.6B | -17.7B | -18B | -10.4B |
| Free cash flow (OCF - PPE - intangibles) (KRW) | 13.8B | 39.3B | 43.5B | 26.5B | 35.2B | 24.3B | 2.81B | 27.6B | 34.1B | 53.6B |
| Income detail | ||||||||||
| Total comprehensive income (KRW) | 14.4B | 20.3B | 9.12B | 22.2B | 45.6B | 4.08B | 17.5B | -29.7B | 11.5B | 24.4B |
| Comprehensive income to owners (KRW) | 14.2B | 19.5B | 6.1B | 18.9B | 36.7B | 17.4B | 46.9B | 13.1B | 11.5B | 34.2B |
| Reported | Apr 1, 2019 | Apr 13, 2020 | Aug 14, 2019 | Apr 13, 2020 | Apr 16, 2021 | Mar 20, 2024 | Mar 19, 2025 | Mar 19, 2025 | Mar 19, 2025 | Mar 18, 2026 |
Sign up to see institutional holdings
Sign UpPodcast Mentions
Sign up to see podcast mentions and sentiment
Sign UpNews
Disclosures filed with DART (material events and exchange disclosures), newest first, headlines as filed in Korean. The link opens the filing on DART. Press releases from the company's own website, newest first.
분기보고서 (2026.09)
Bull 0
Bear 0
Results
회사소식
공지사항

회사소식
- 공지사항
- 보도자료
- 홍보영상
- 이벤트
공지사항
| 장기 미접속 회원 탈퇴 예정 안내 (시행일: 2026.11.19) | 10/14/2026 |
| 이용약관 및 개인정보처리방침 개정 안내 (시행일: 2026.11.19) | 10/13/2026 |
| NICE 휴대폰 본인확인 서비스 순단 안내(9/19 21:00 ~ 9/20 05:00) | 9/14/2026 |
| NICE 휴대폰 본인확인 서비스 순단 안내(8/22 23:00 ~ 8/23 03:00) | 8/20/2026 |
| NICE 휴대폰 본인확인 서비스 순단 안내(7/18 20:00 ~ 7/19 04:00) | 7/14/2026 |
| ERP 시스템 이전 작업에 따른 서비스 일시 영향 안내(7/25 10:00~14:00) | 7/10/2026 |
| 개인정보처리방침 및 이용약관 개정 안내 (2026.07.14) | 6/30/2026 |
| NICE 휴대폰 본인확인 서비스 중단 발생 안내(6/20 23:00~6/21 06:00) | 5/27/2026 |
| NICE 휴대폰 본인확인 서비스 순단 안내(5/16 22:00 ~ 5/17 02:00) | 5/13/2026 |
| SKT 휴대폰 본인확인 서비스 중단 발생 안내(5/10, 5/12) | 5/6/2026 |
| SKT 휴대폰 본인확인 서비스 일시 중단 안내(4/29 06:00 ~ 07:00) | 4/28/2026 |
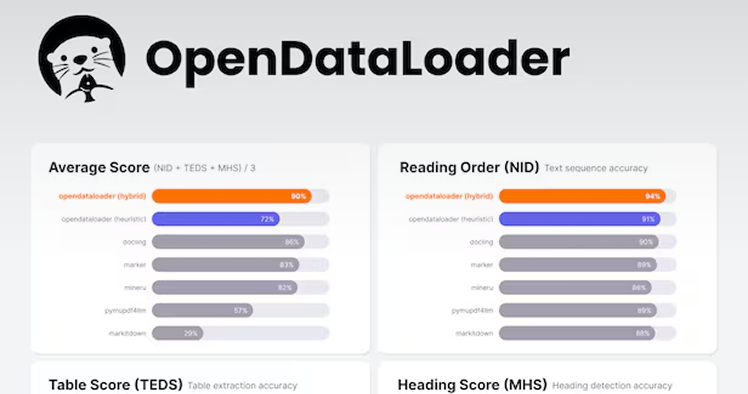
| "HWP를 AI가 읽게 되기까지" - 한컴의 포맷 개방화 이야기 | 4/28/2026 |
| [업데이트] 한컴닷컴 & 한컴스토어 서비스 점검 완료 안내(1/21 03:15) | 1/19/2026 |
| 개인정보 수집 및 이용에 대한 안내(선택) 개정 안내 (2026.01.27) | 1/8/2026 |
| 한글과컴퓨터 공식 홈페이지 점검 안내(1/9 05:00 ~ 05:30) | 1/7/2026 |
| 한글과컴퓨터 공식 홈페이지 접속 오류 조치 완료 (12/26 18:35~19:22) | 12/26/2025 |
| 2026 한글과컴퓨터 공인 파트너 모집 | 12/1/2025 |
| 개인정보처리방침 개정 안내 (2025.11.11) | 11/3/2025 |
| 한글과컴퓨터 한컴스토어 리뉴얼 오픈 공지 (2025.11.11) | 10/15/2025 |
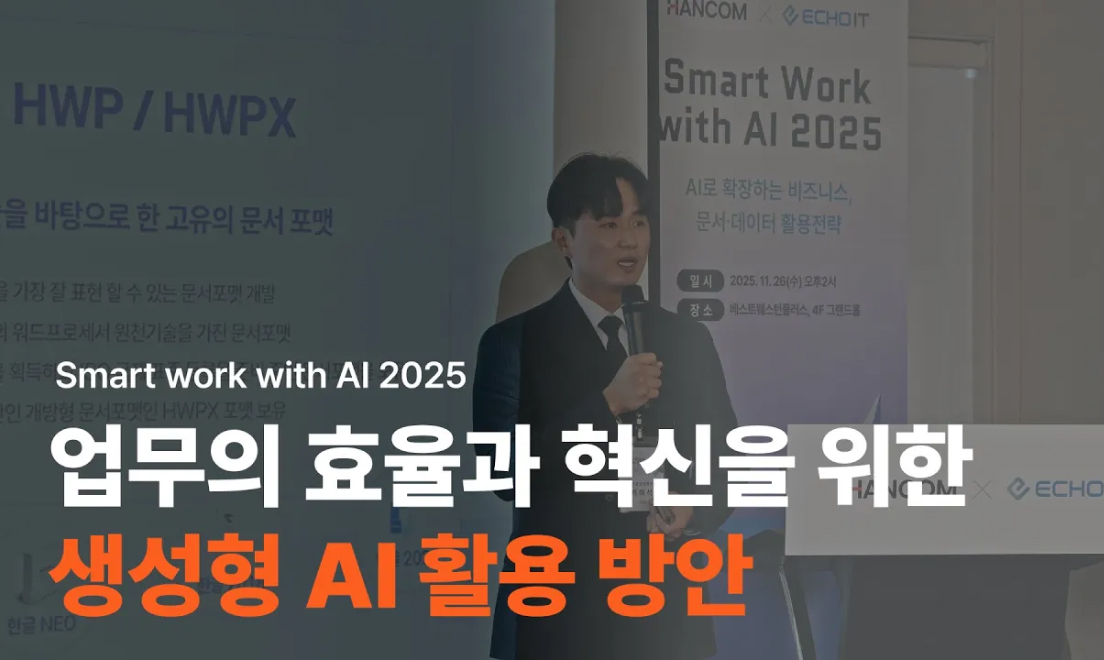
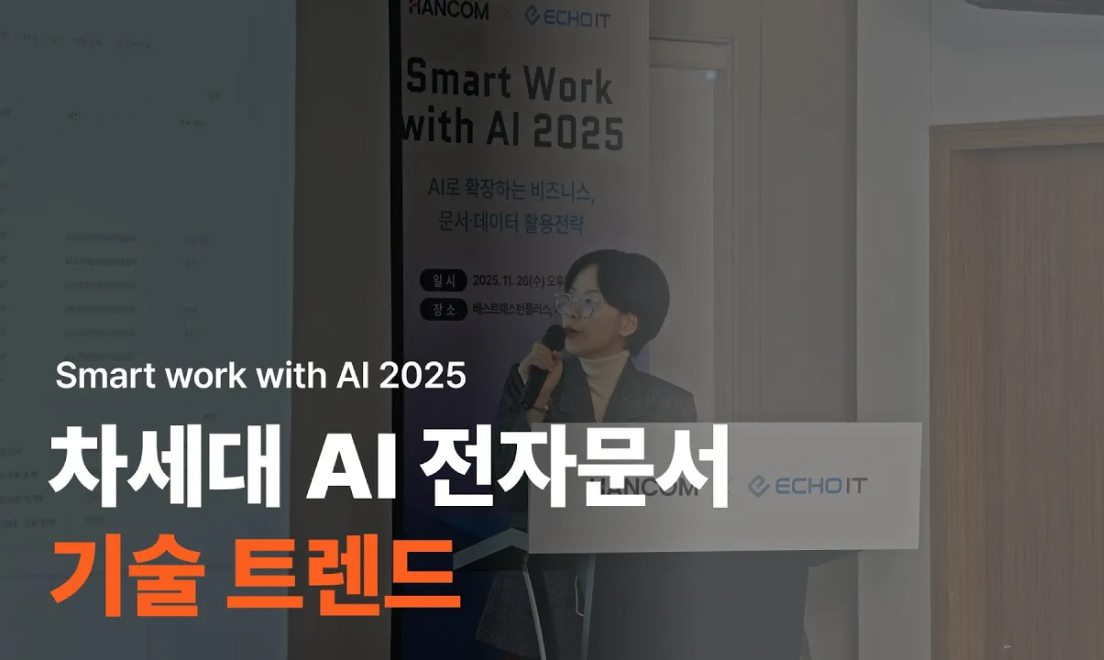
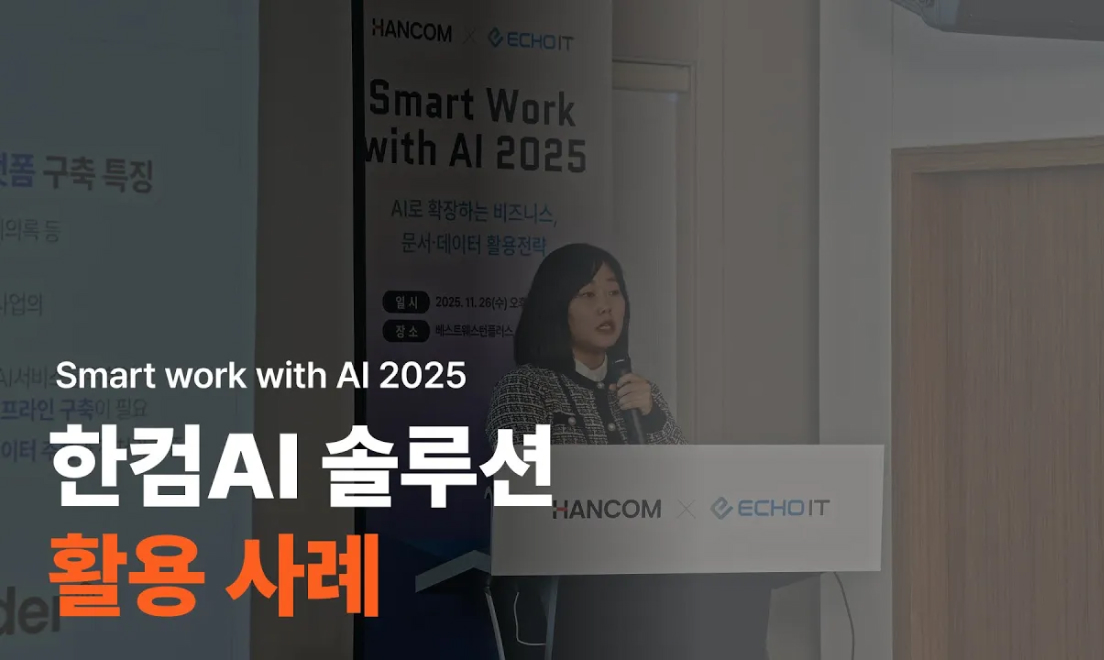
| Smart Work with AI 2025 권역 세미나 안내 | 9/10/2025 |
- 1
- 2
- 3
- 4
- 5
Footer
회사소개
회사소식
한컴 약관
그룹사 선택
그룹사 선택
(주)한컴대표자: 변성준, 김연수
사업자등록번호: 107-81-522302012-경기성남-1092
경기도 성남시 분당구 대왕판교로644번길 49 한컴타워 10층
고객 지원: 1566-5192(국내, 평일 9시-18시)[email protected]
KO

[인증범위] 생산성서비스 및 채용서비스
[유효기간] 2025.04.20~2028.04.19


Copyright Hancom Inc. All rights reserved.



Prompts
Click prompts to add them under the company line, click again to take one out, then copy the result into your AI chat. Shared by Asian Century Stocks and Uncovered Thai Stocks. Thank you.
HANCOM (ticker 030520), listed in South Korea.
Copied
ETFs Holding HANCOM
Exchange-traded funds whose newest published daily portfolio holds one of the company's listings, largest weight first.
| ETF | Weight in ETF | Shares | Market value | As of |
|---|---|---|---|---|
| AVEE | 0.01% | 669 | $ 6,781.89 | Nov 16, 2026 |
| DFSE | 0.00% | 2,657 | $ 28.838K | Nov 12, 2026 |
| DEXC | 0.00% | 1,147 | $ 12.449K | Nov 12, 2026 |
| DFEV | 0.00% | 7,762 | $ 84.245K | Nov 12, 2026 |
| DFEM | 0.00% | 27,242 | $ 295.67K | Nov 12, 2026 |
| DFAE | 0.00% | 14,951 | $ 162.27K | Nov 12, 2026 |
| DFAX | 0.00% | 12,345 | $ 133.986K | Nov 12, 2026 |
| AVXC | 0.00% | 35 | $ 354.81 | Nov 16, 2026 |