임원ㆍ주요주주특정증권등소유상황보고서
Bull 0
Bear 0
Routine
028260
|
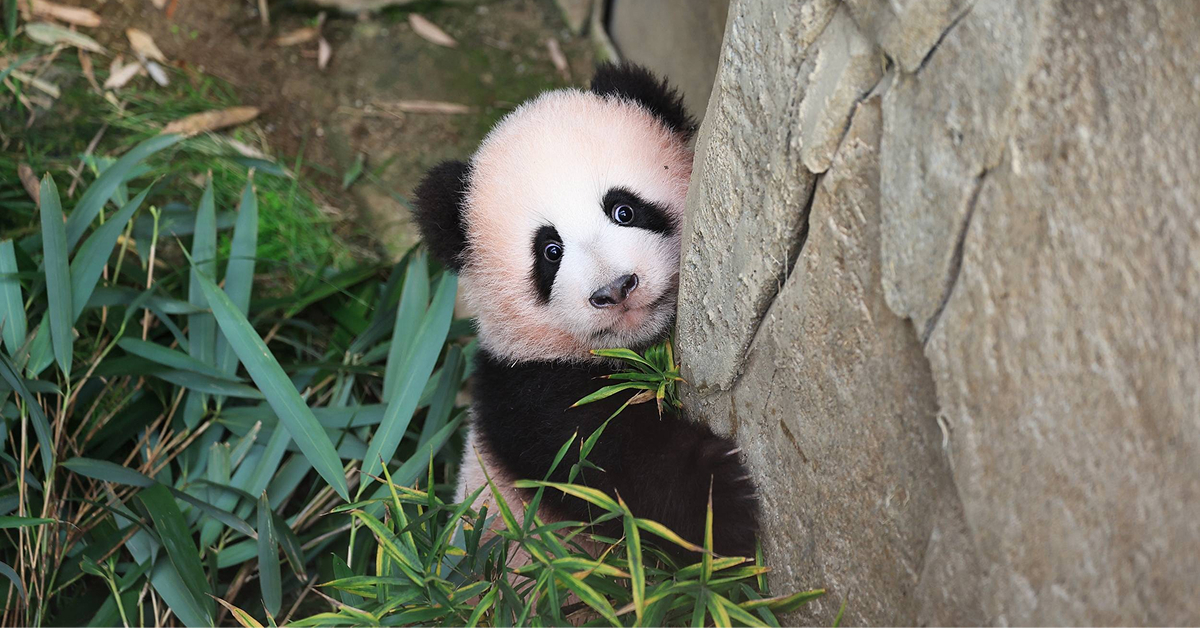
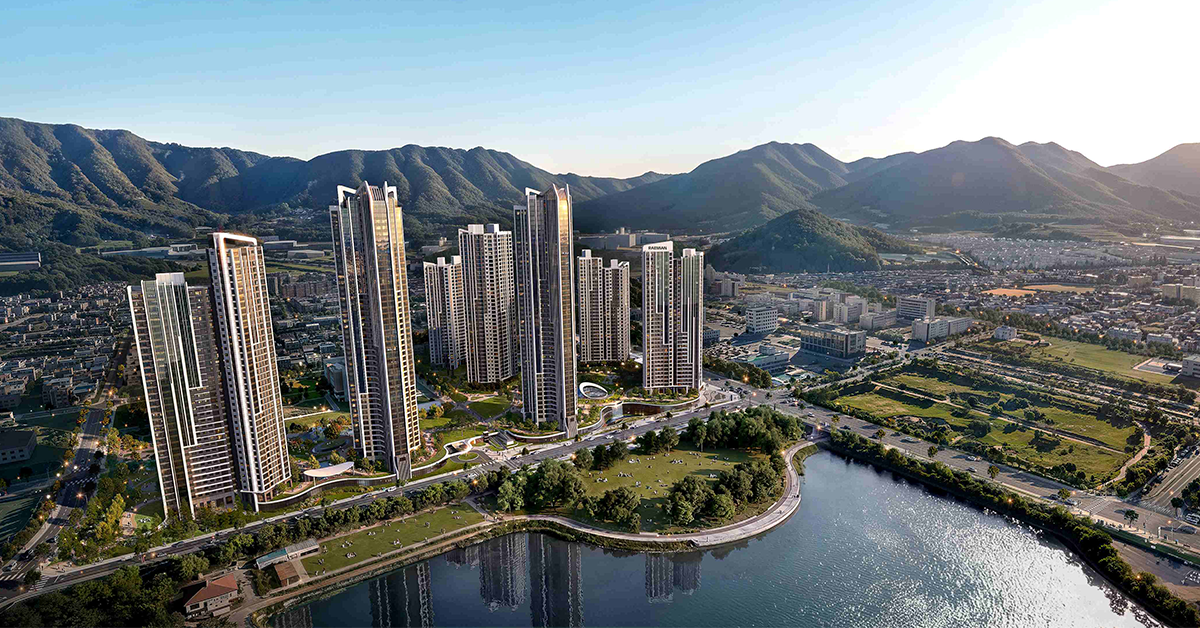
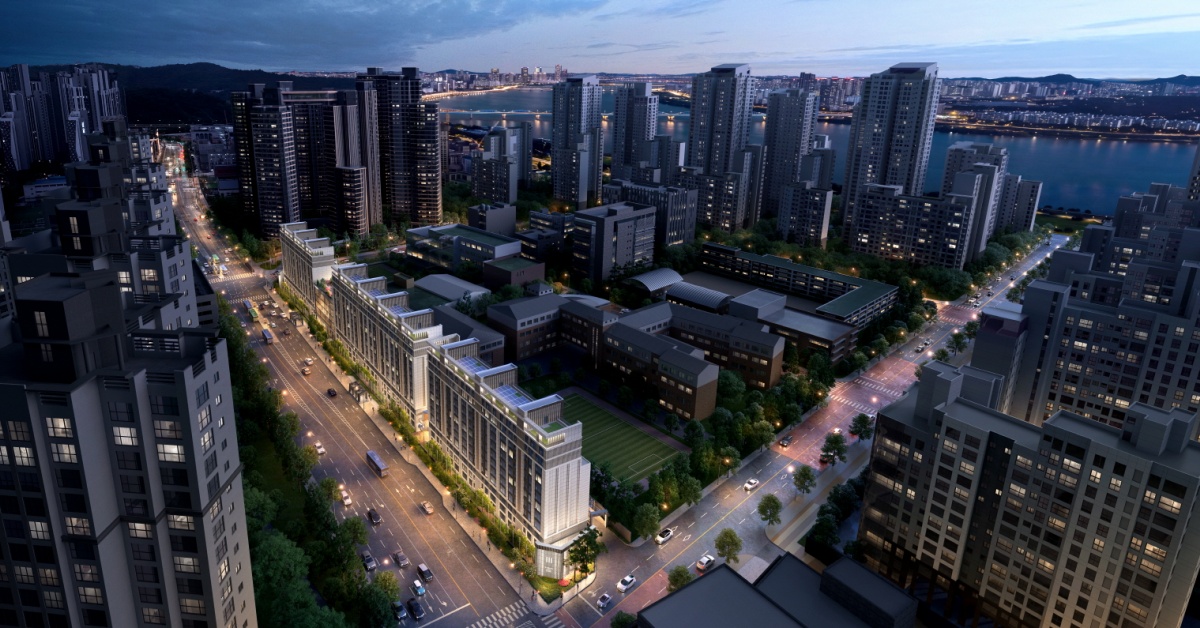
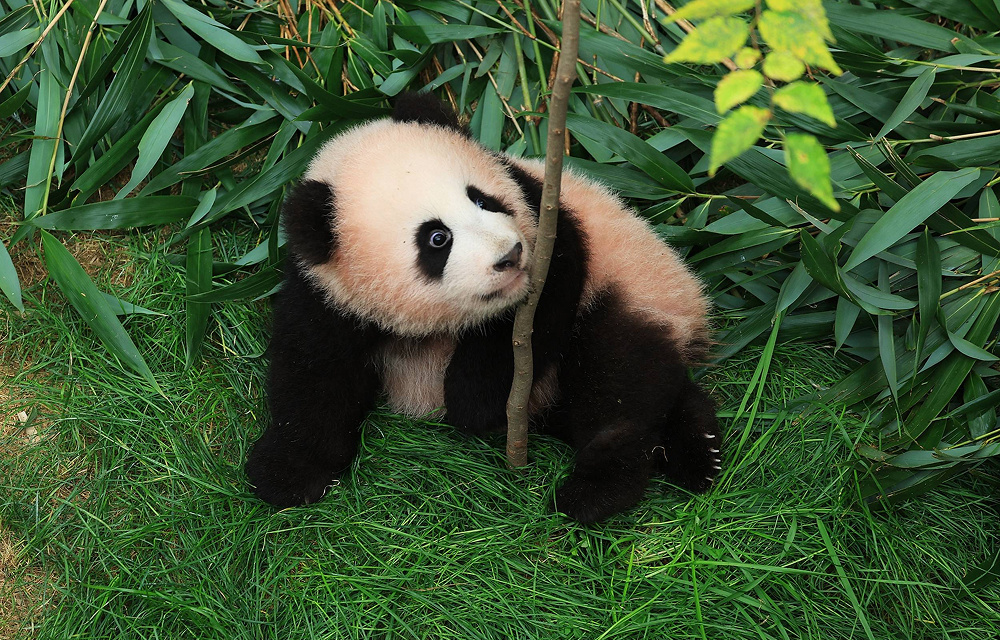
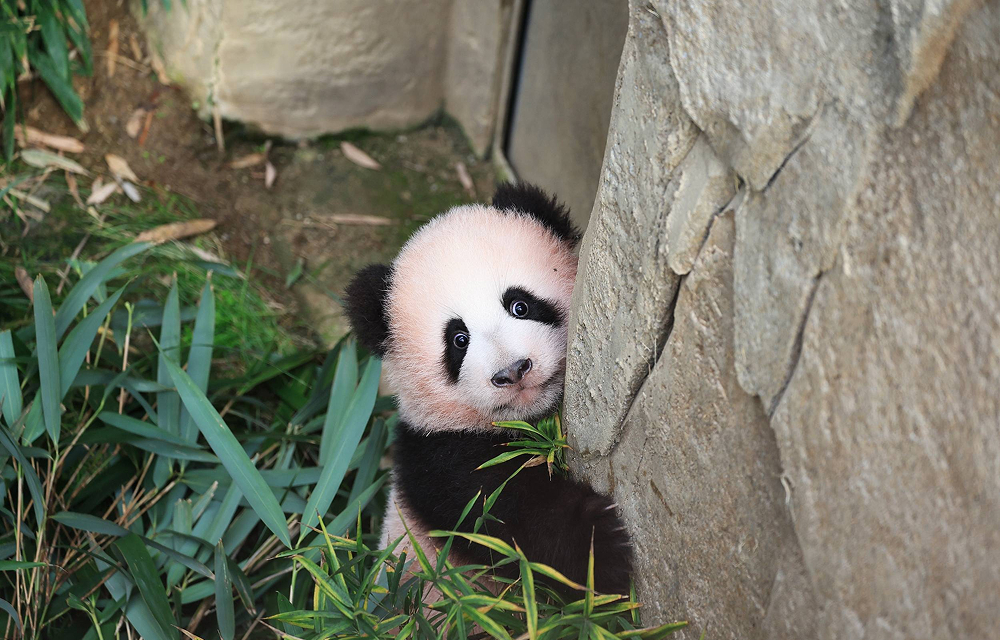
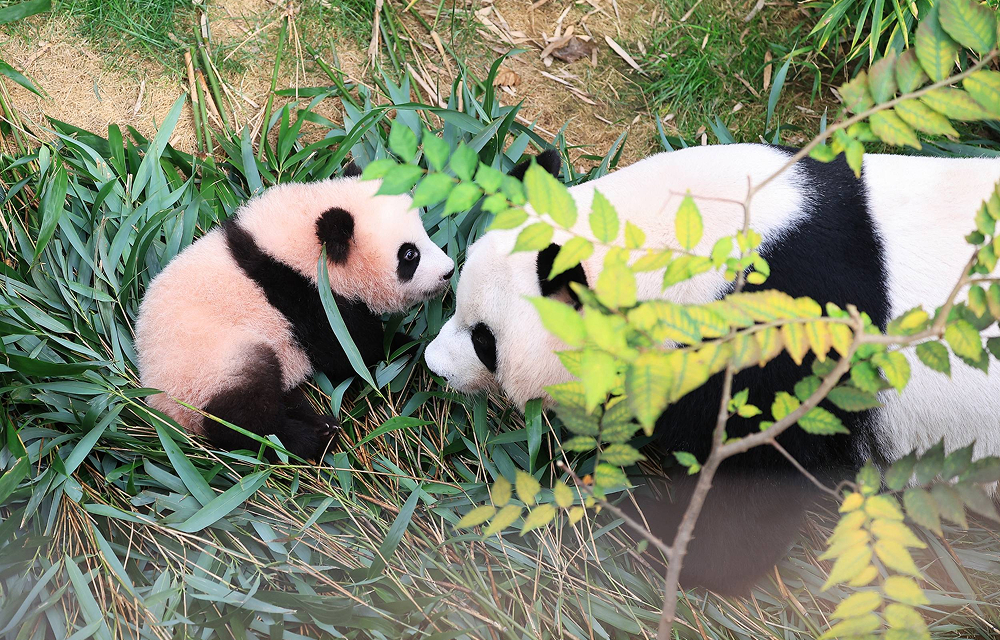
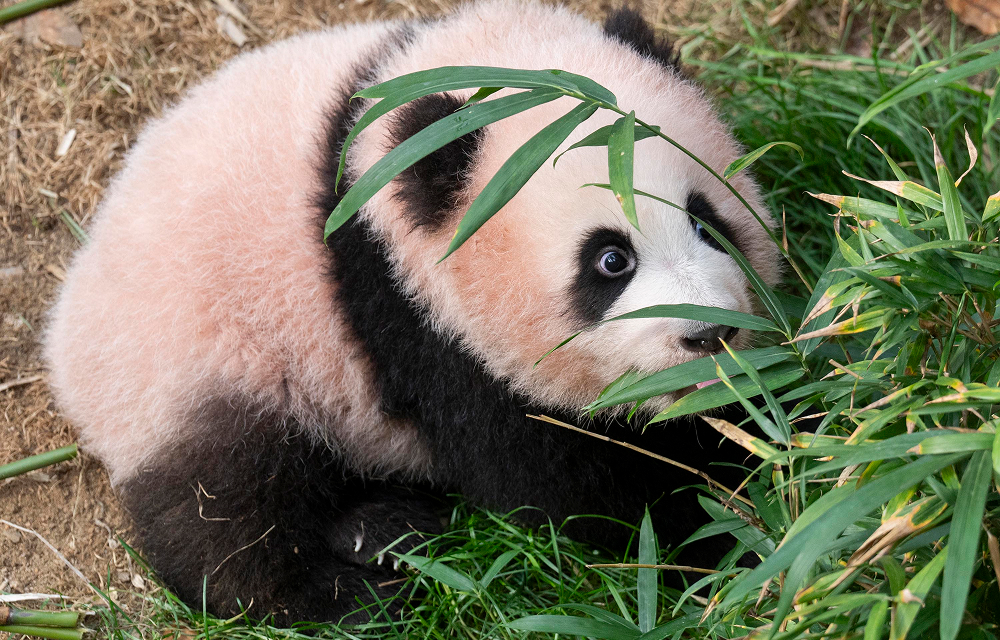
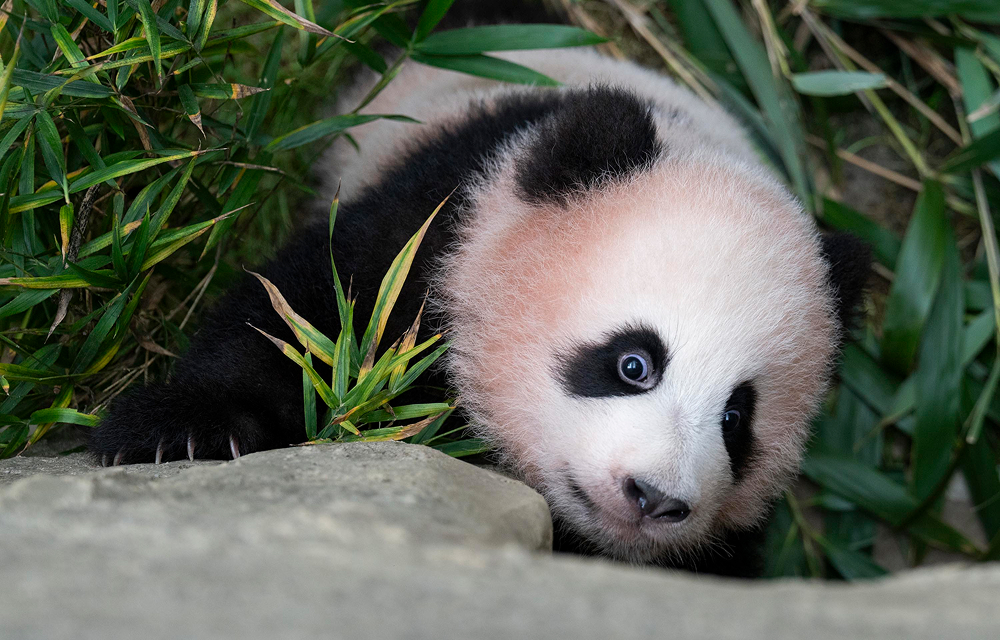
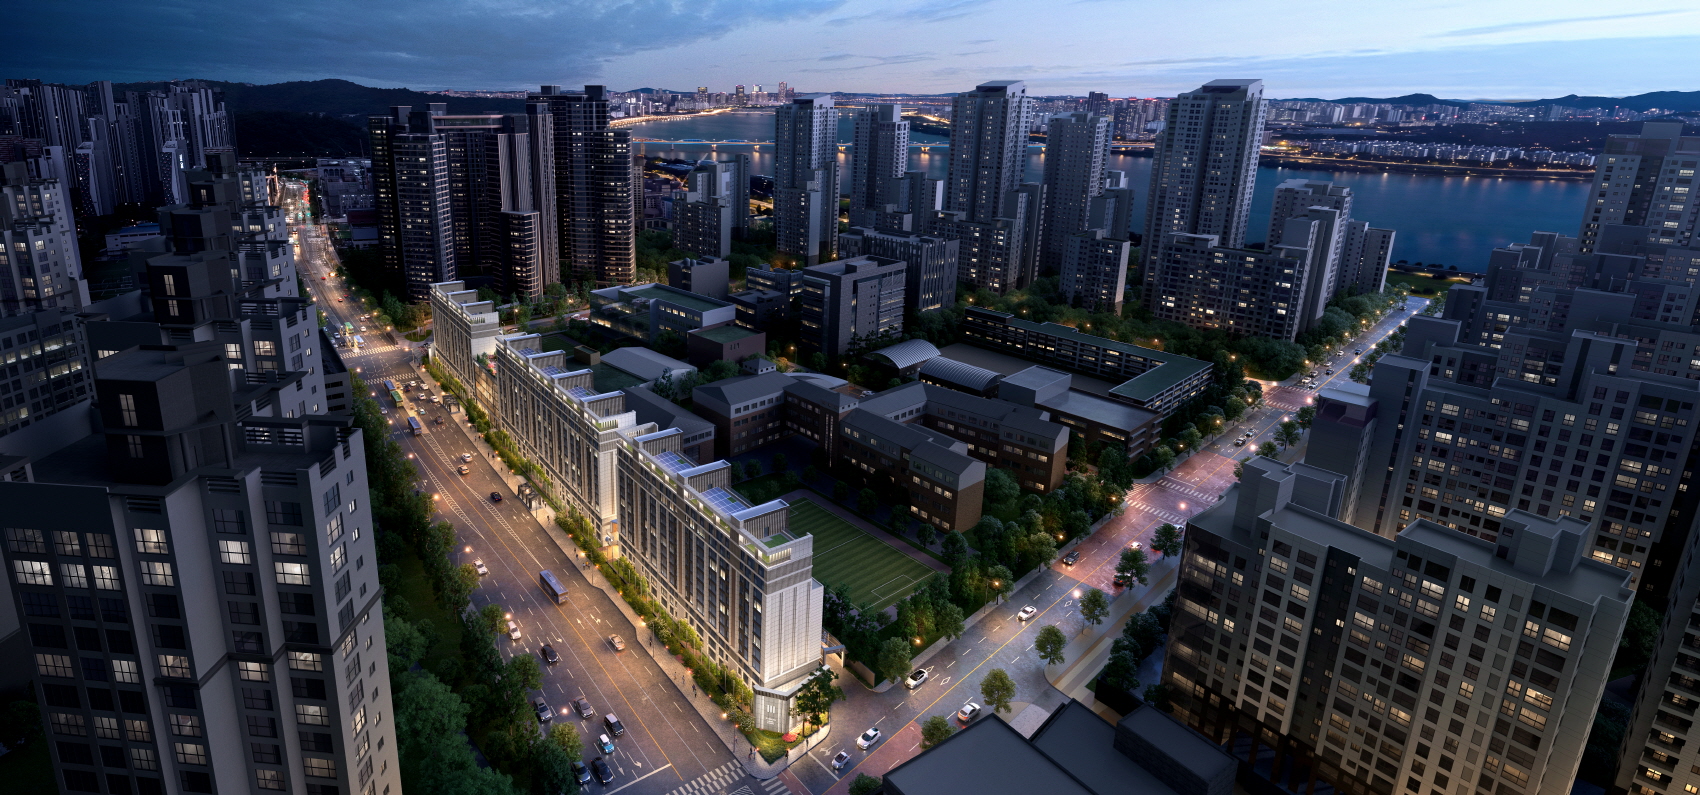
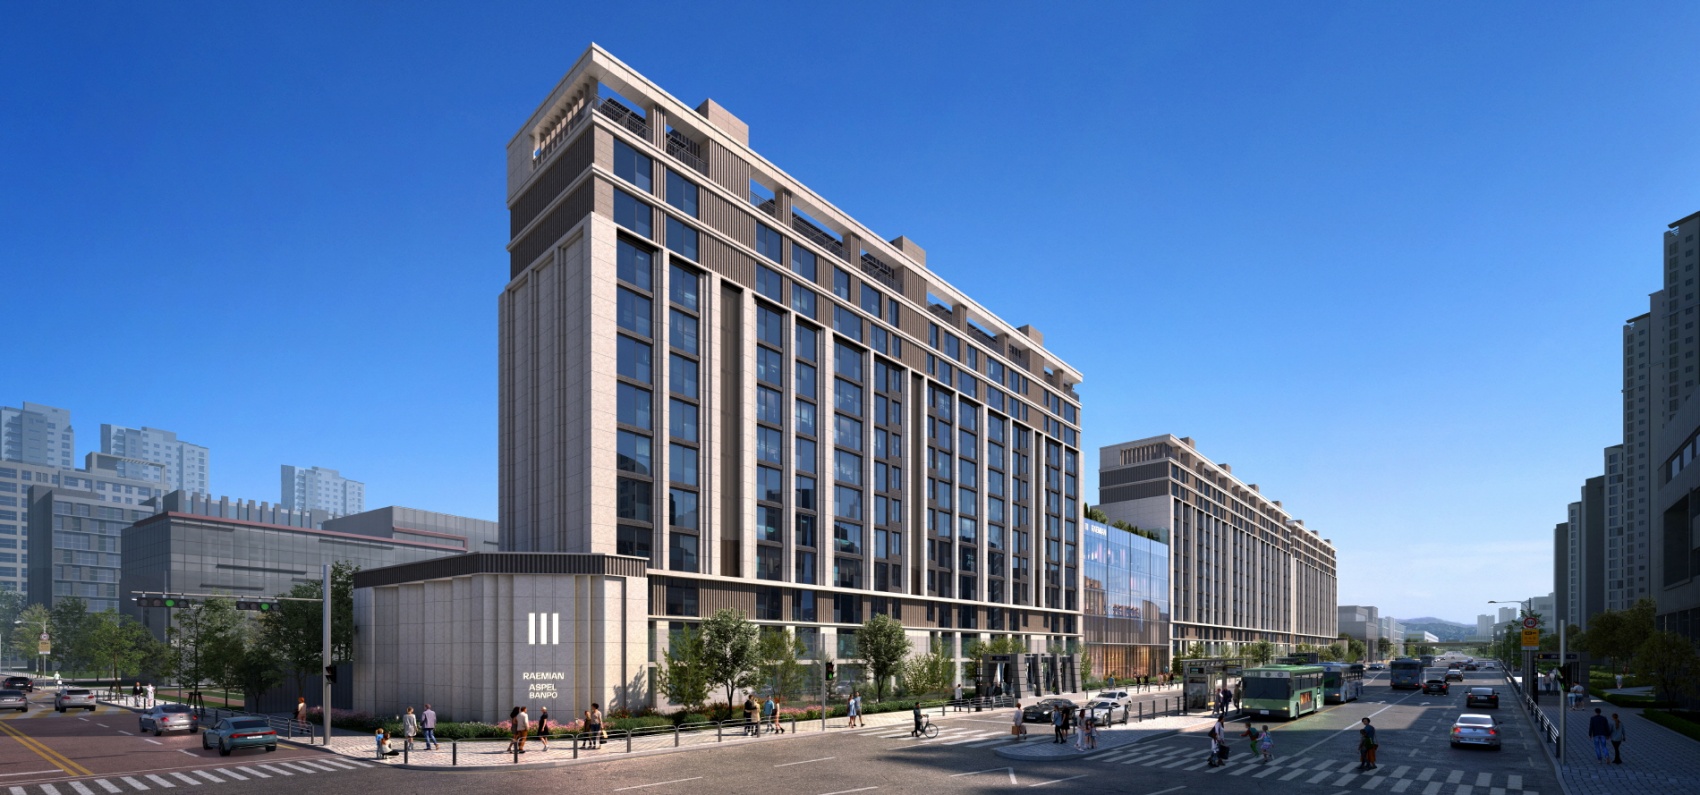
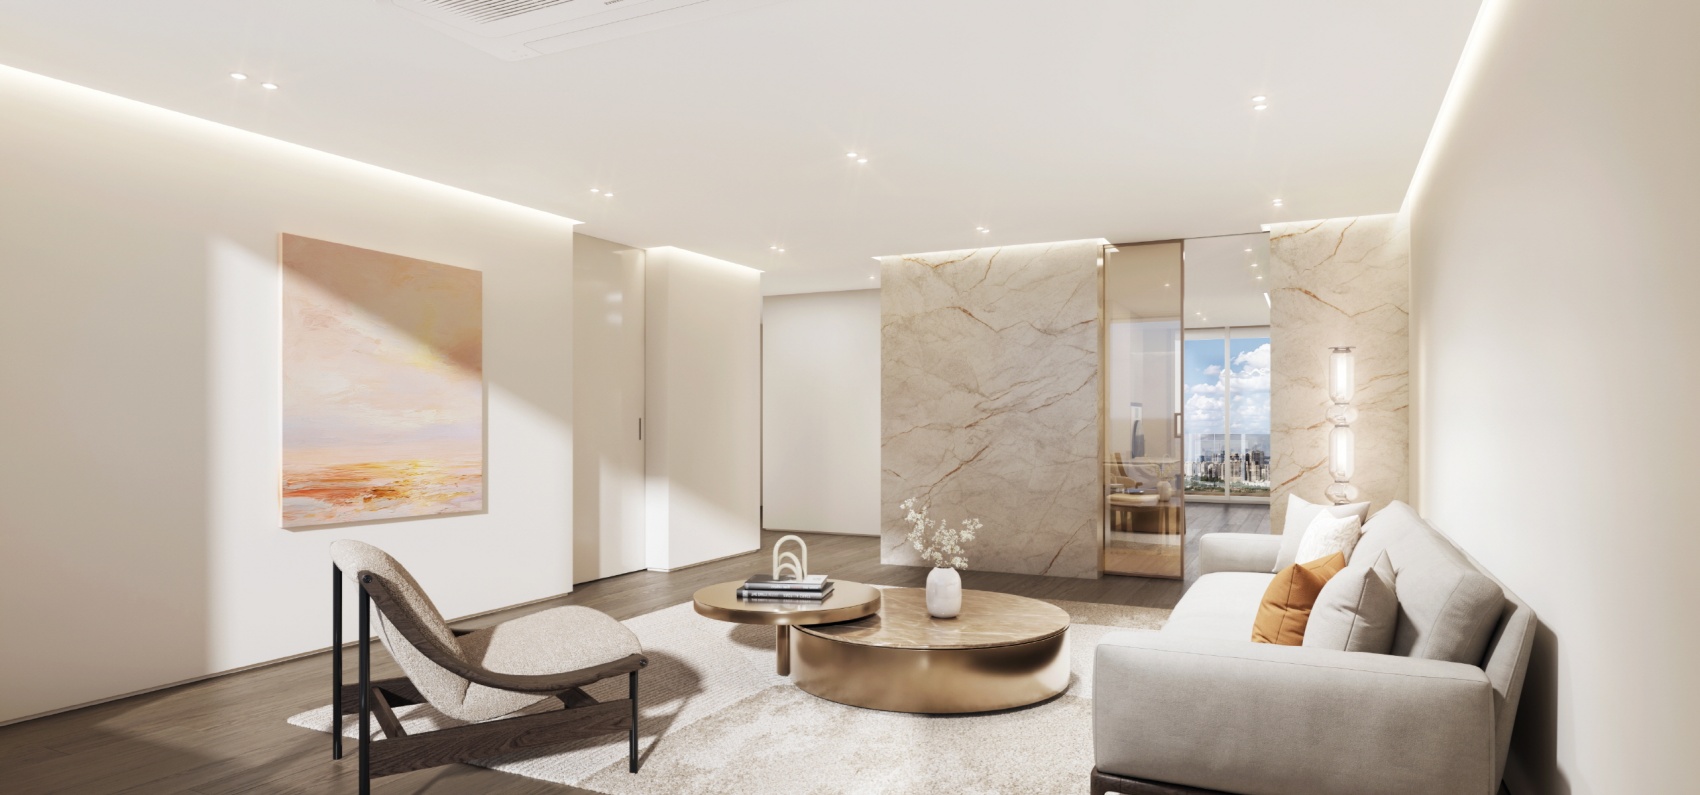
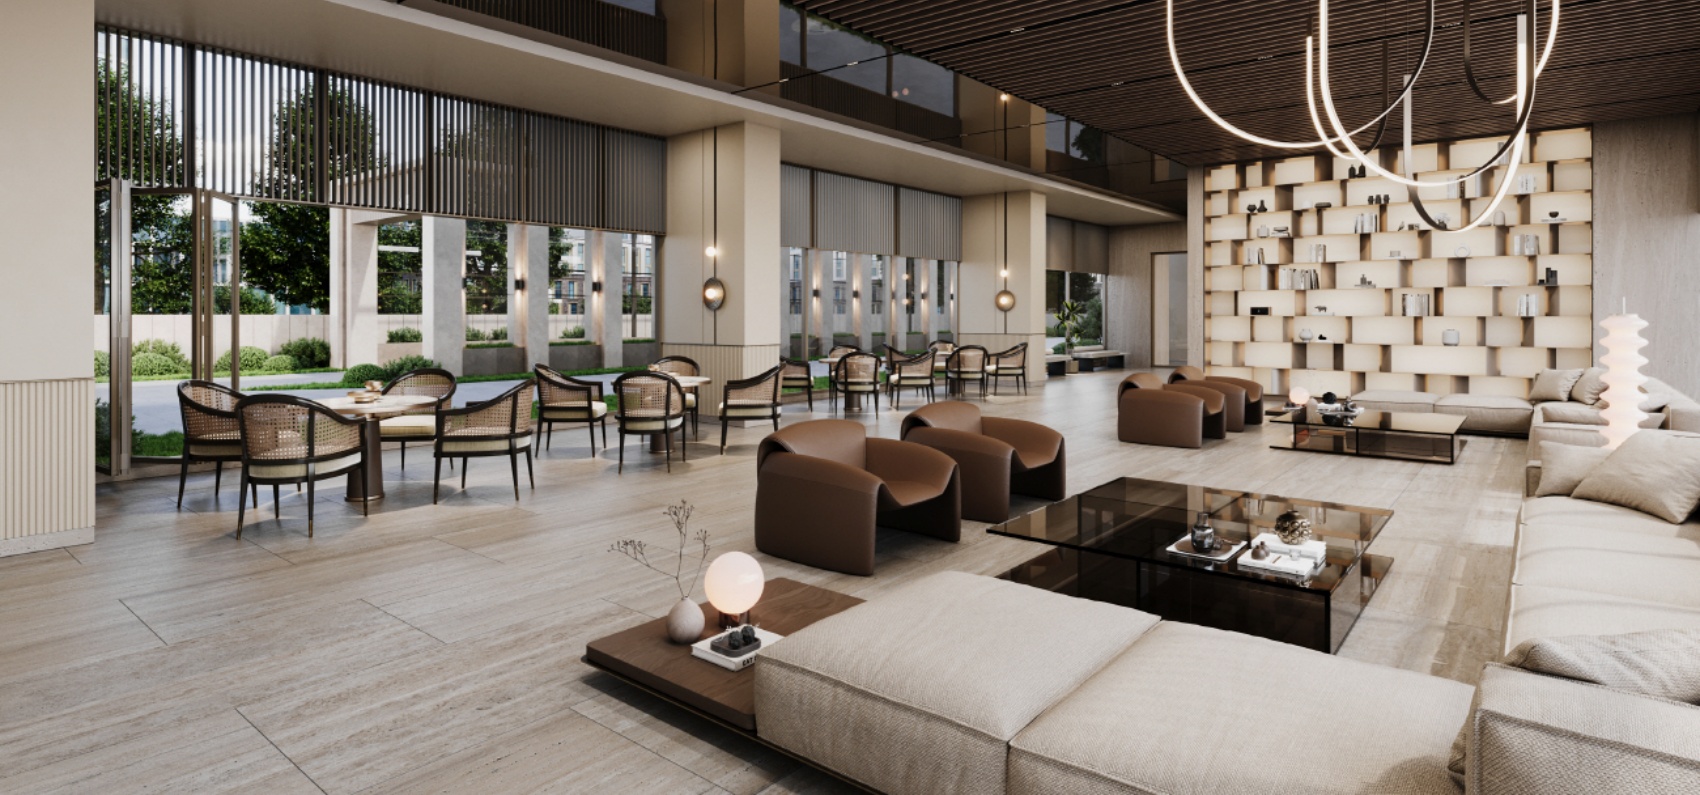
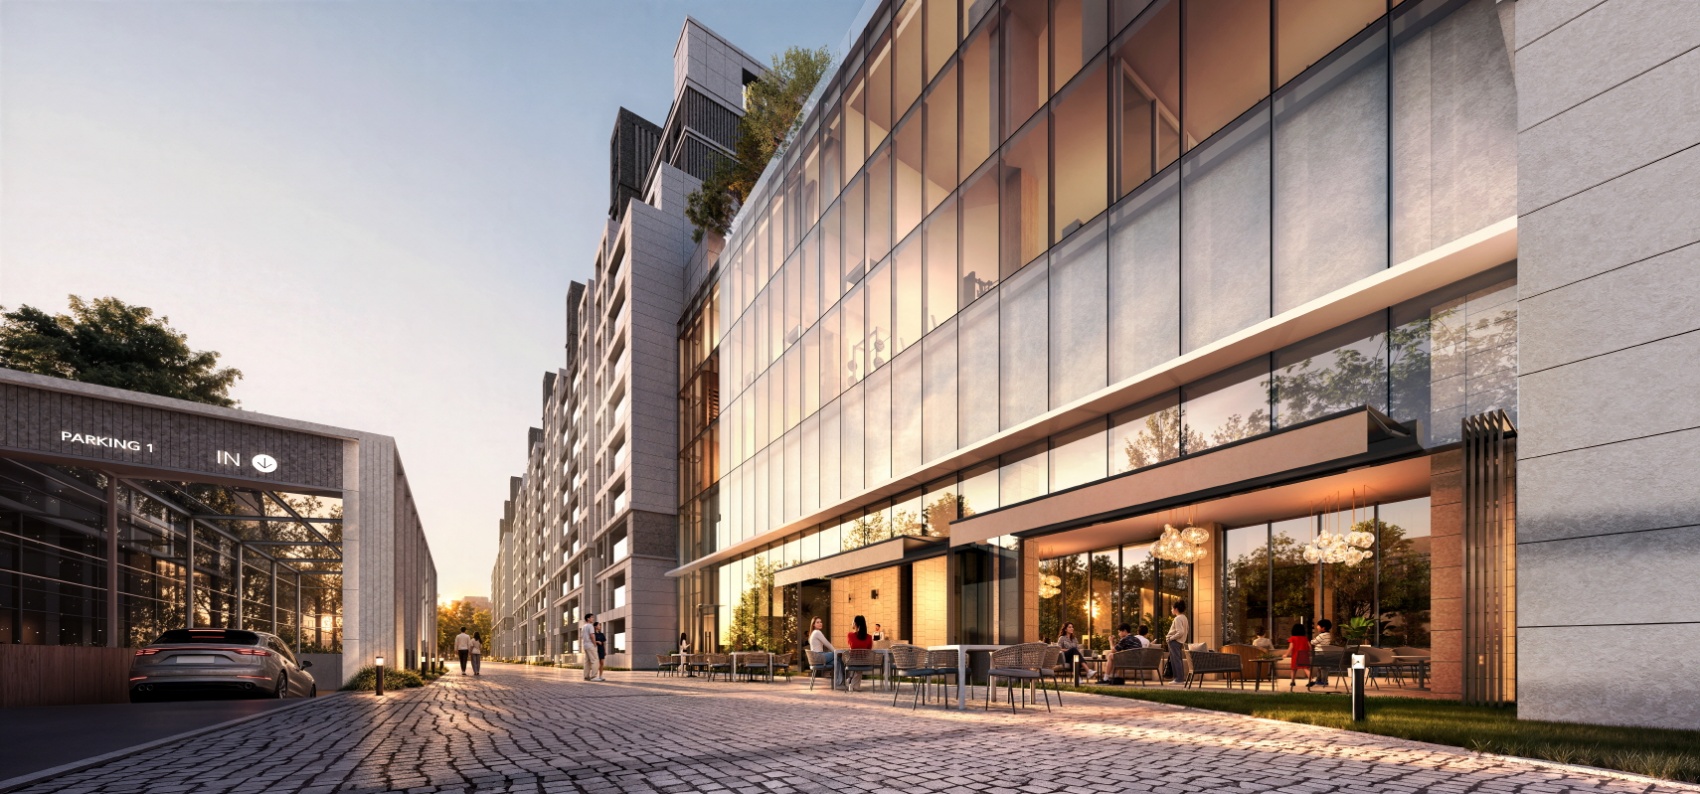
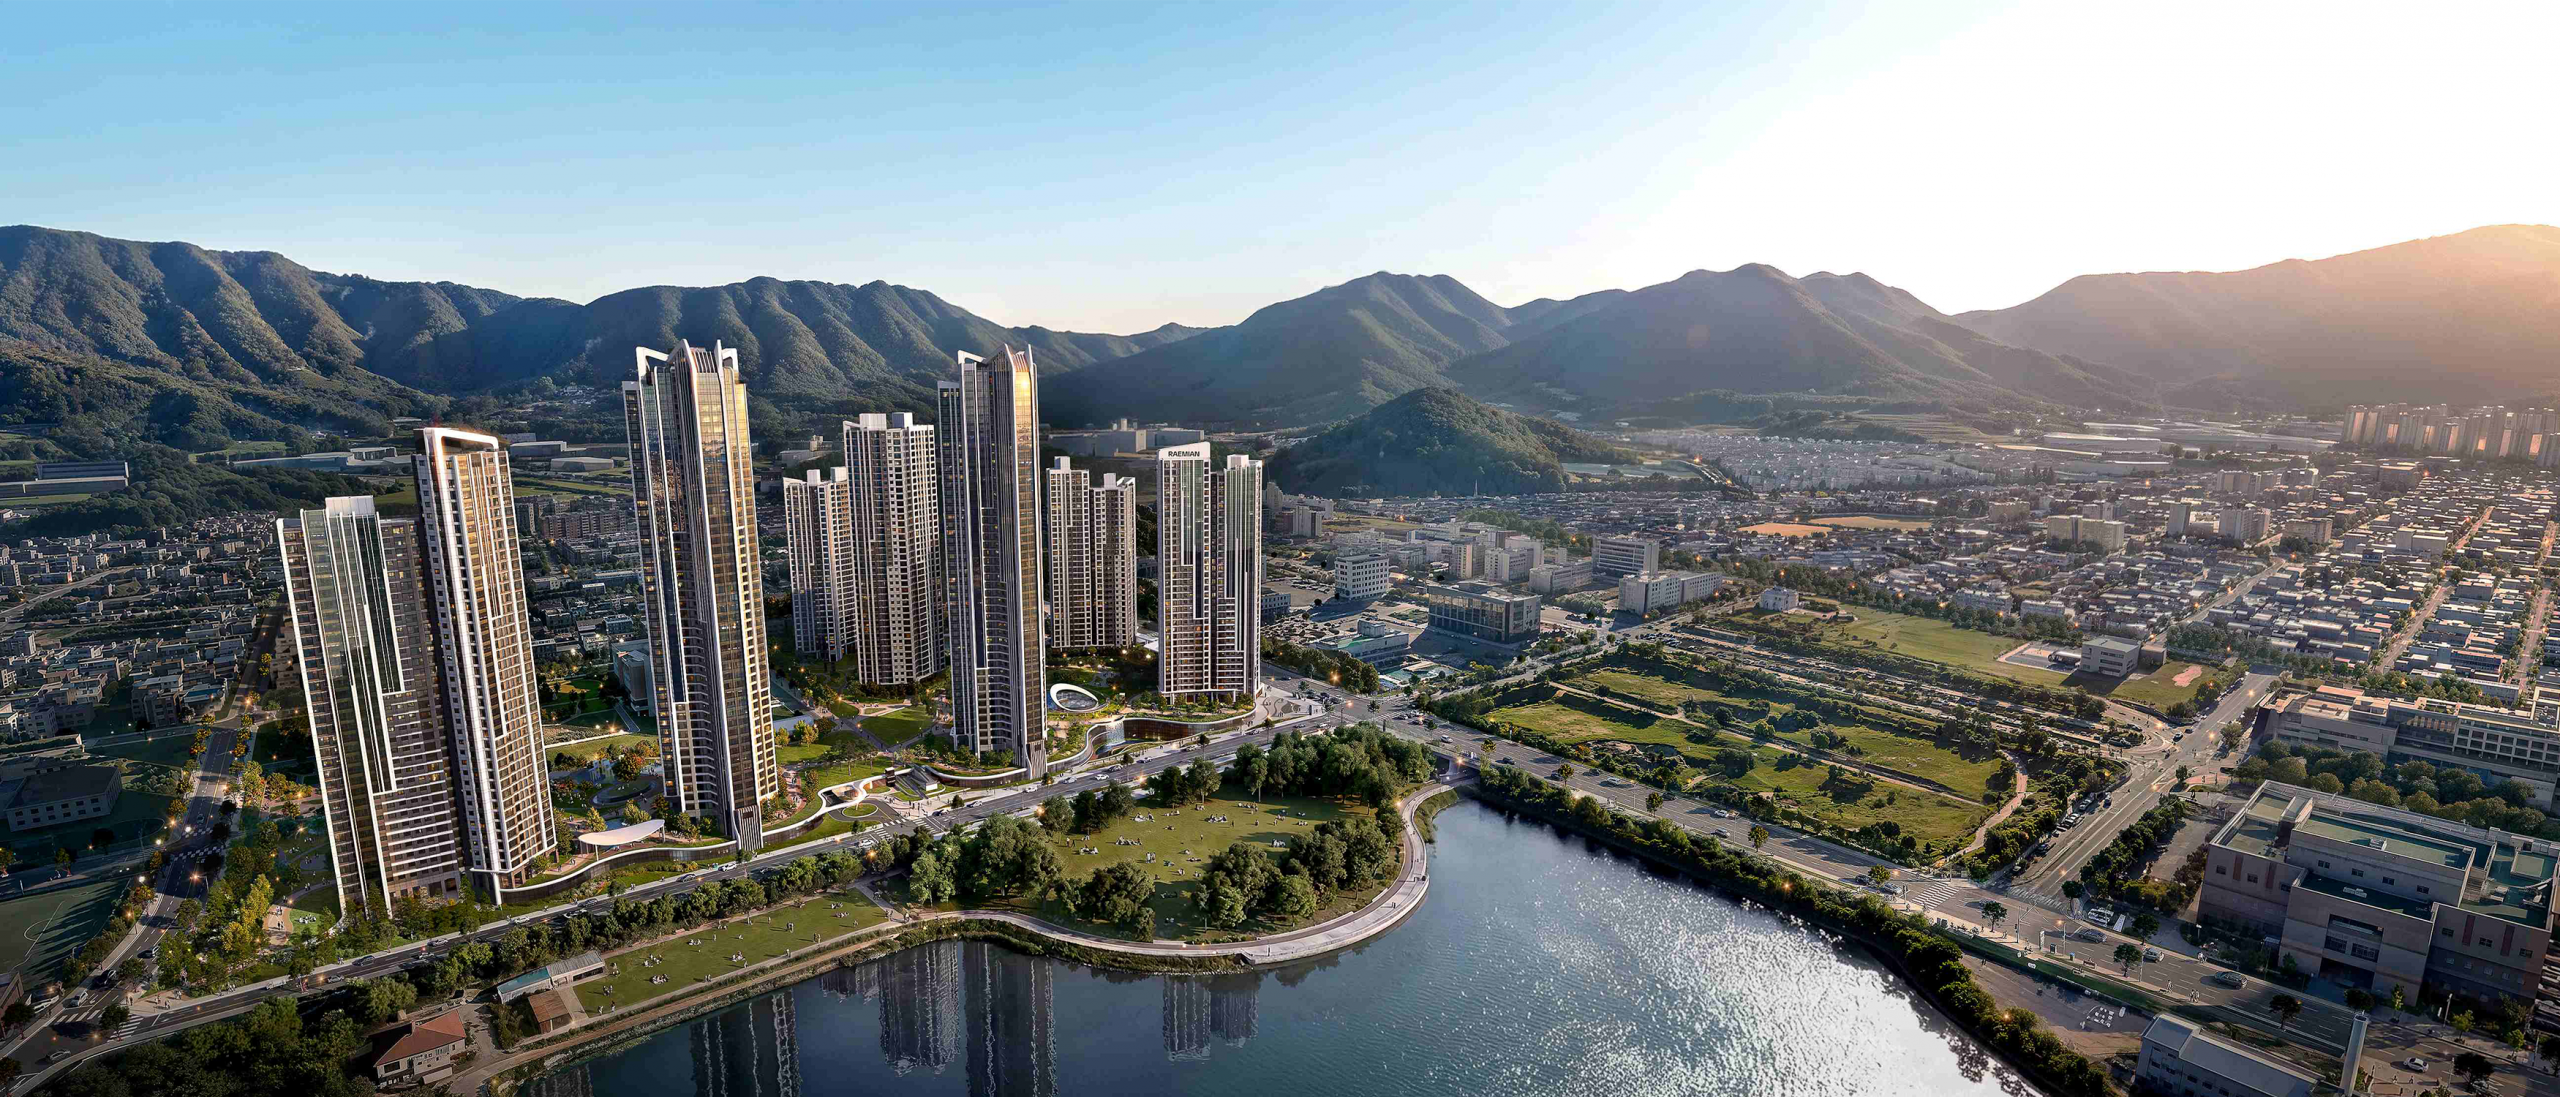
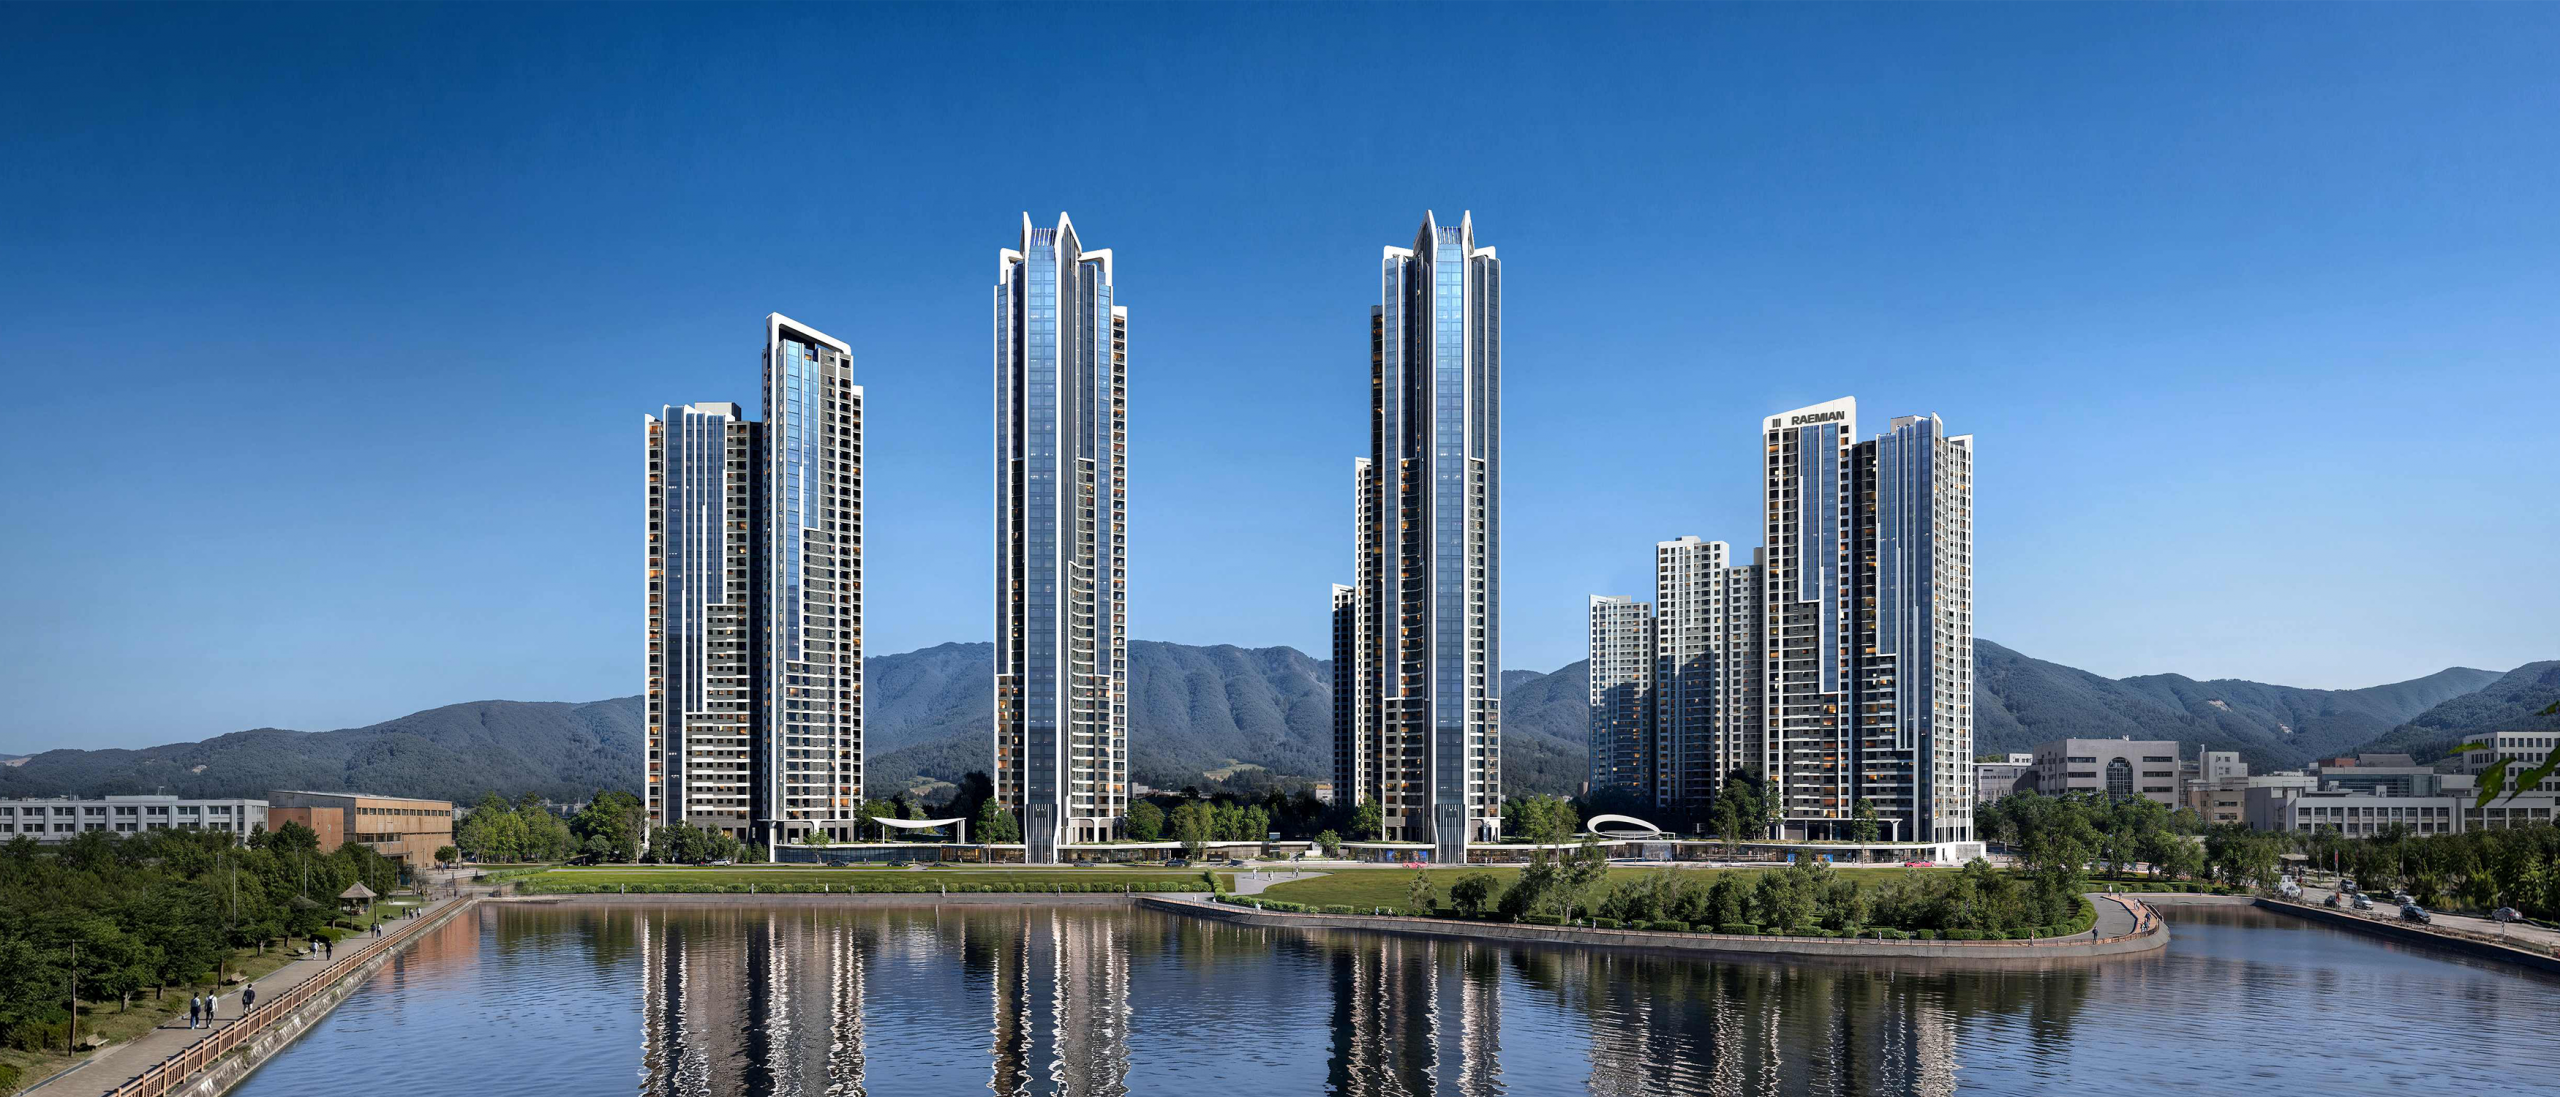
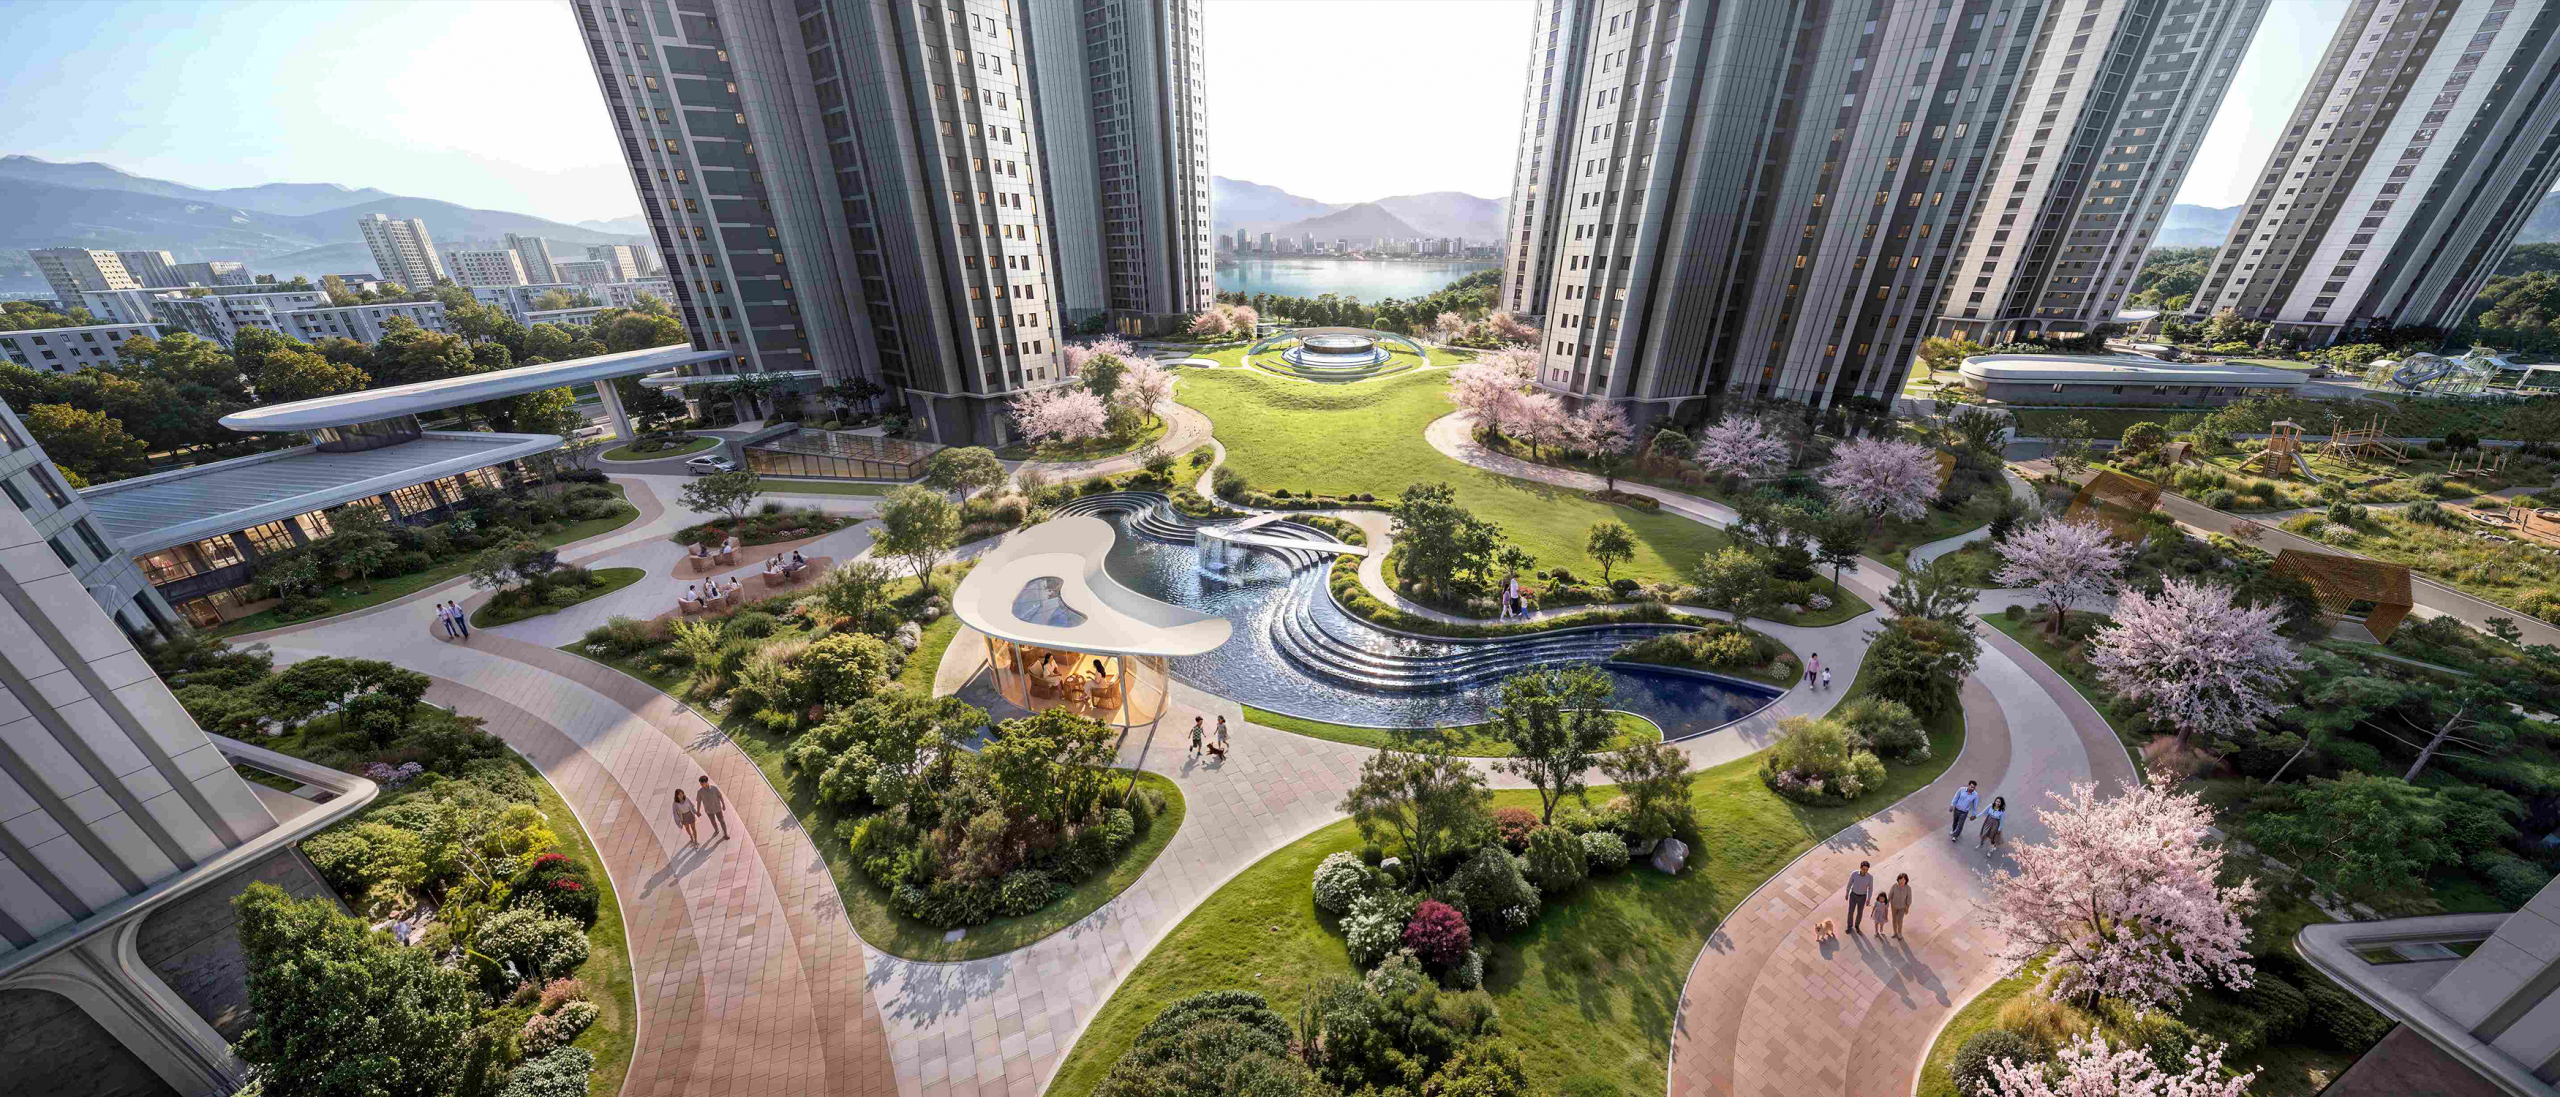
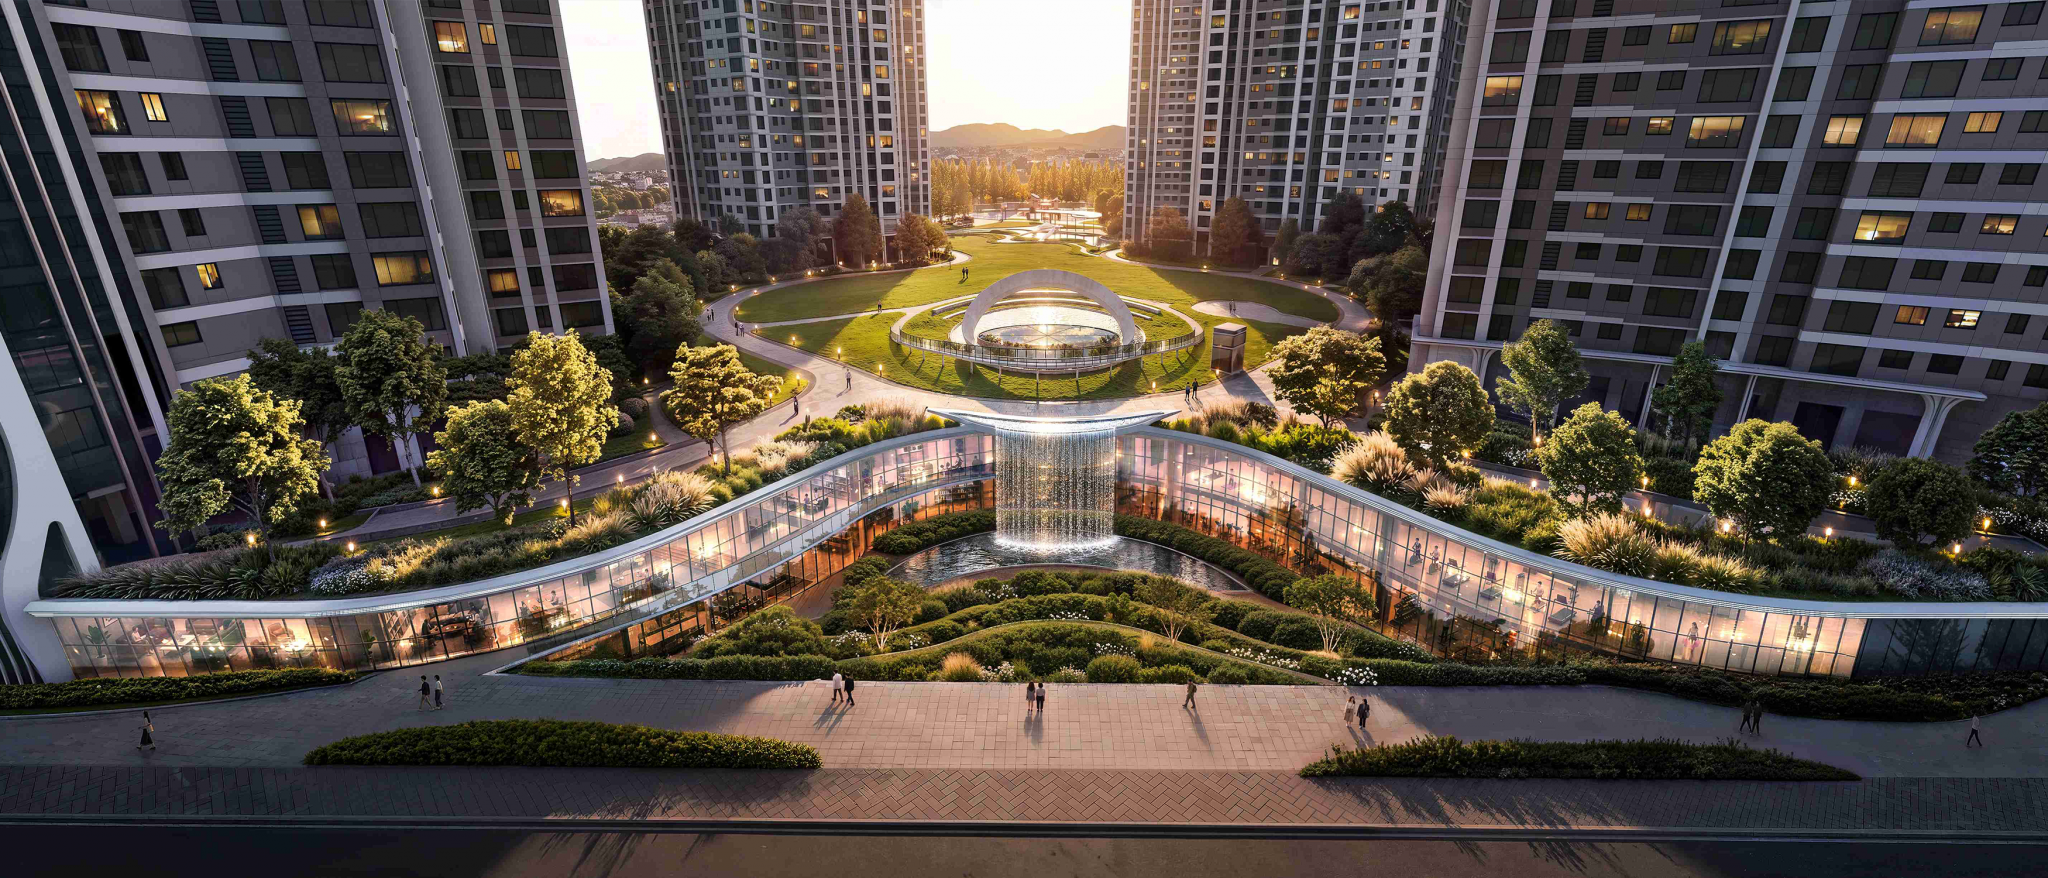
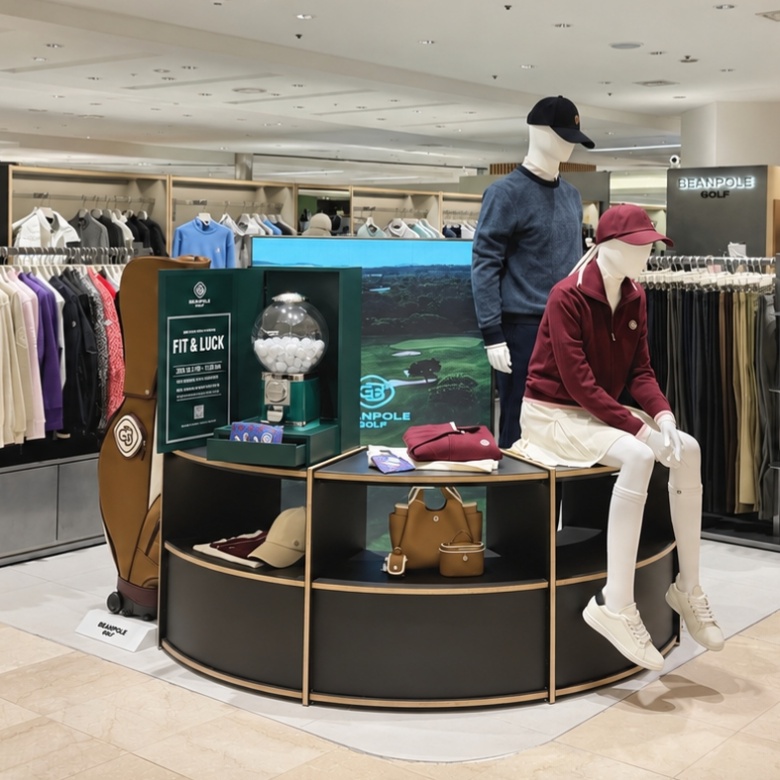
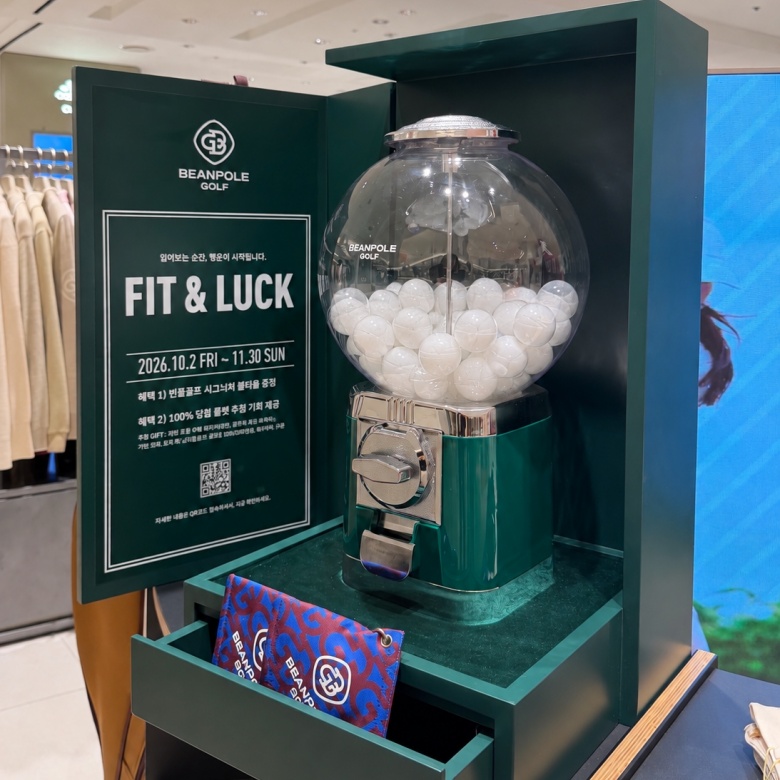
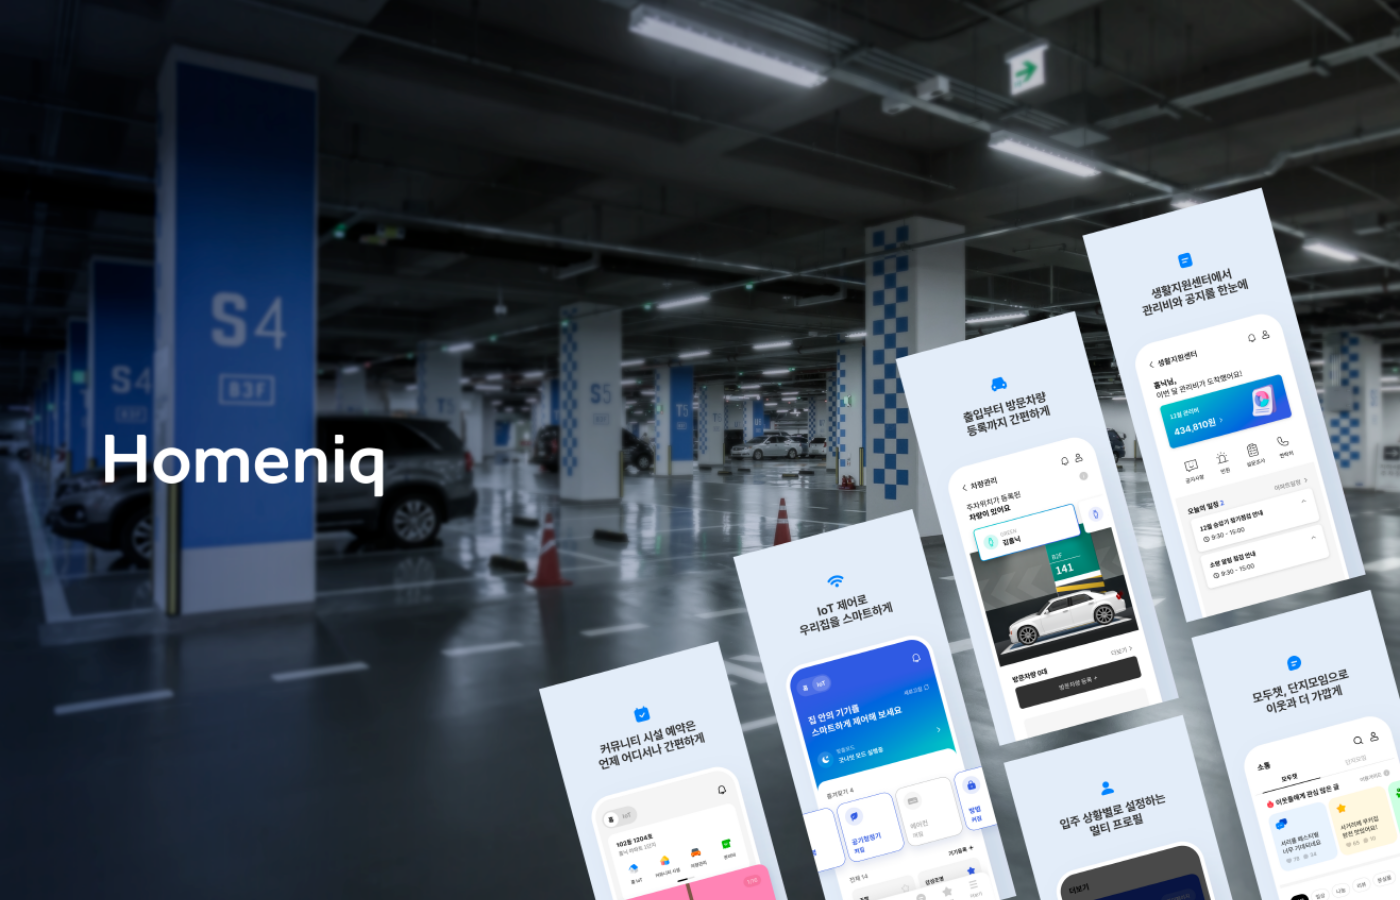
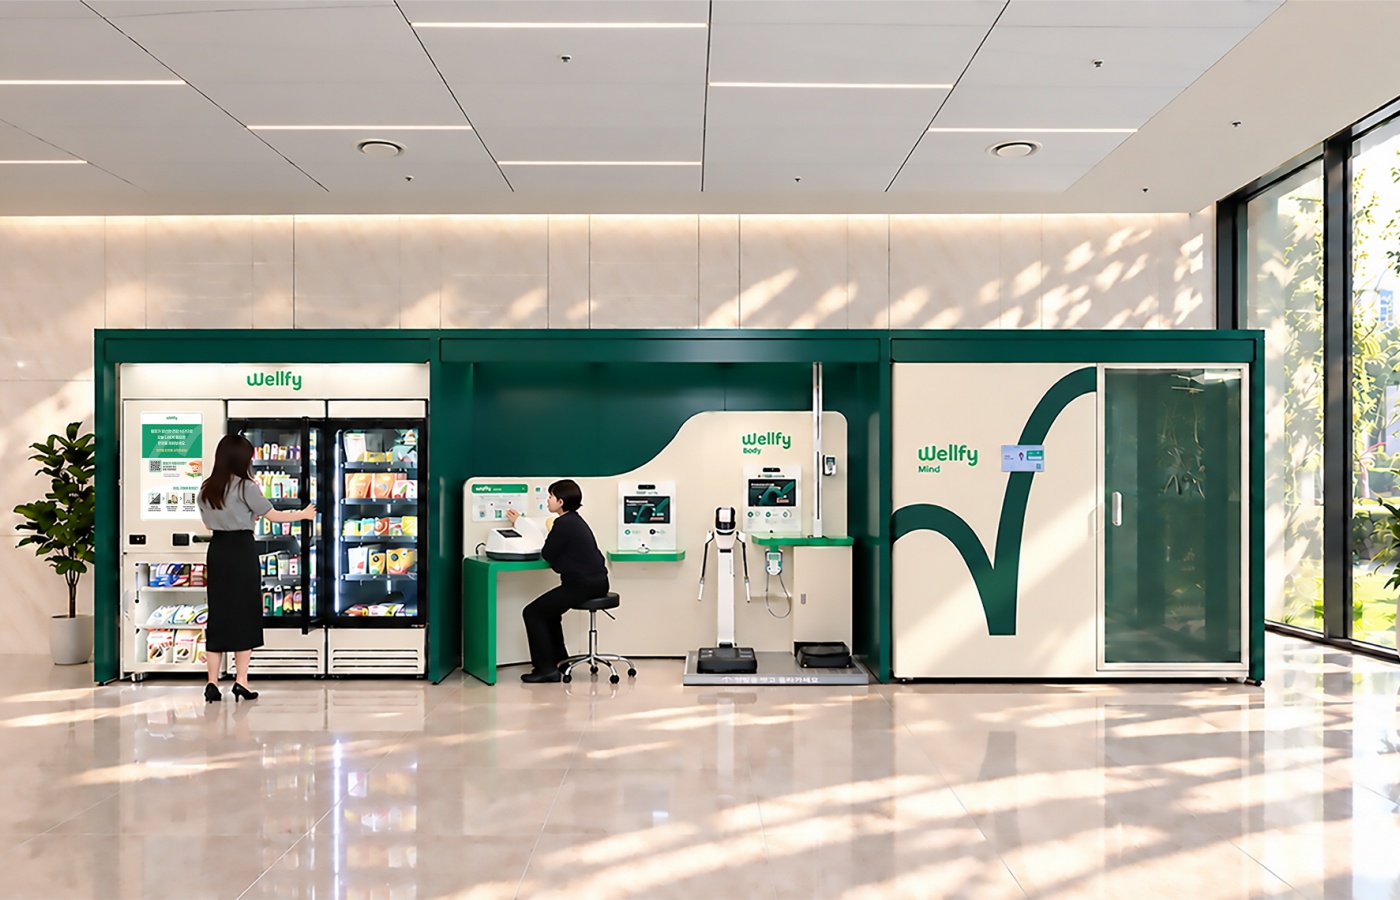
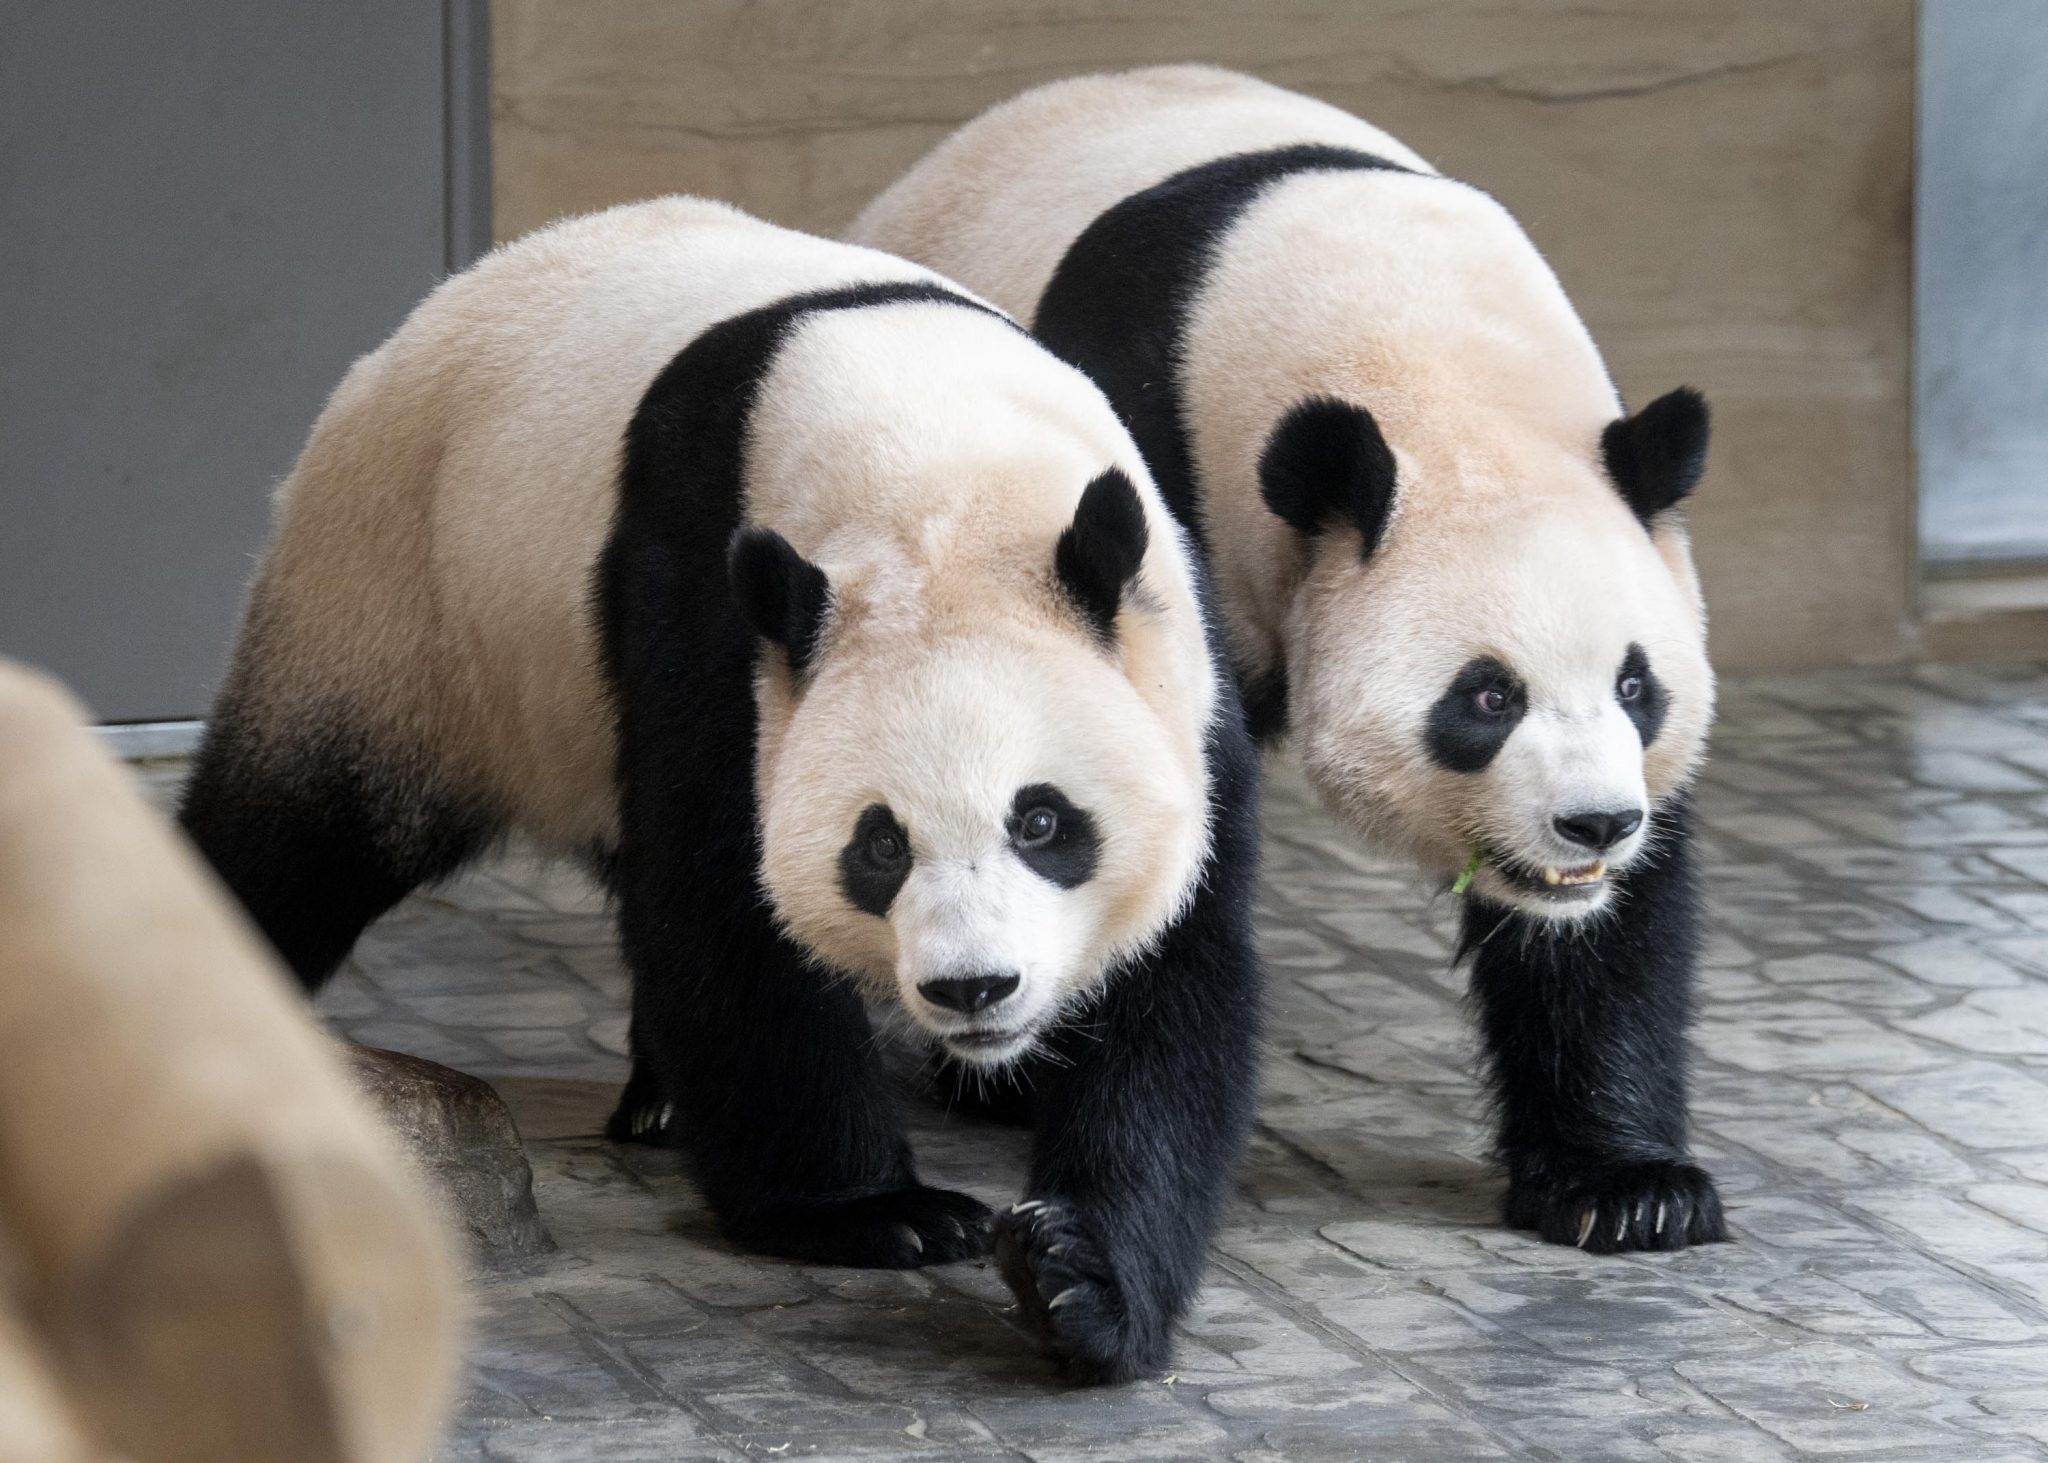
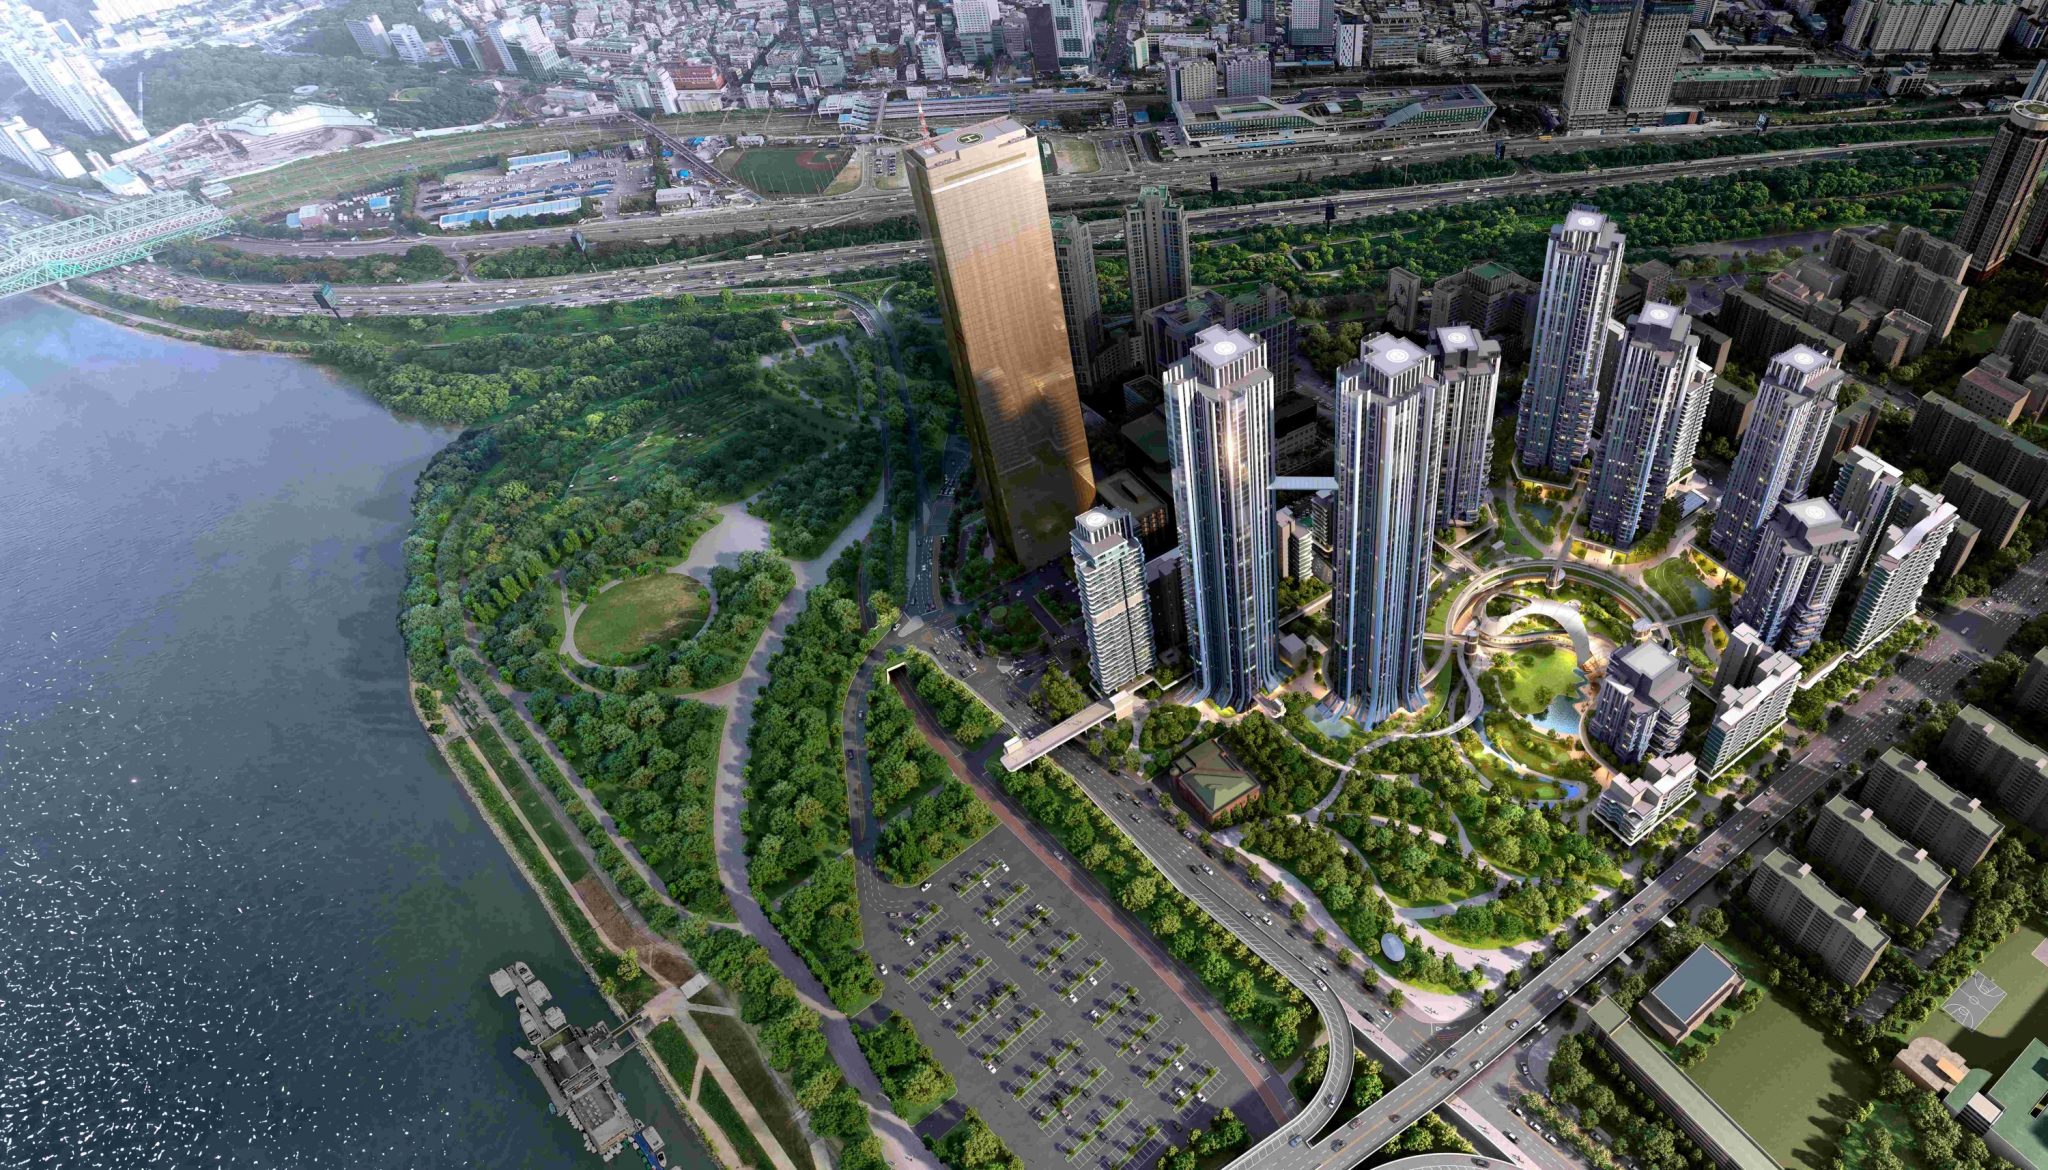
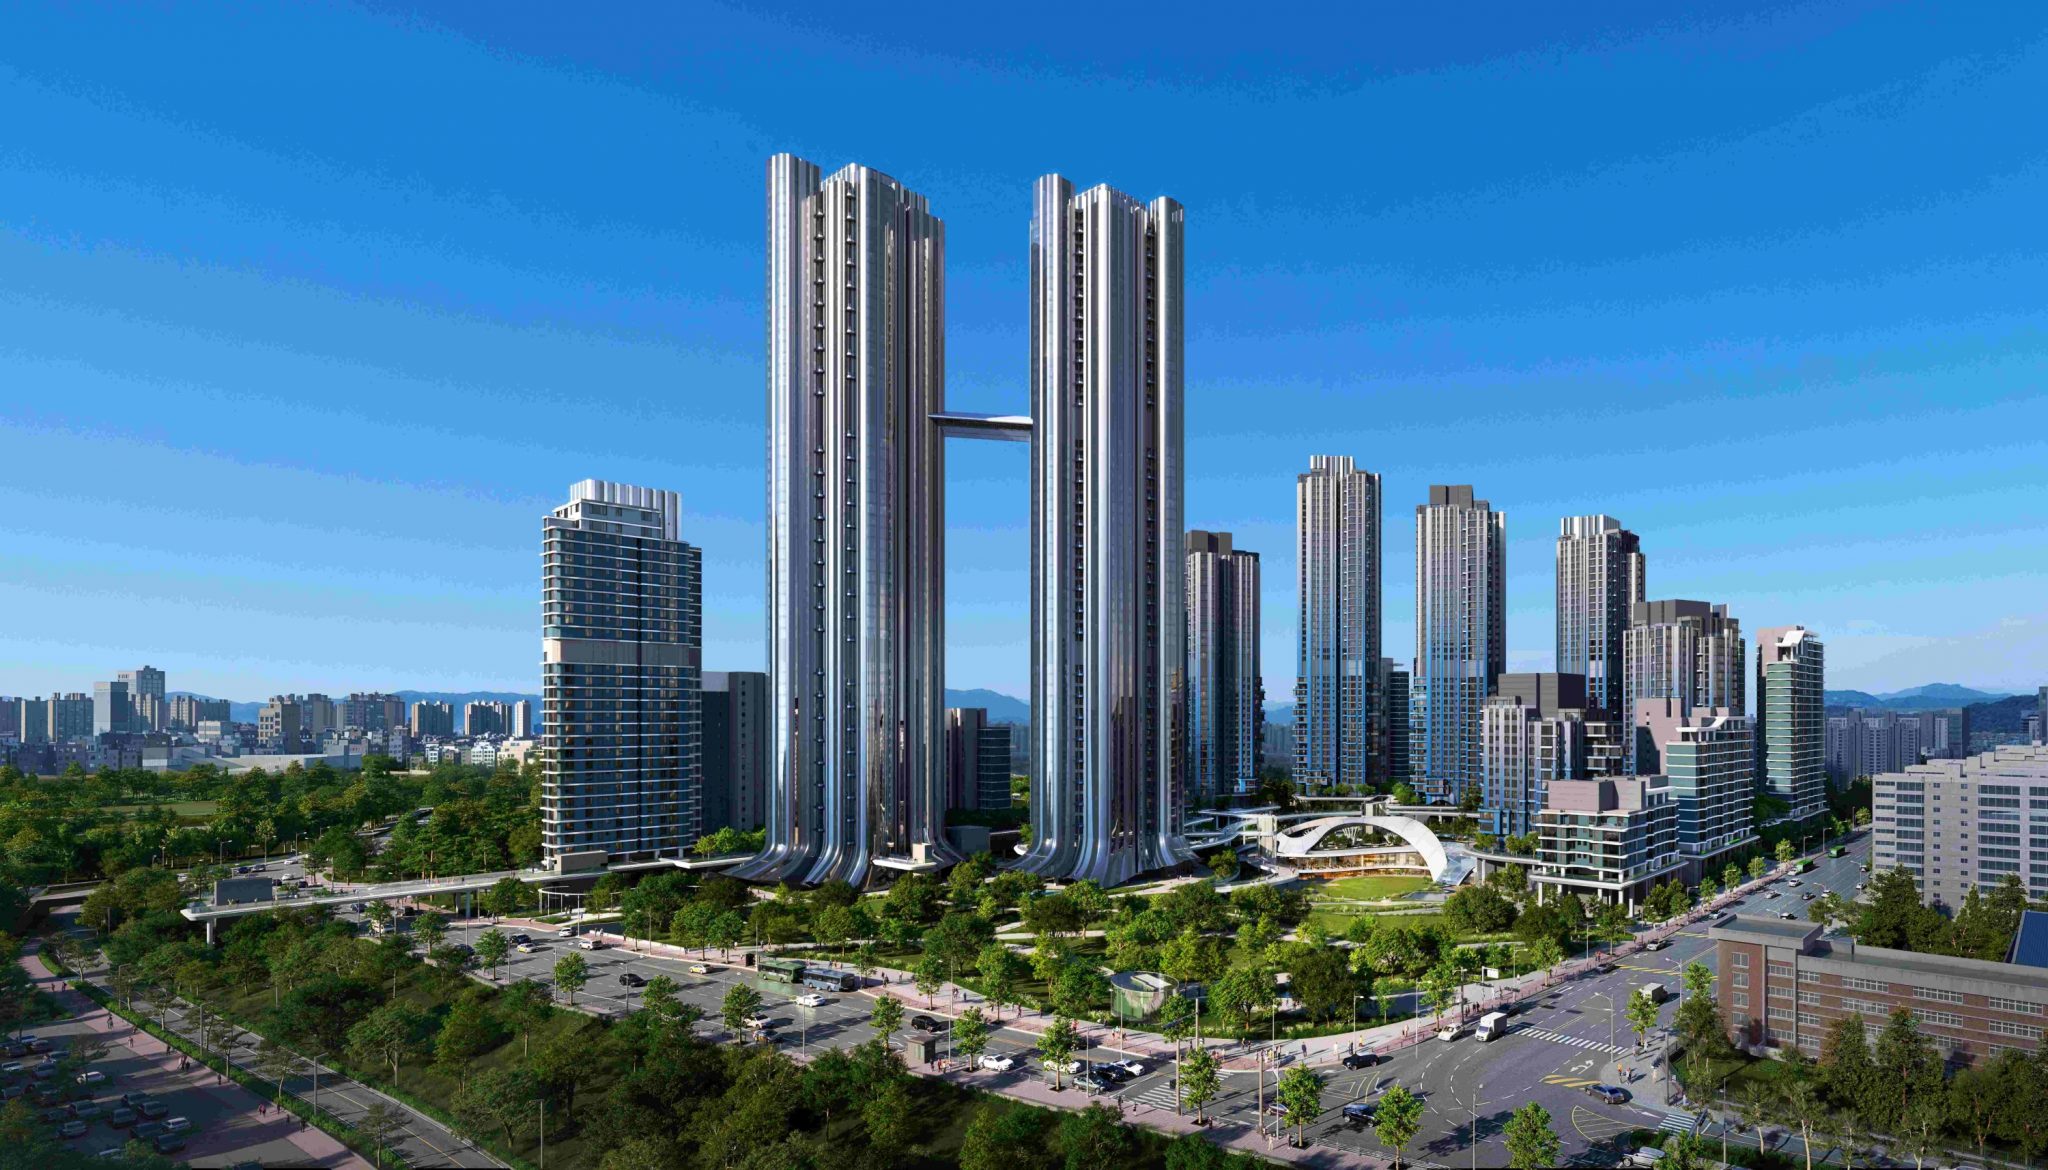
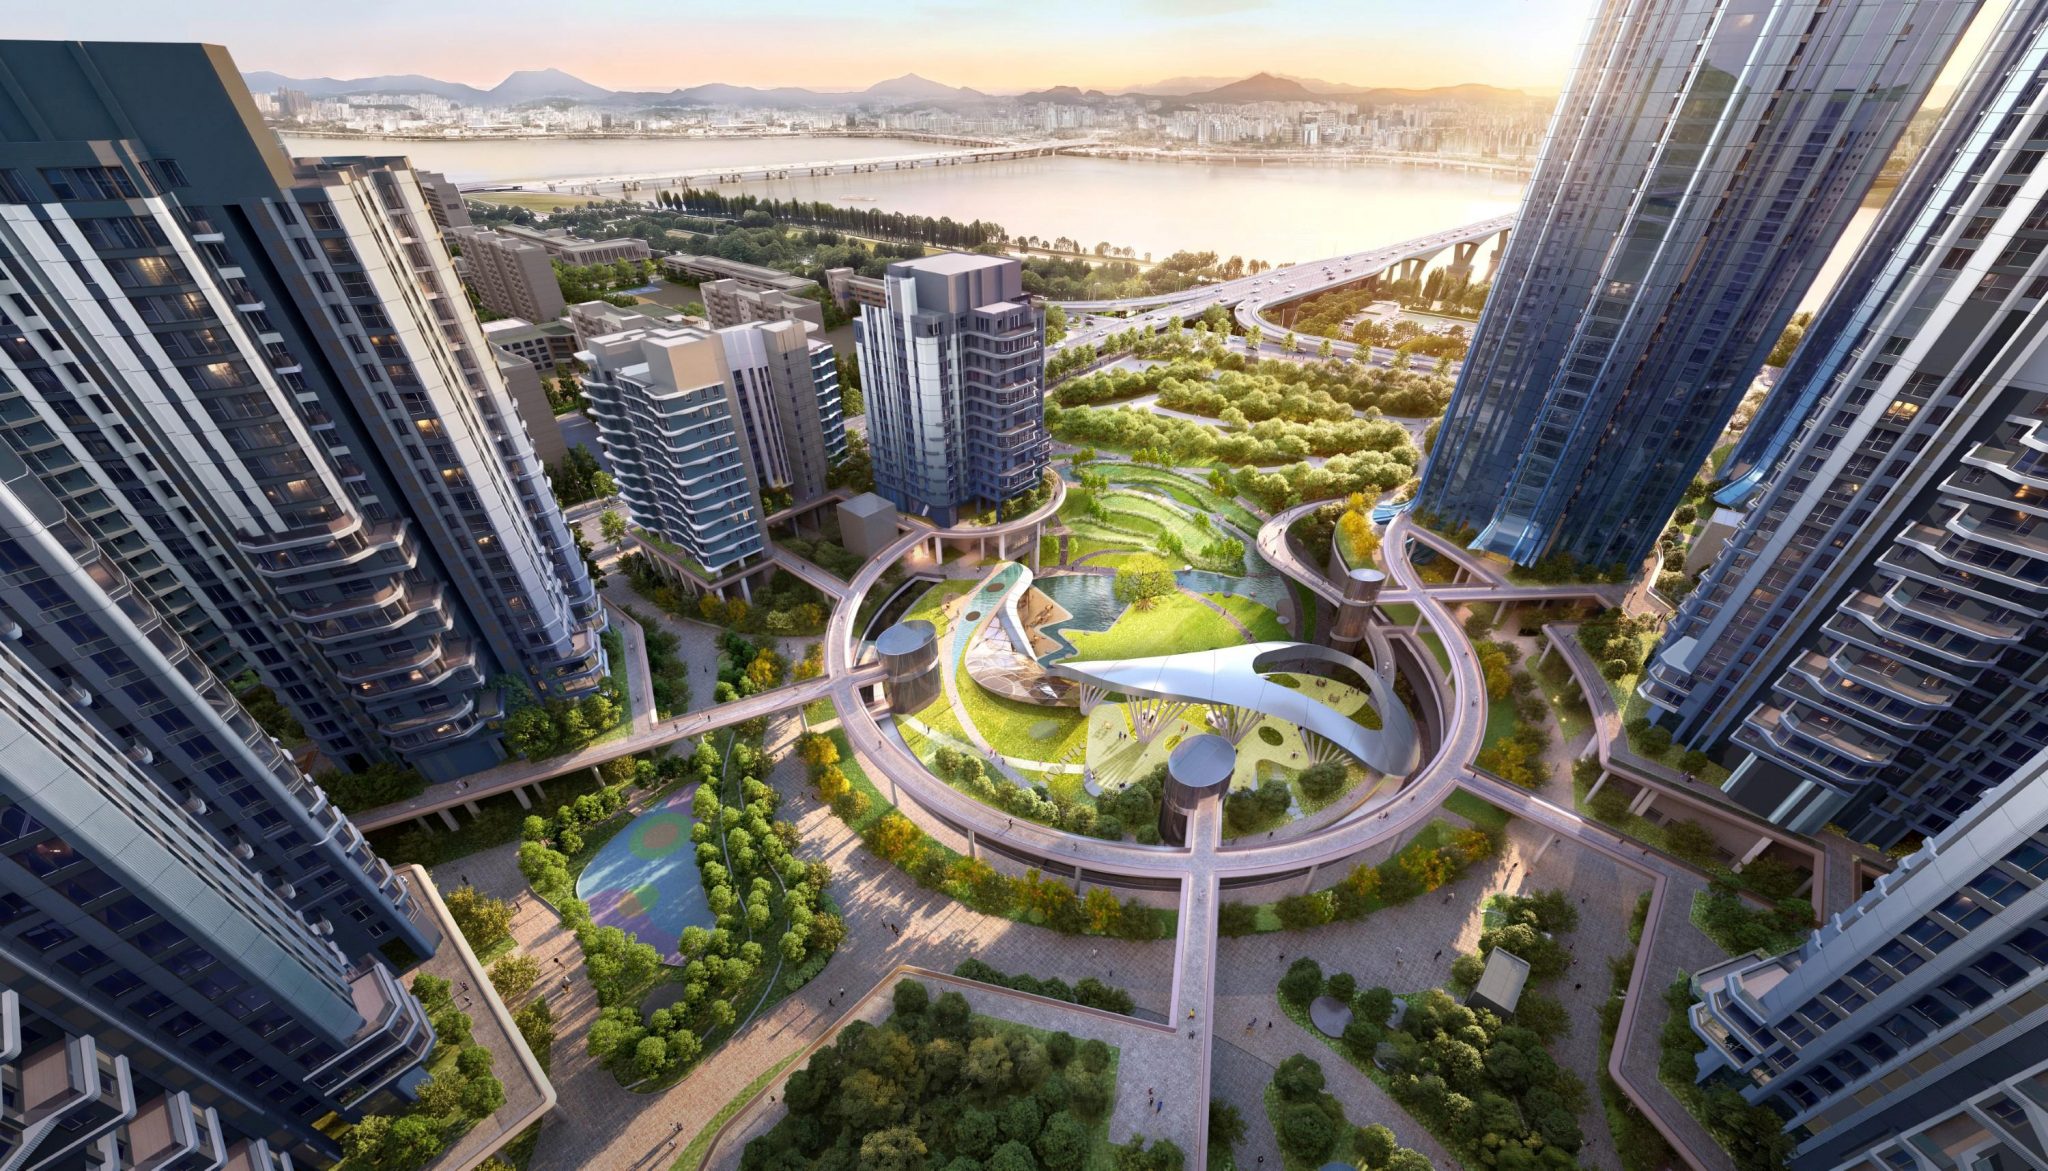
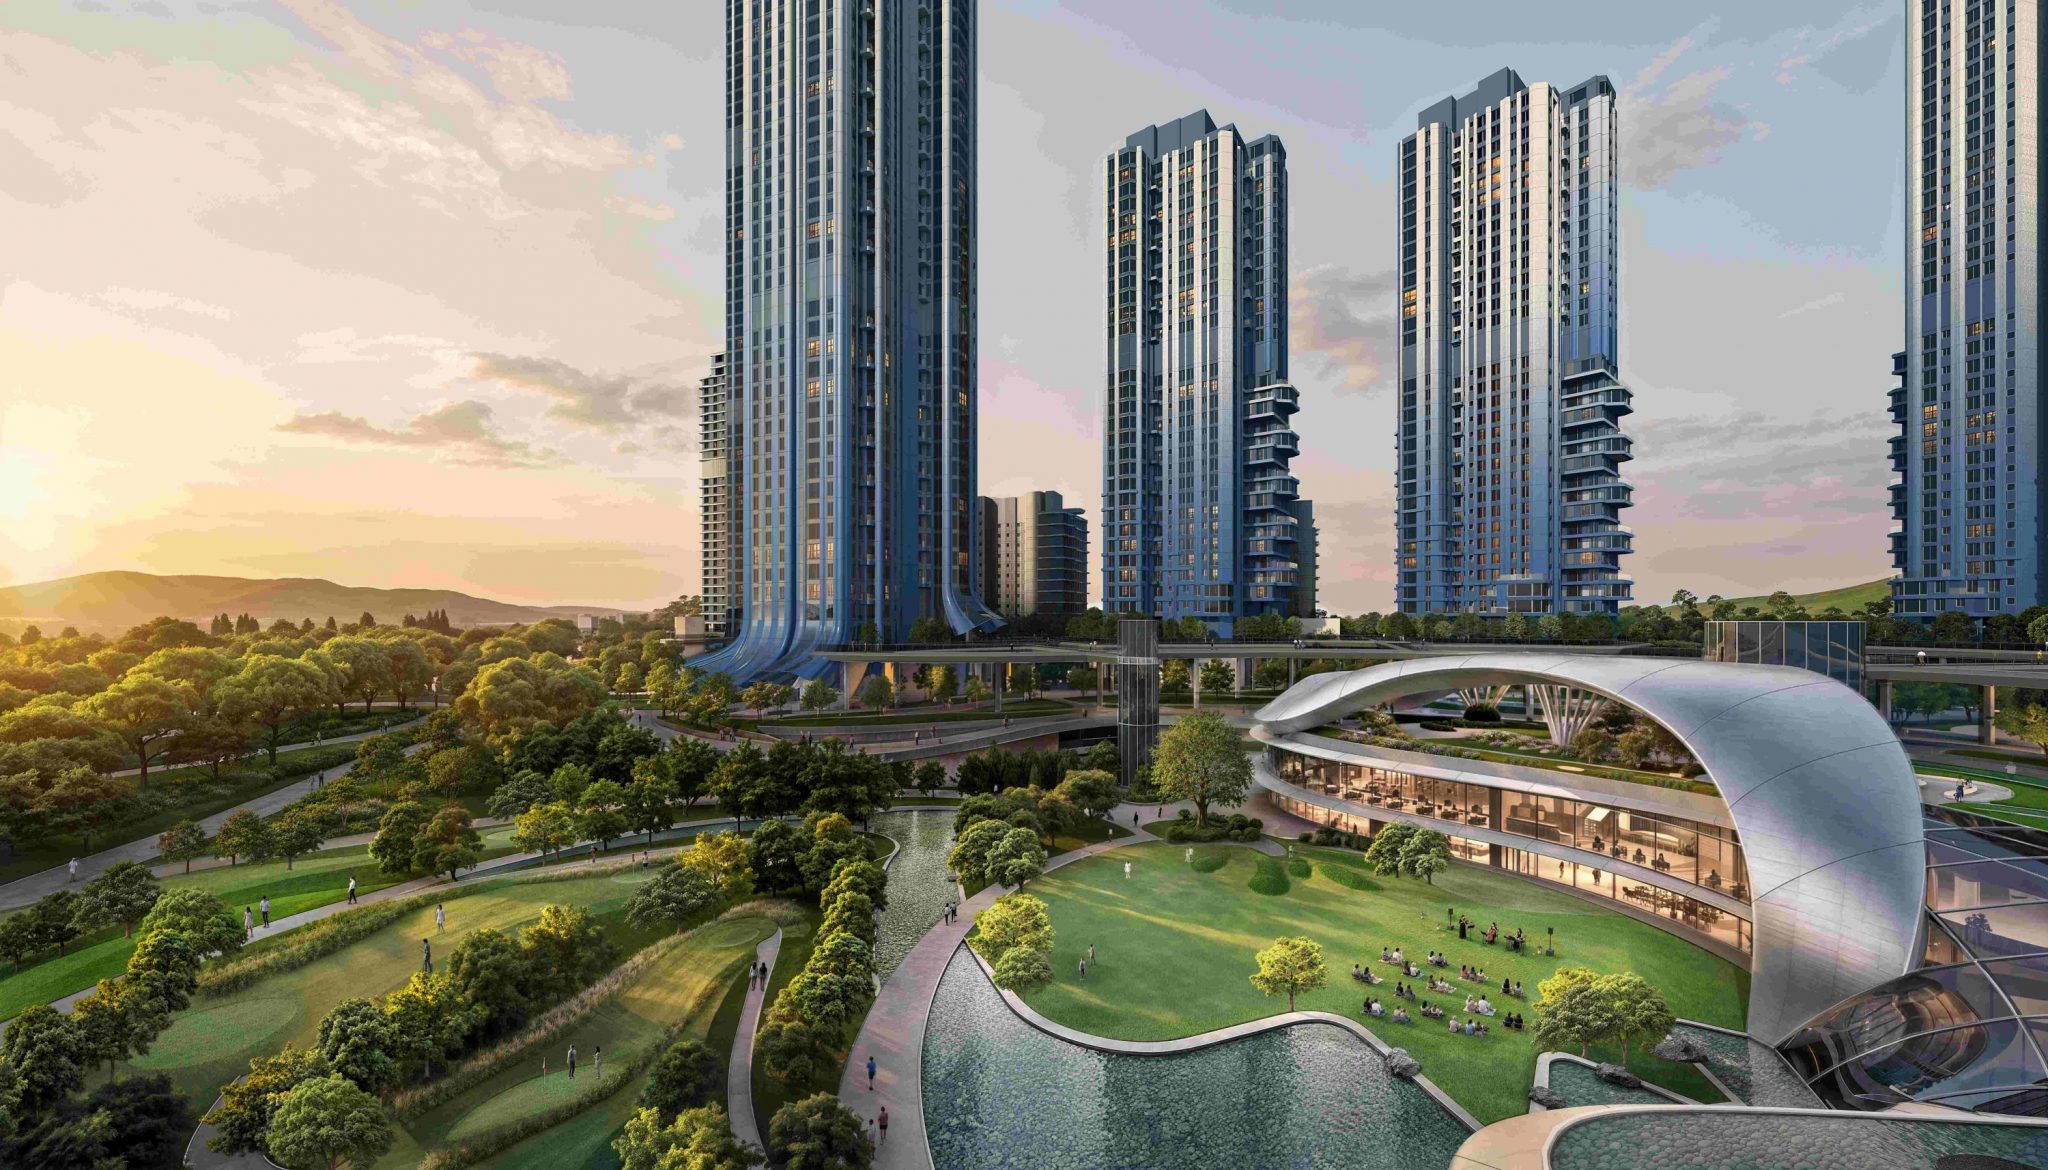
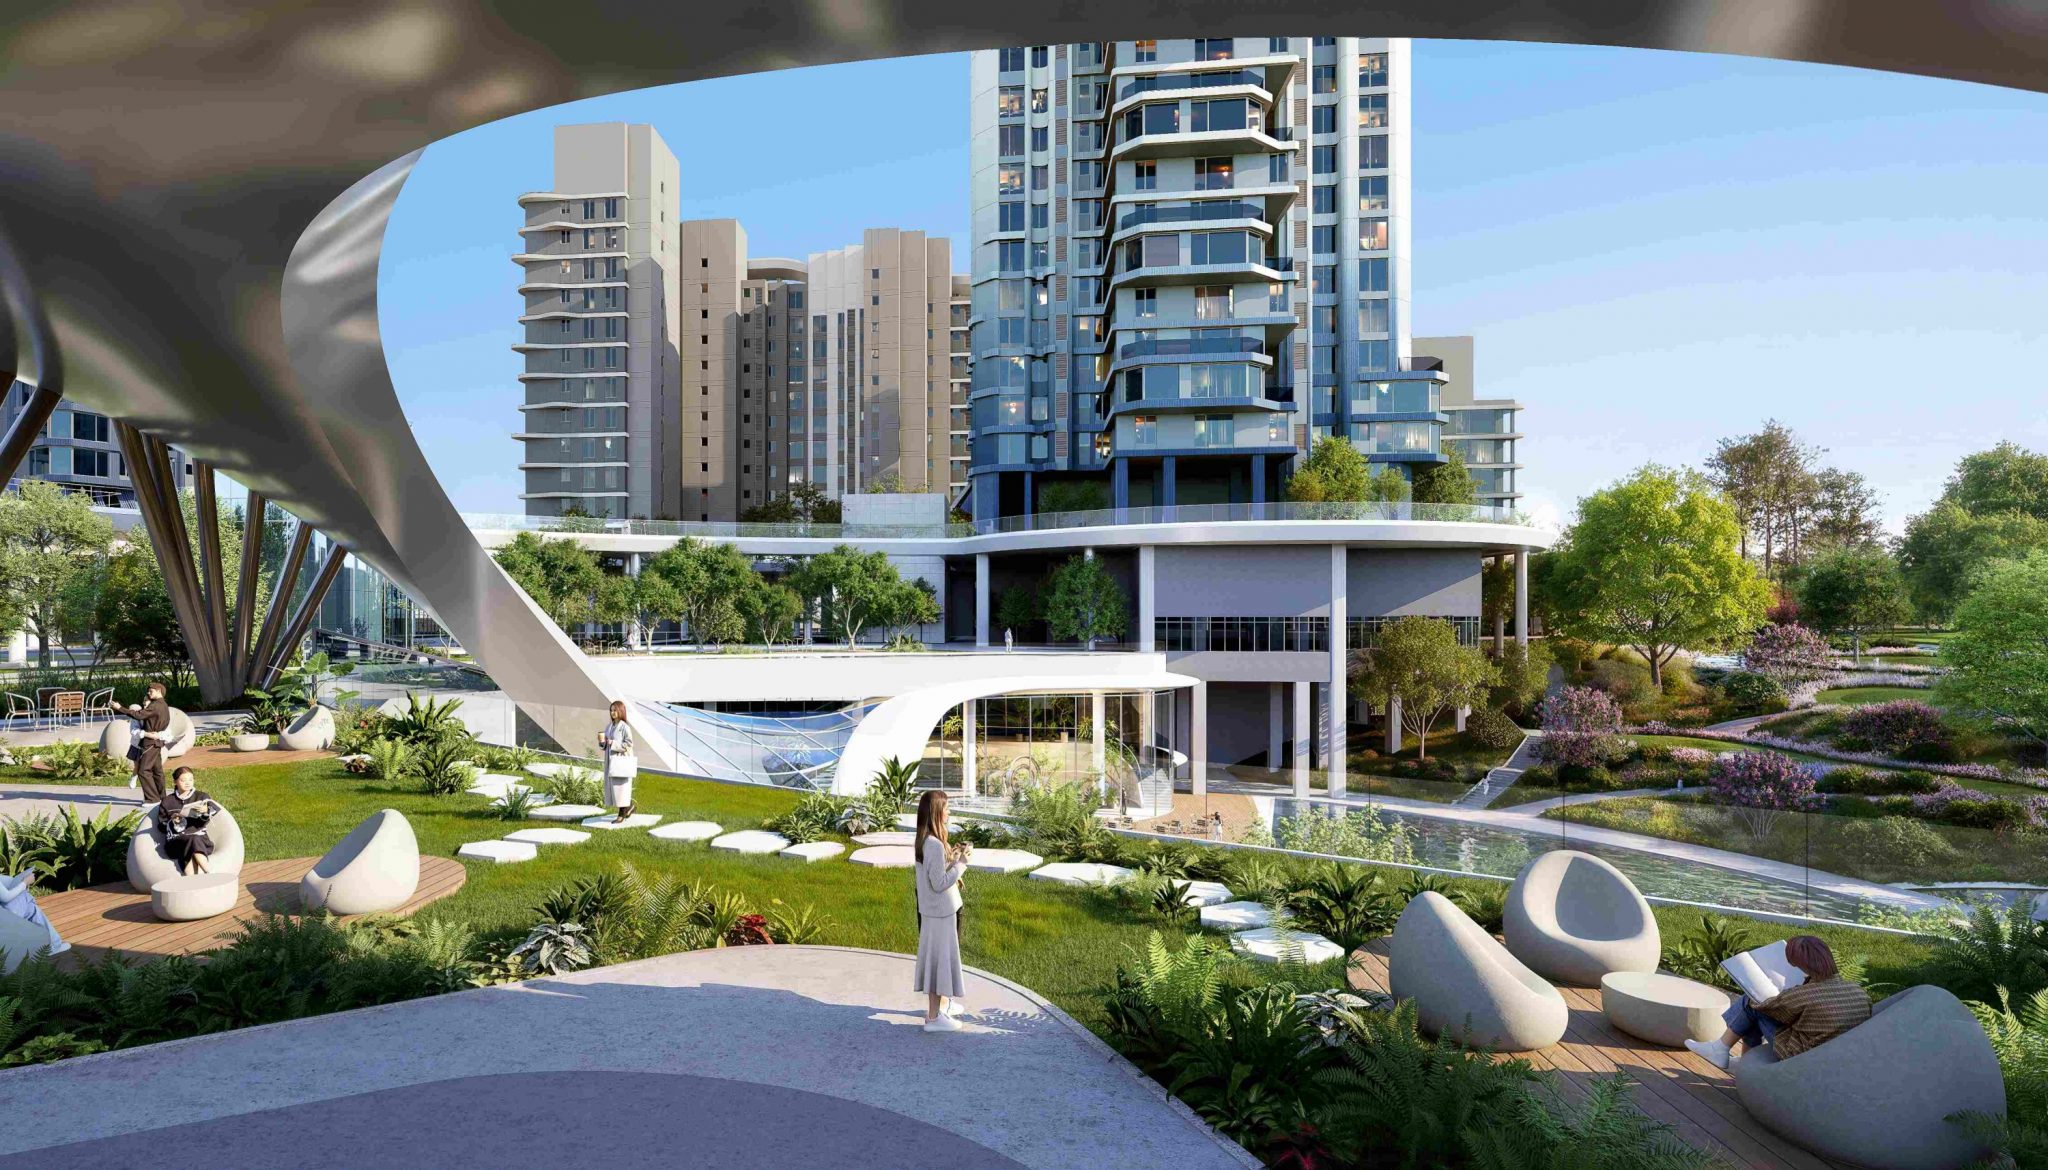
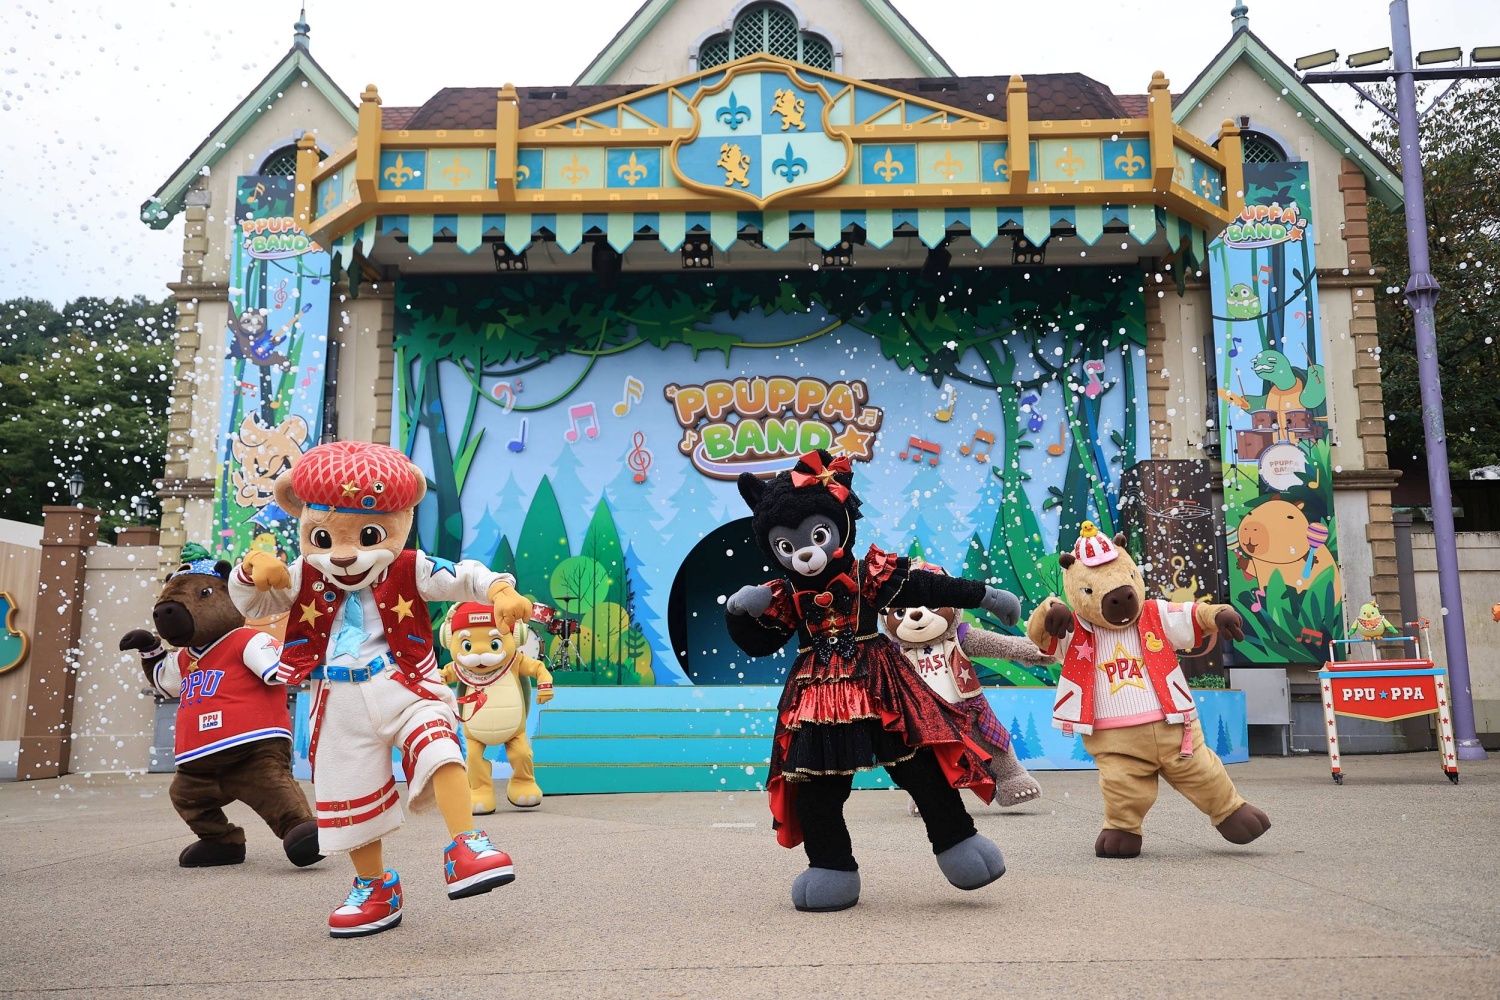
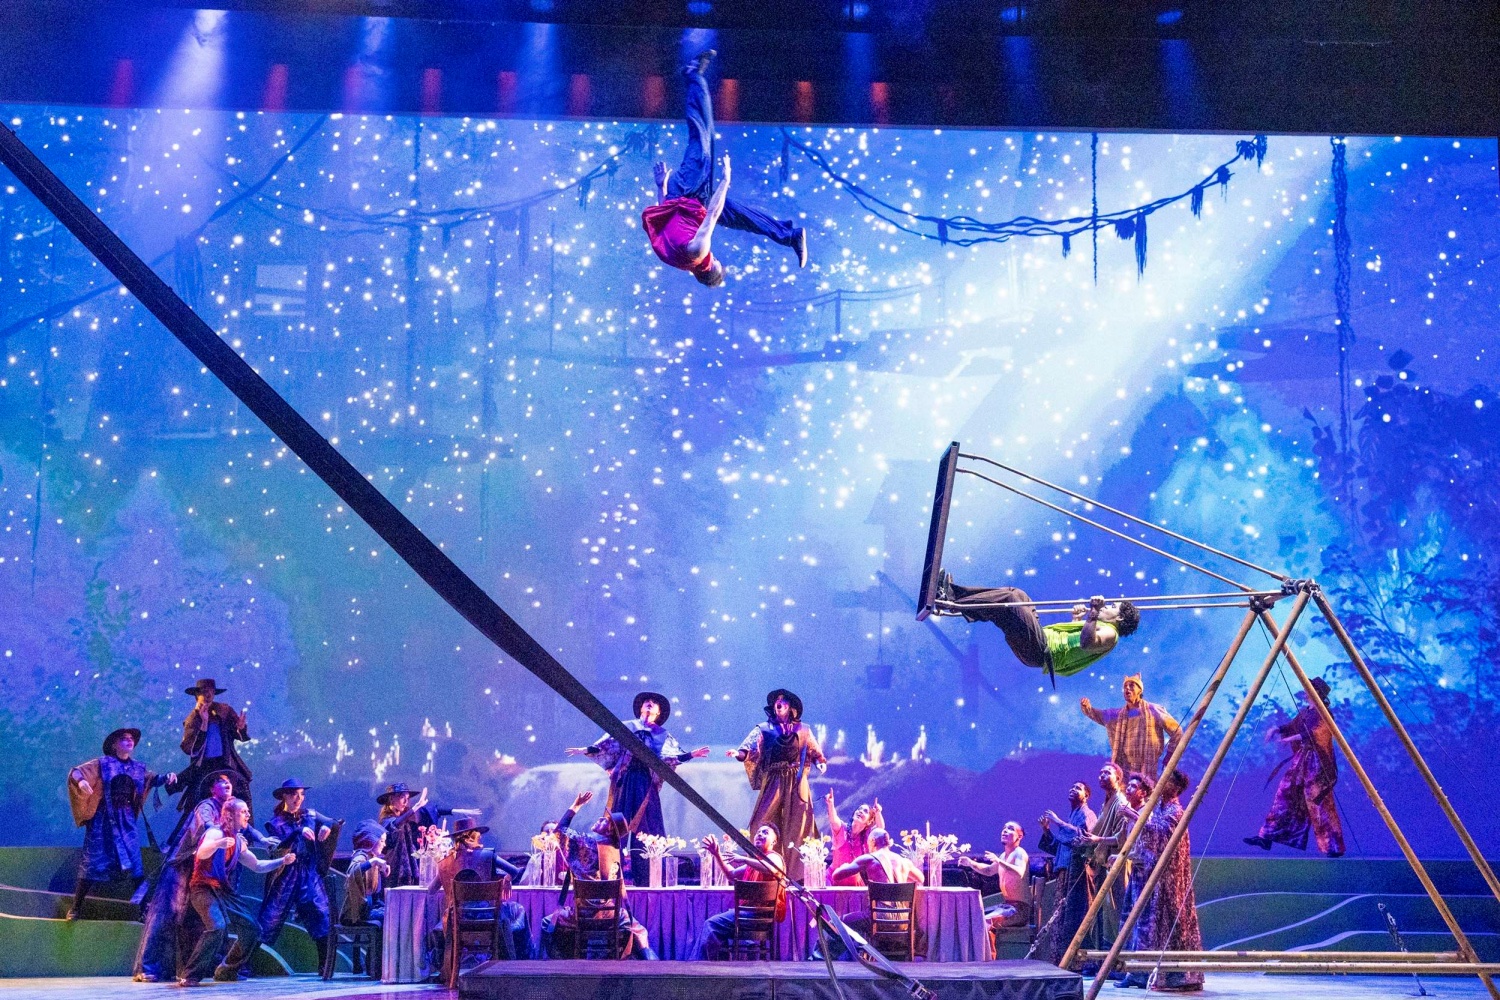
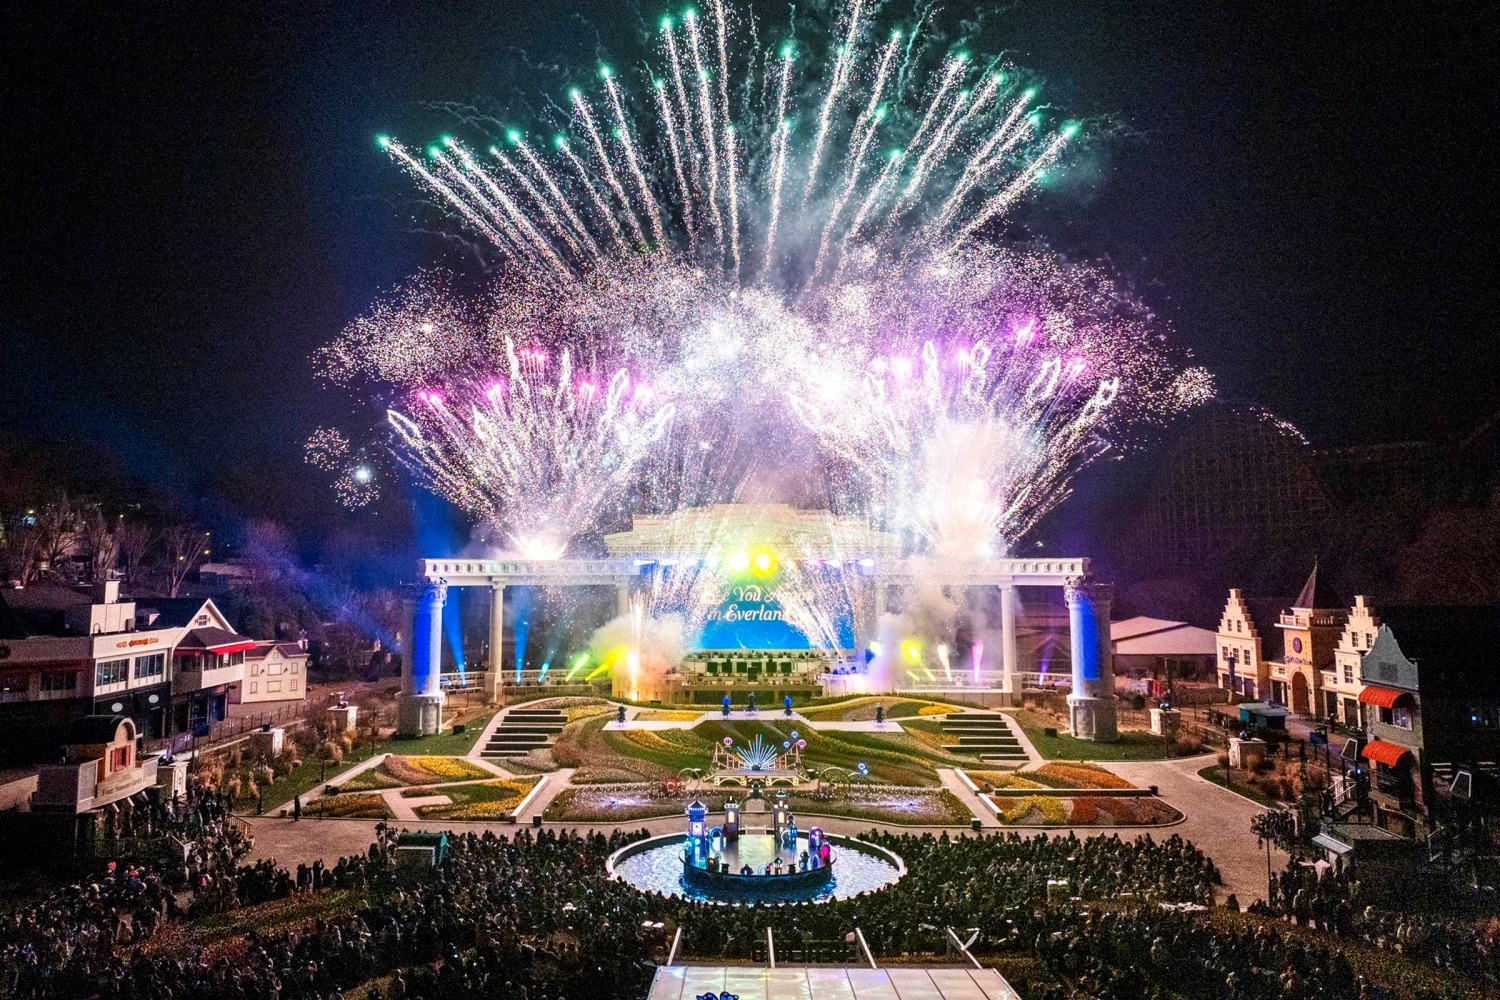
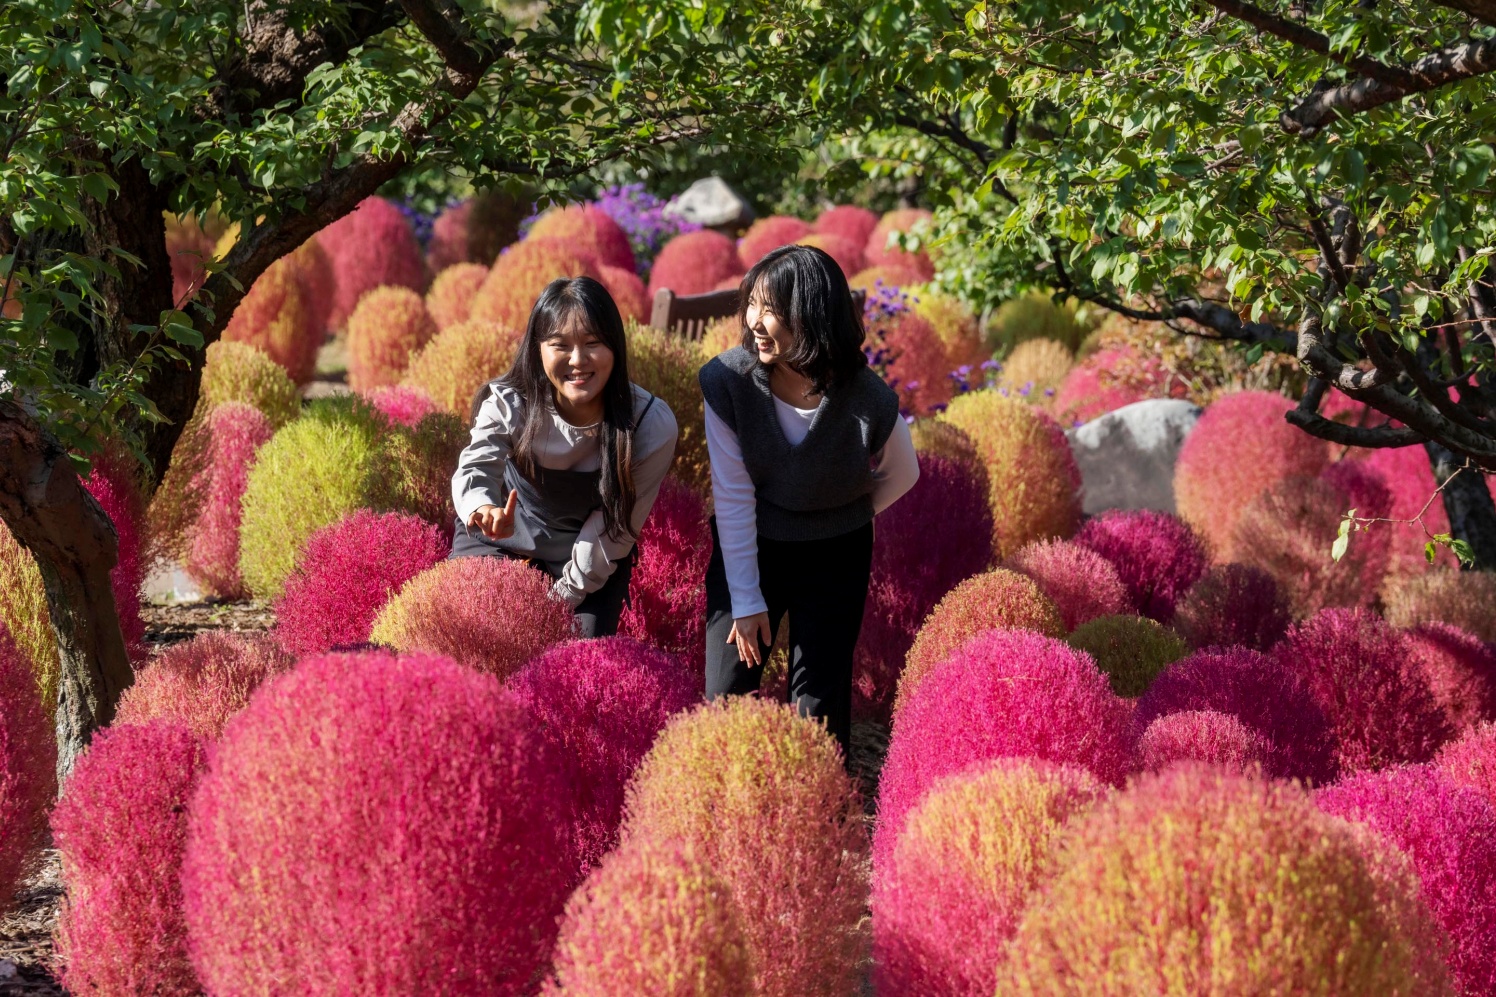
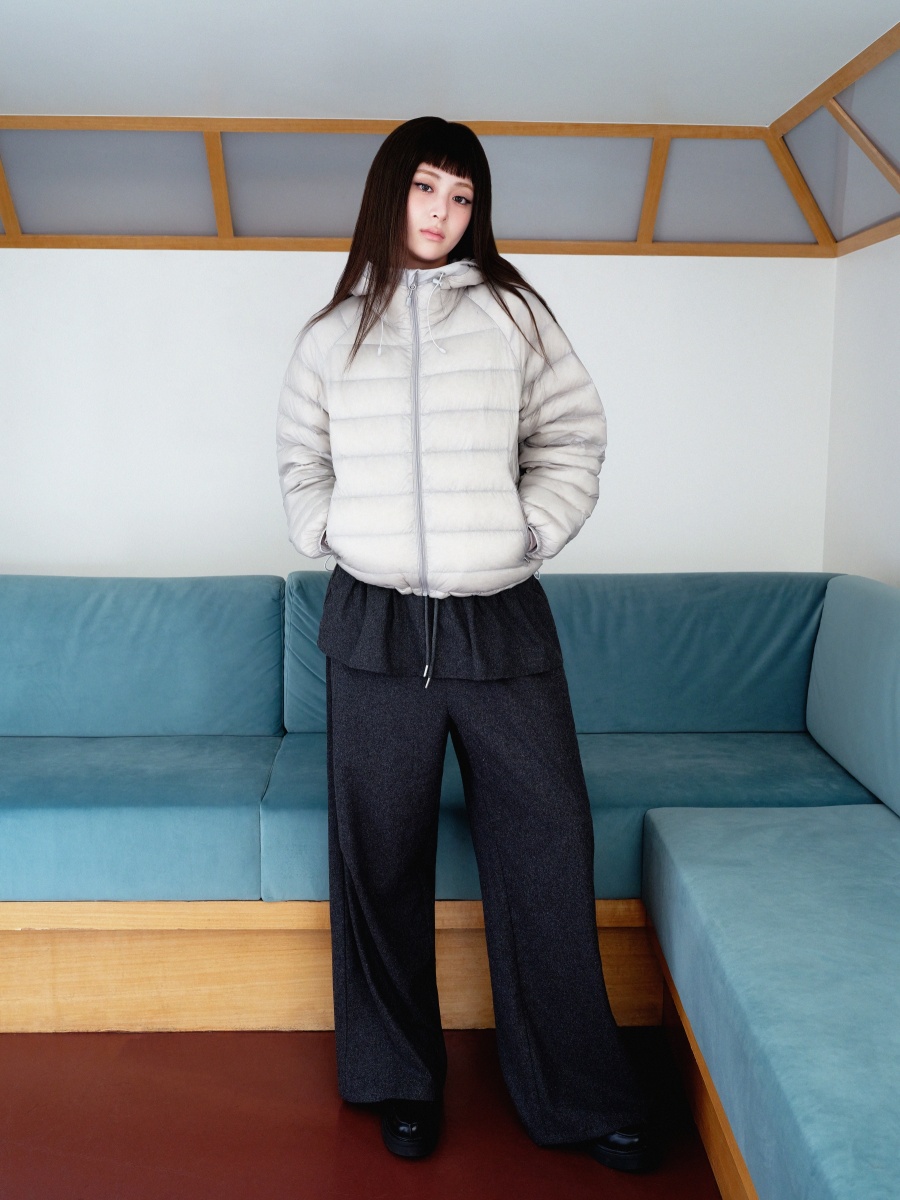
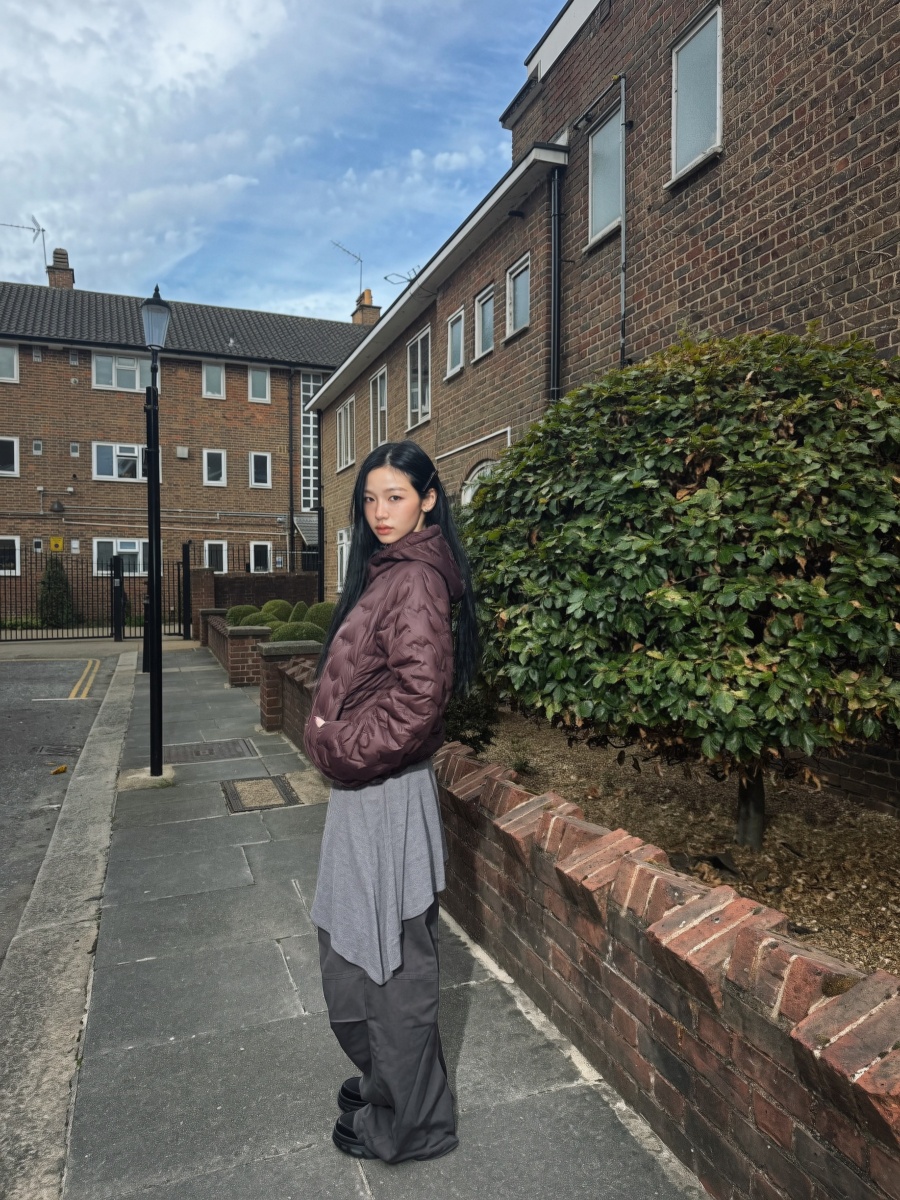
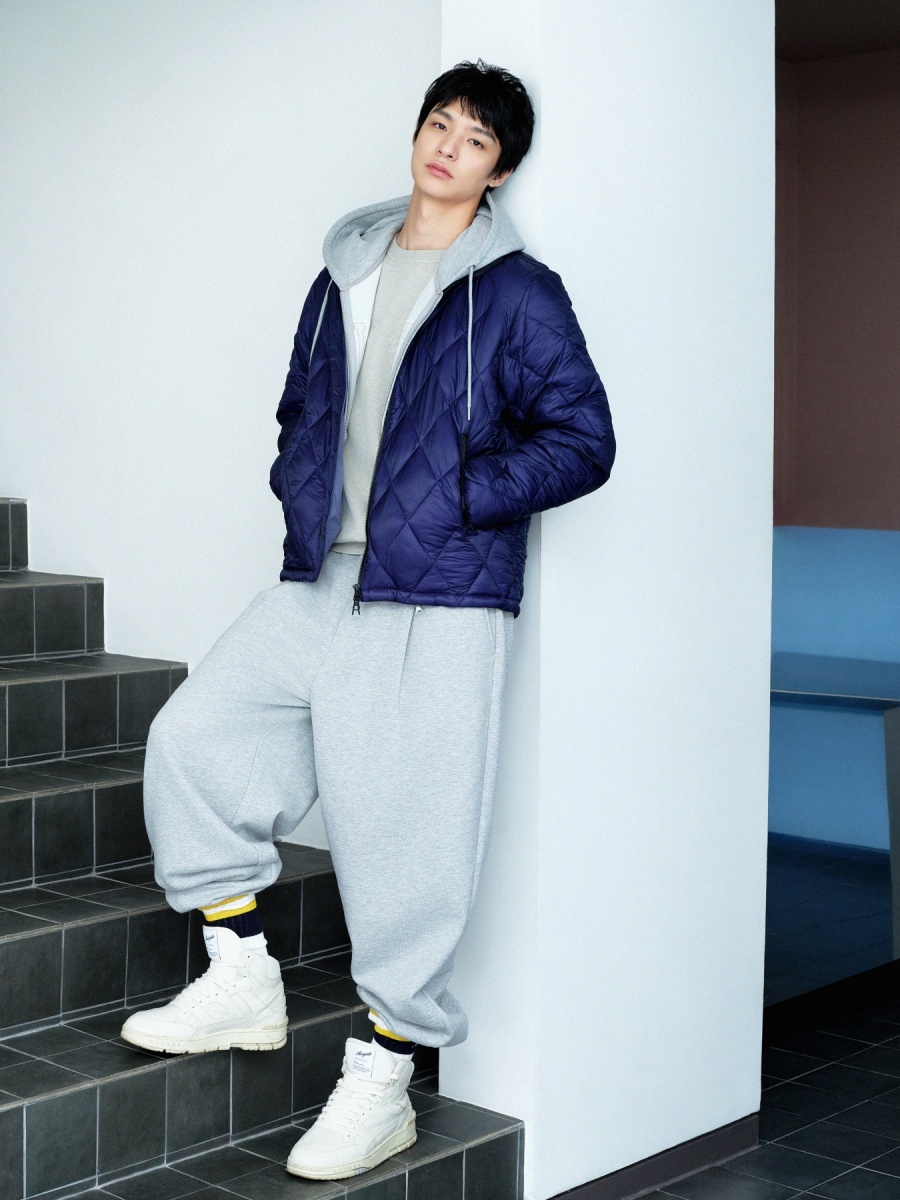
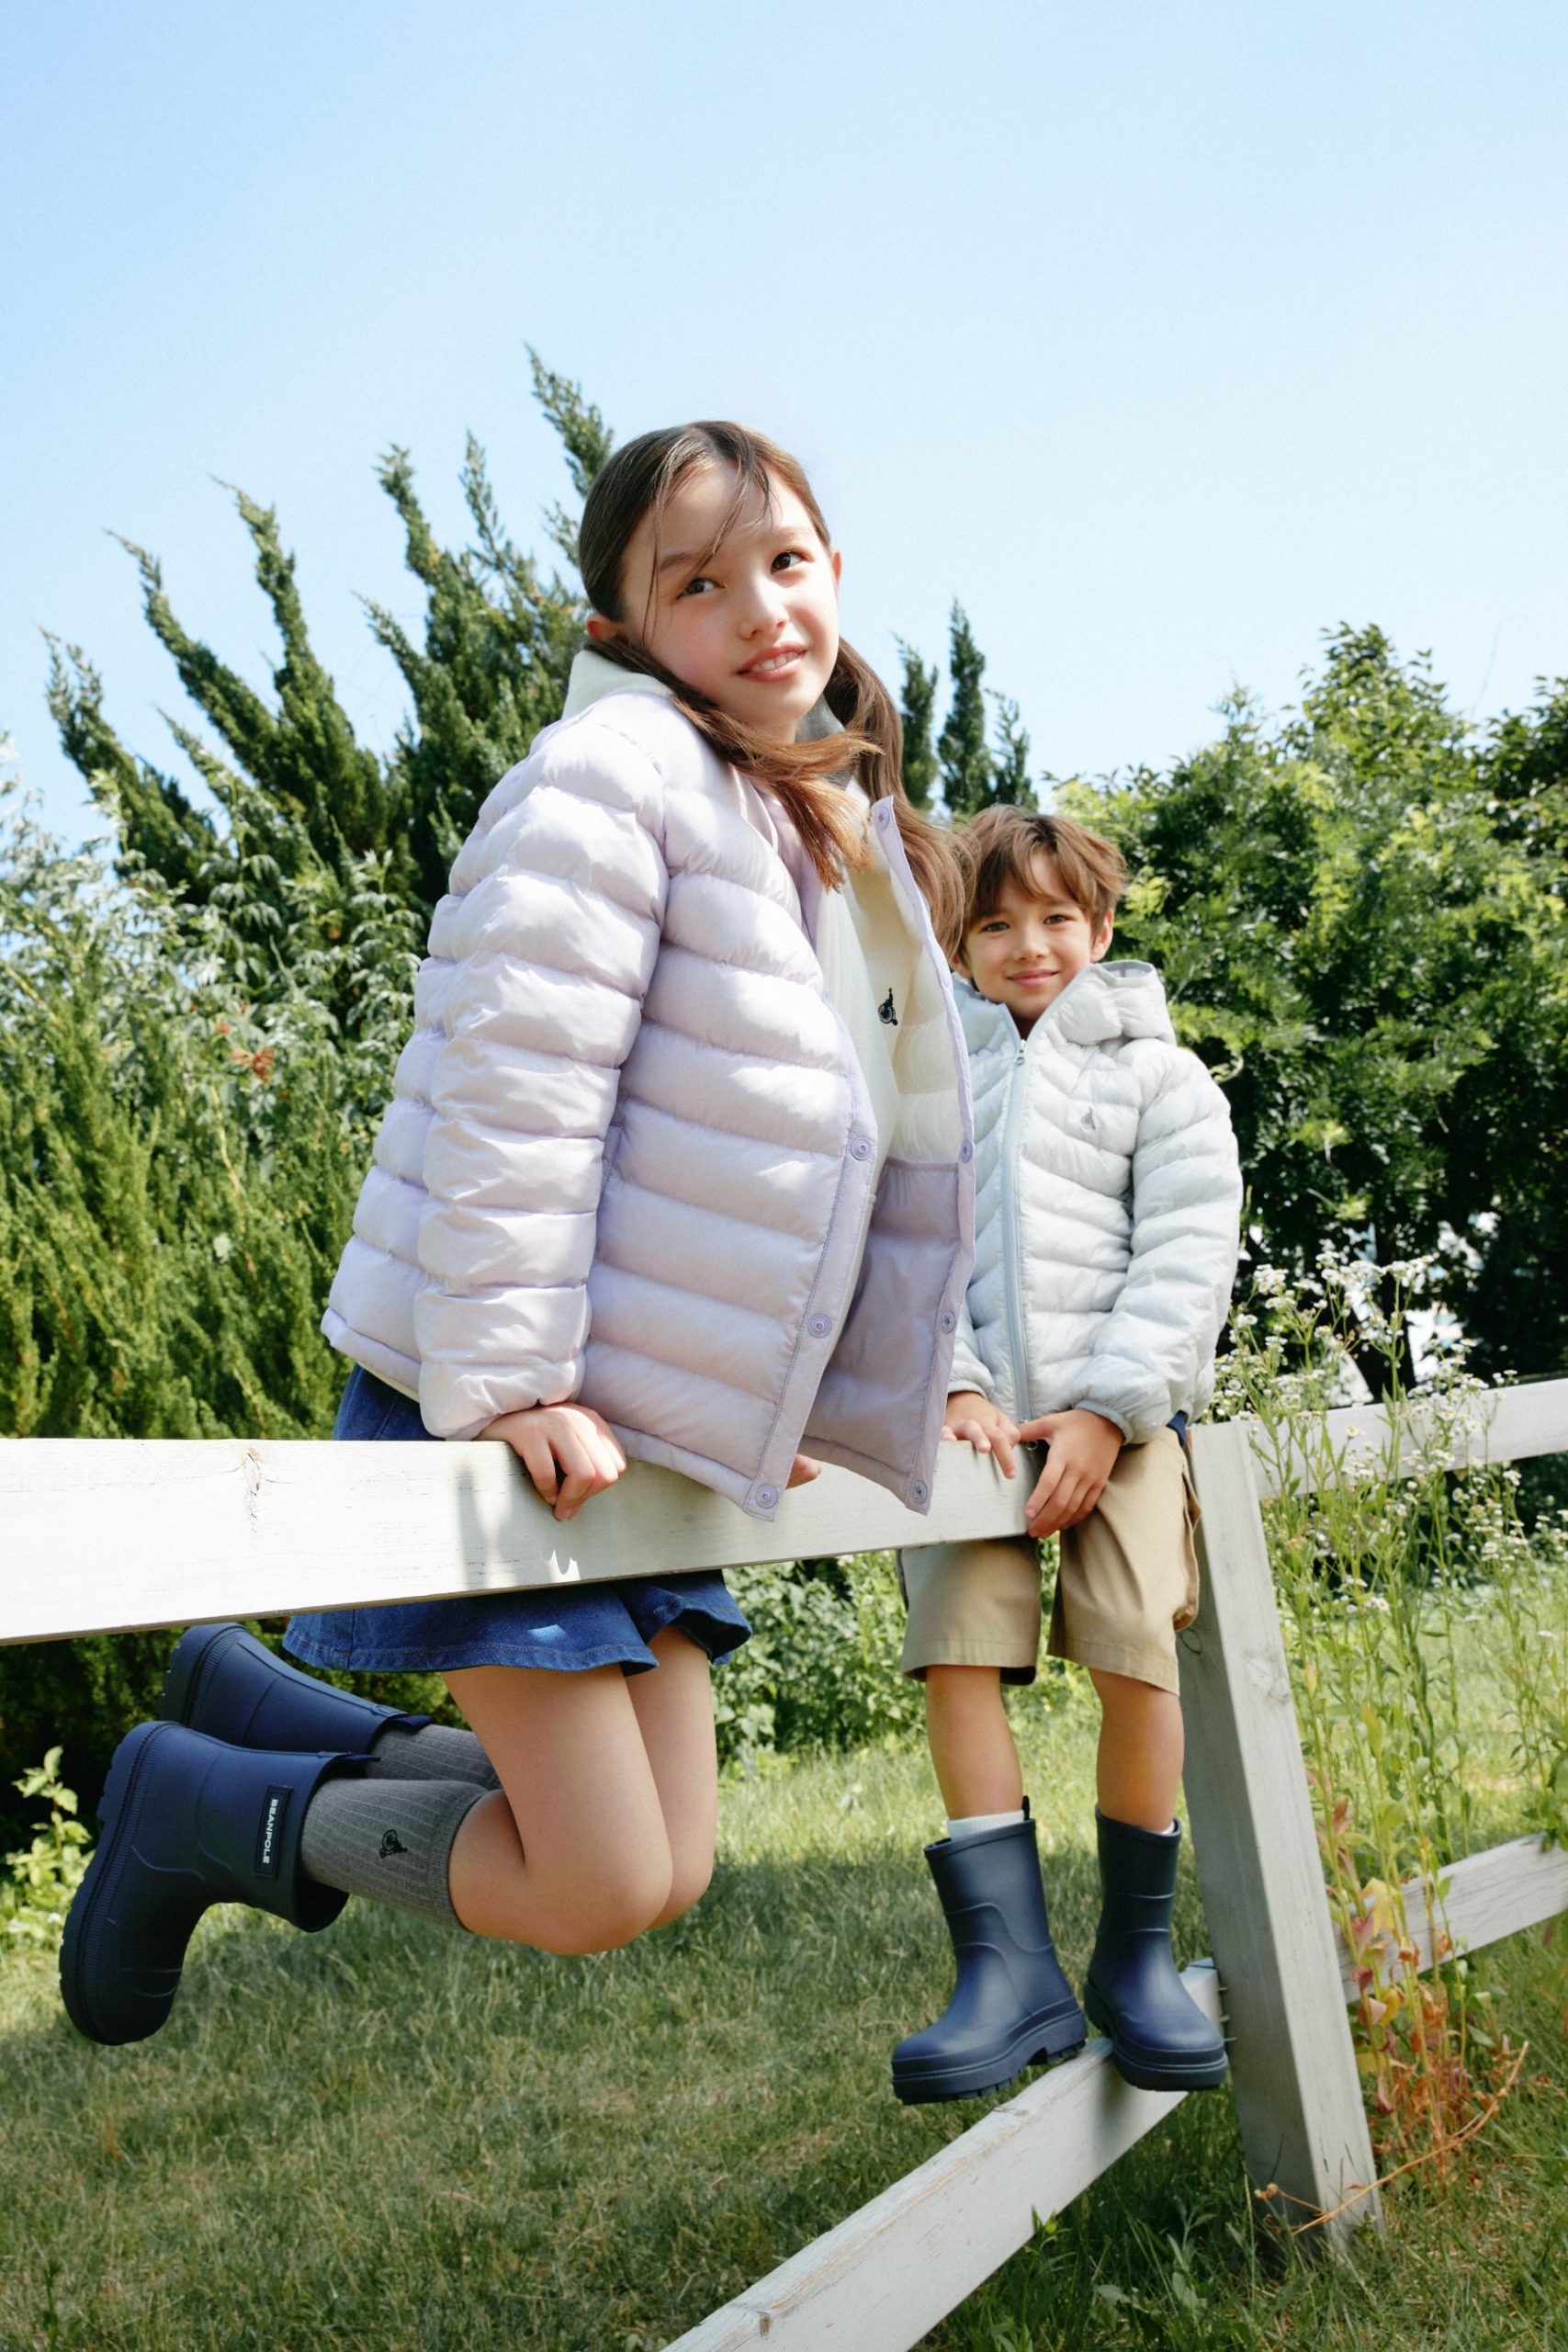
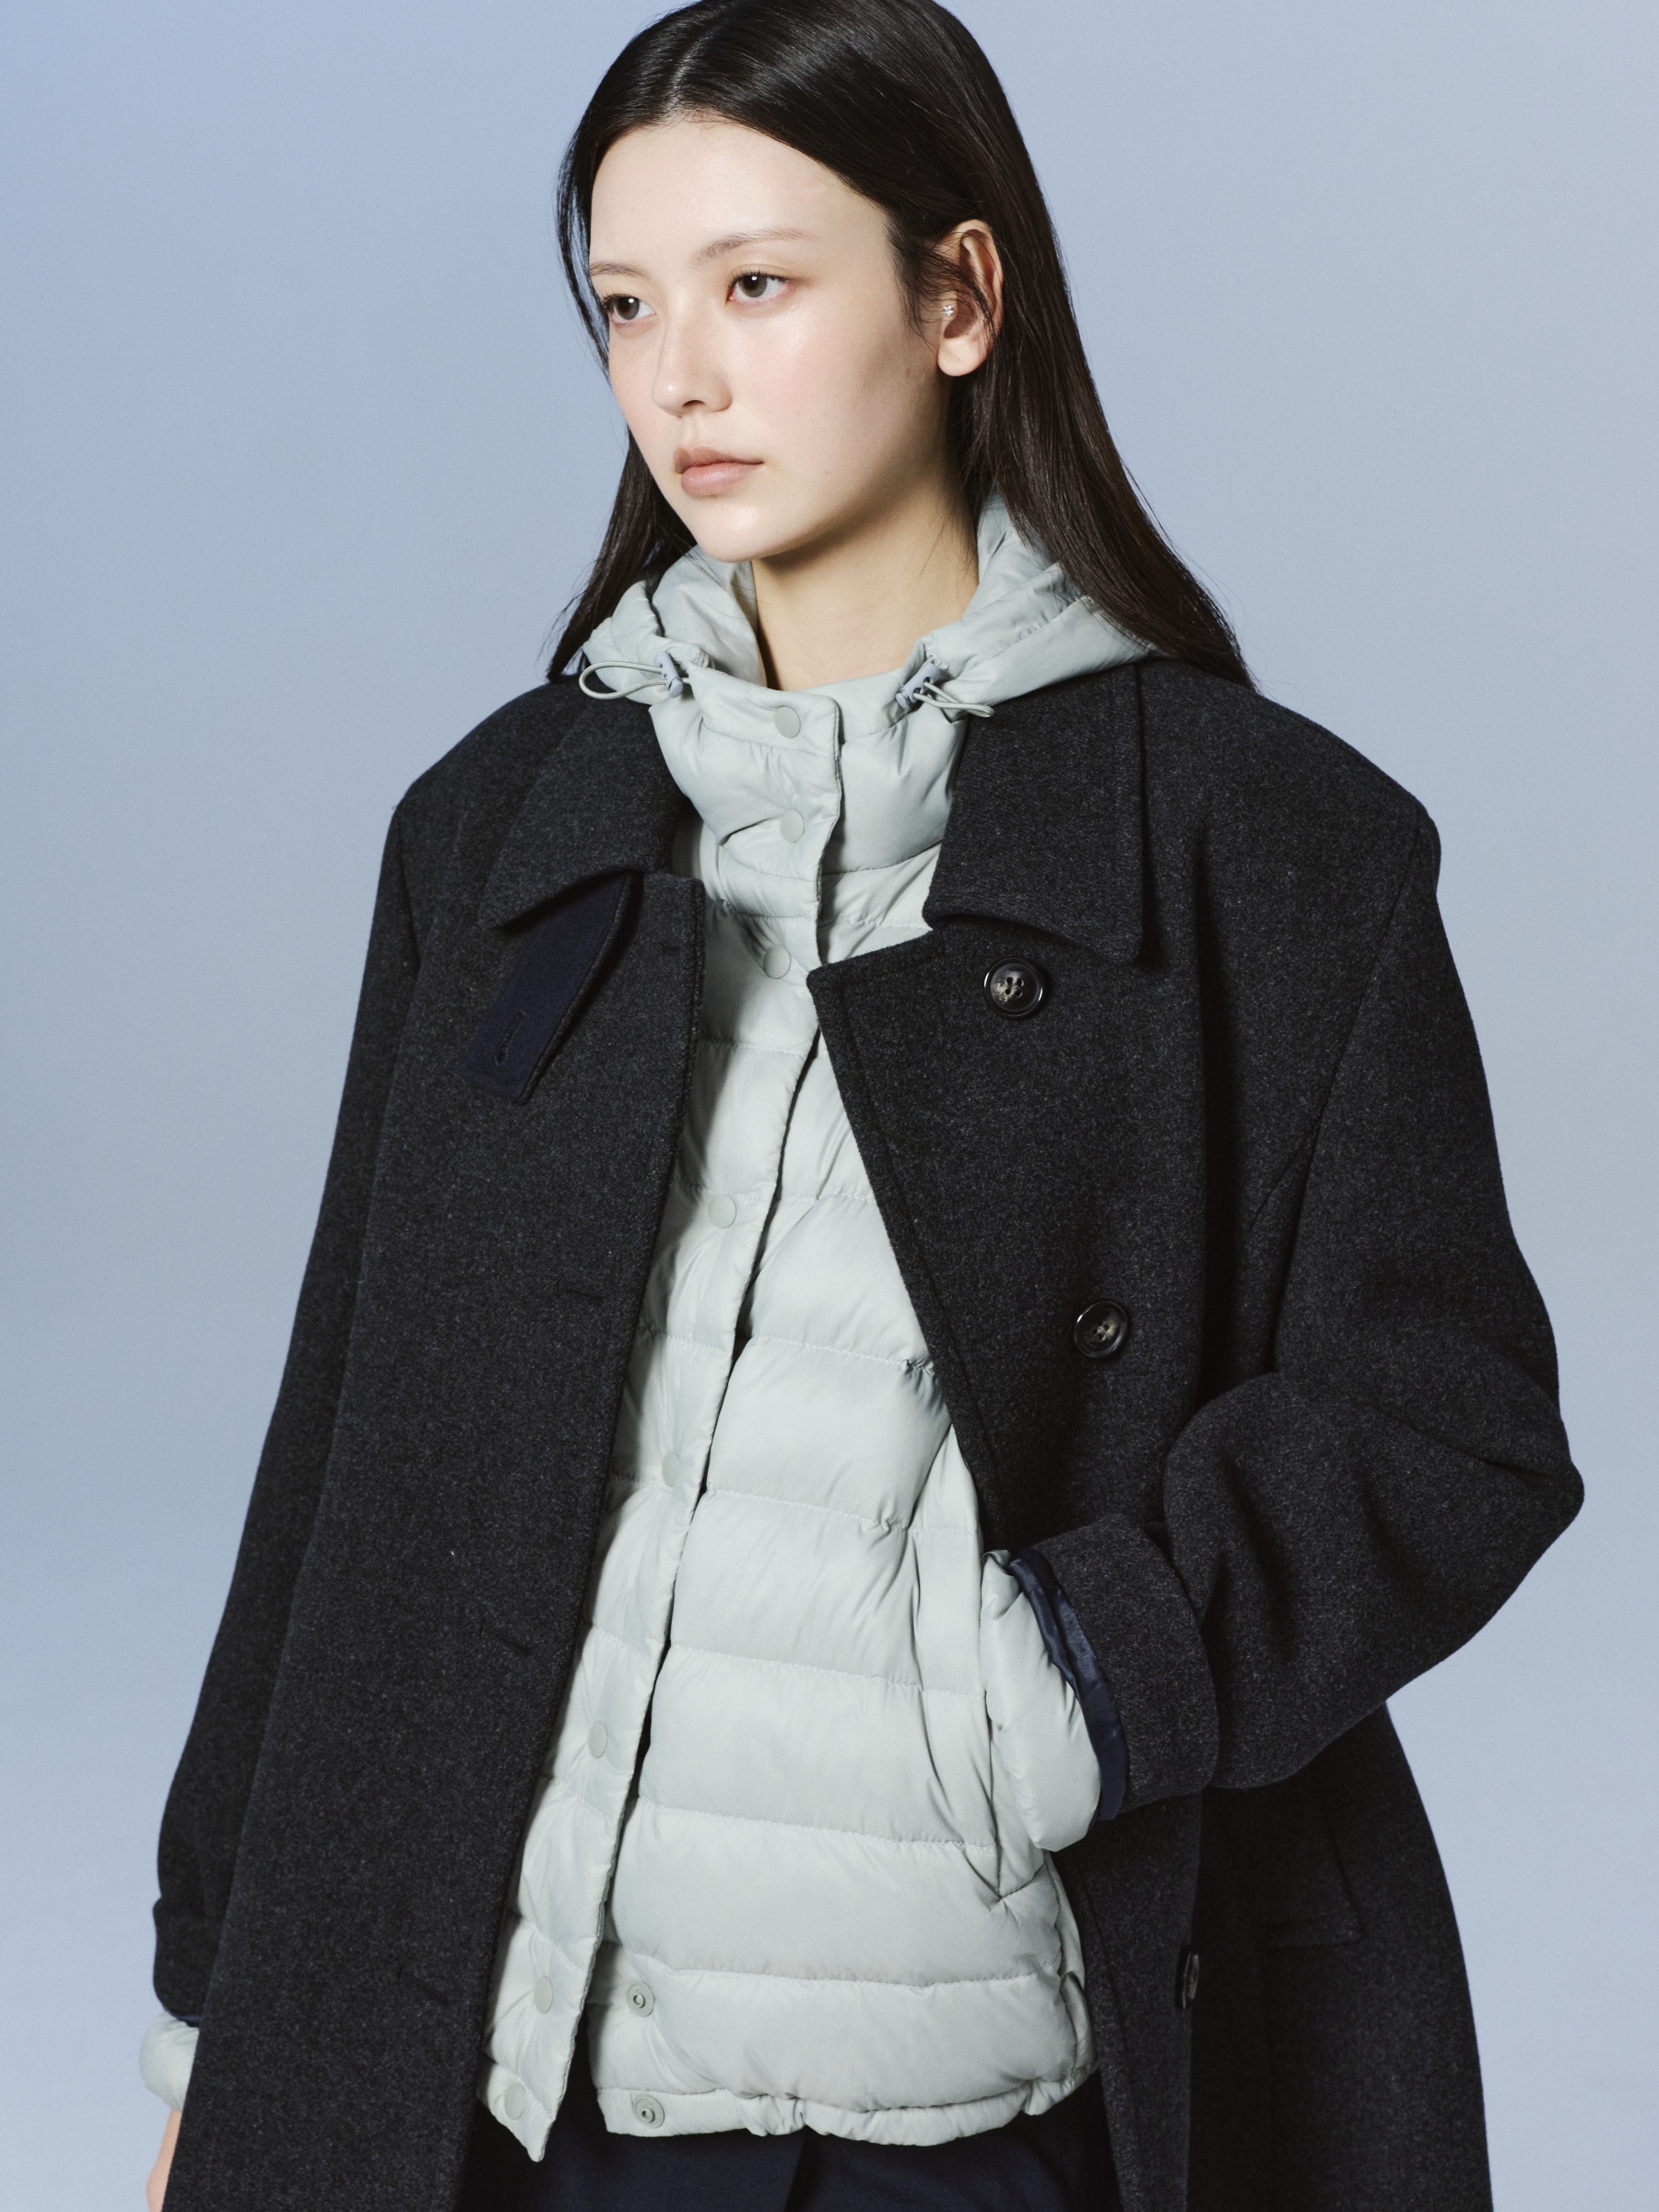
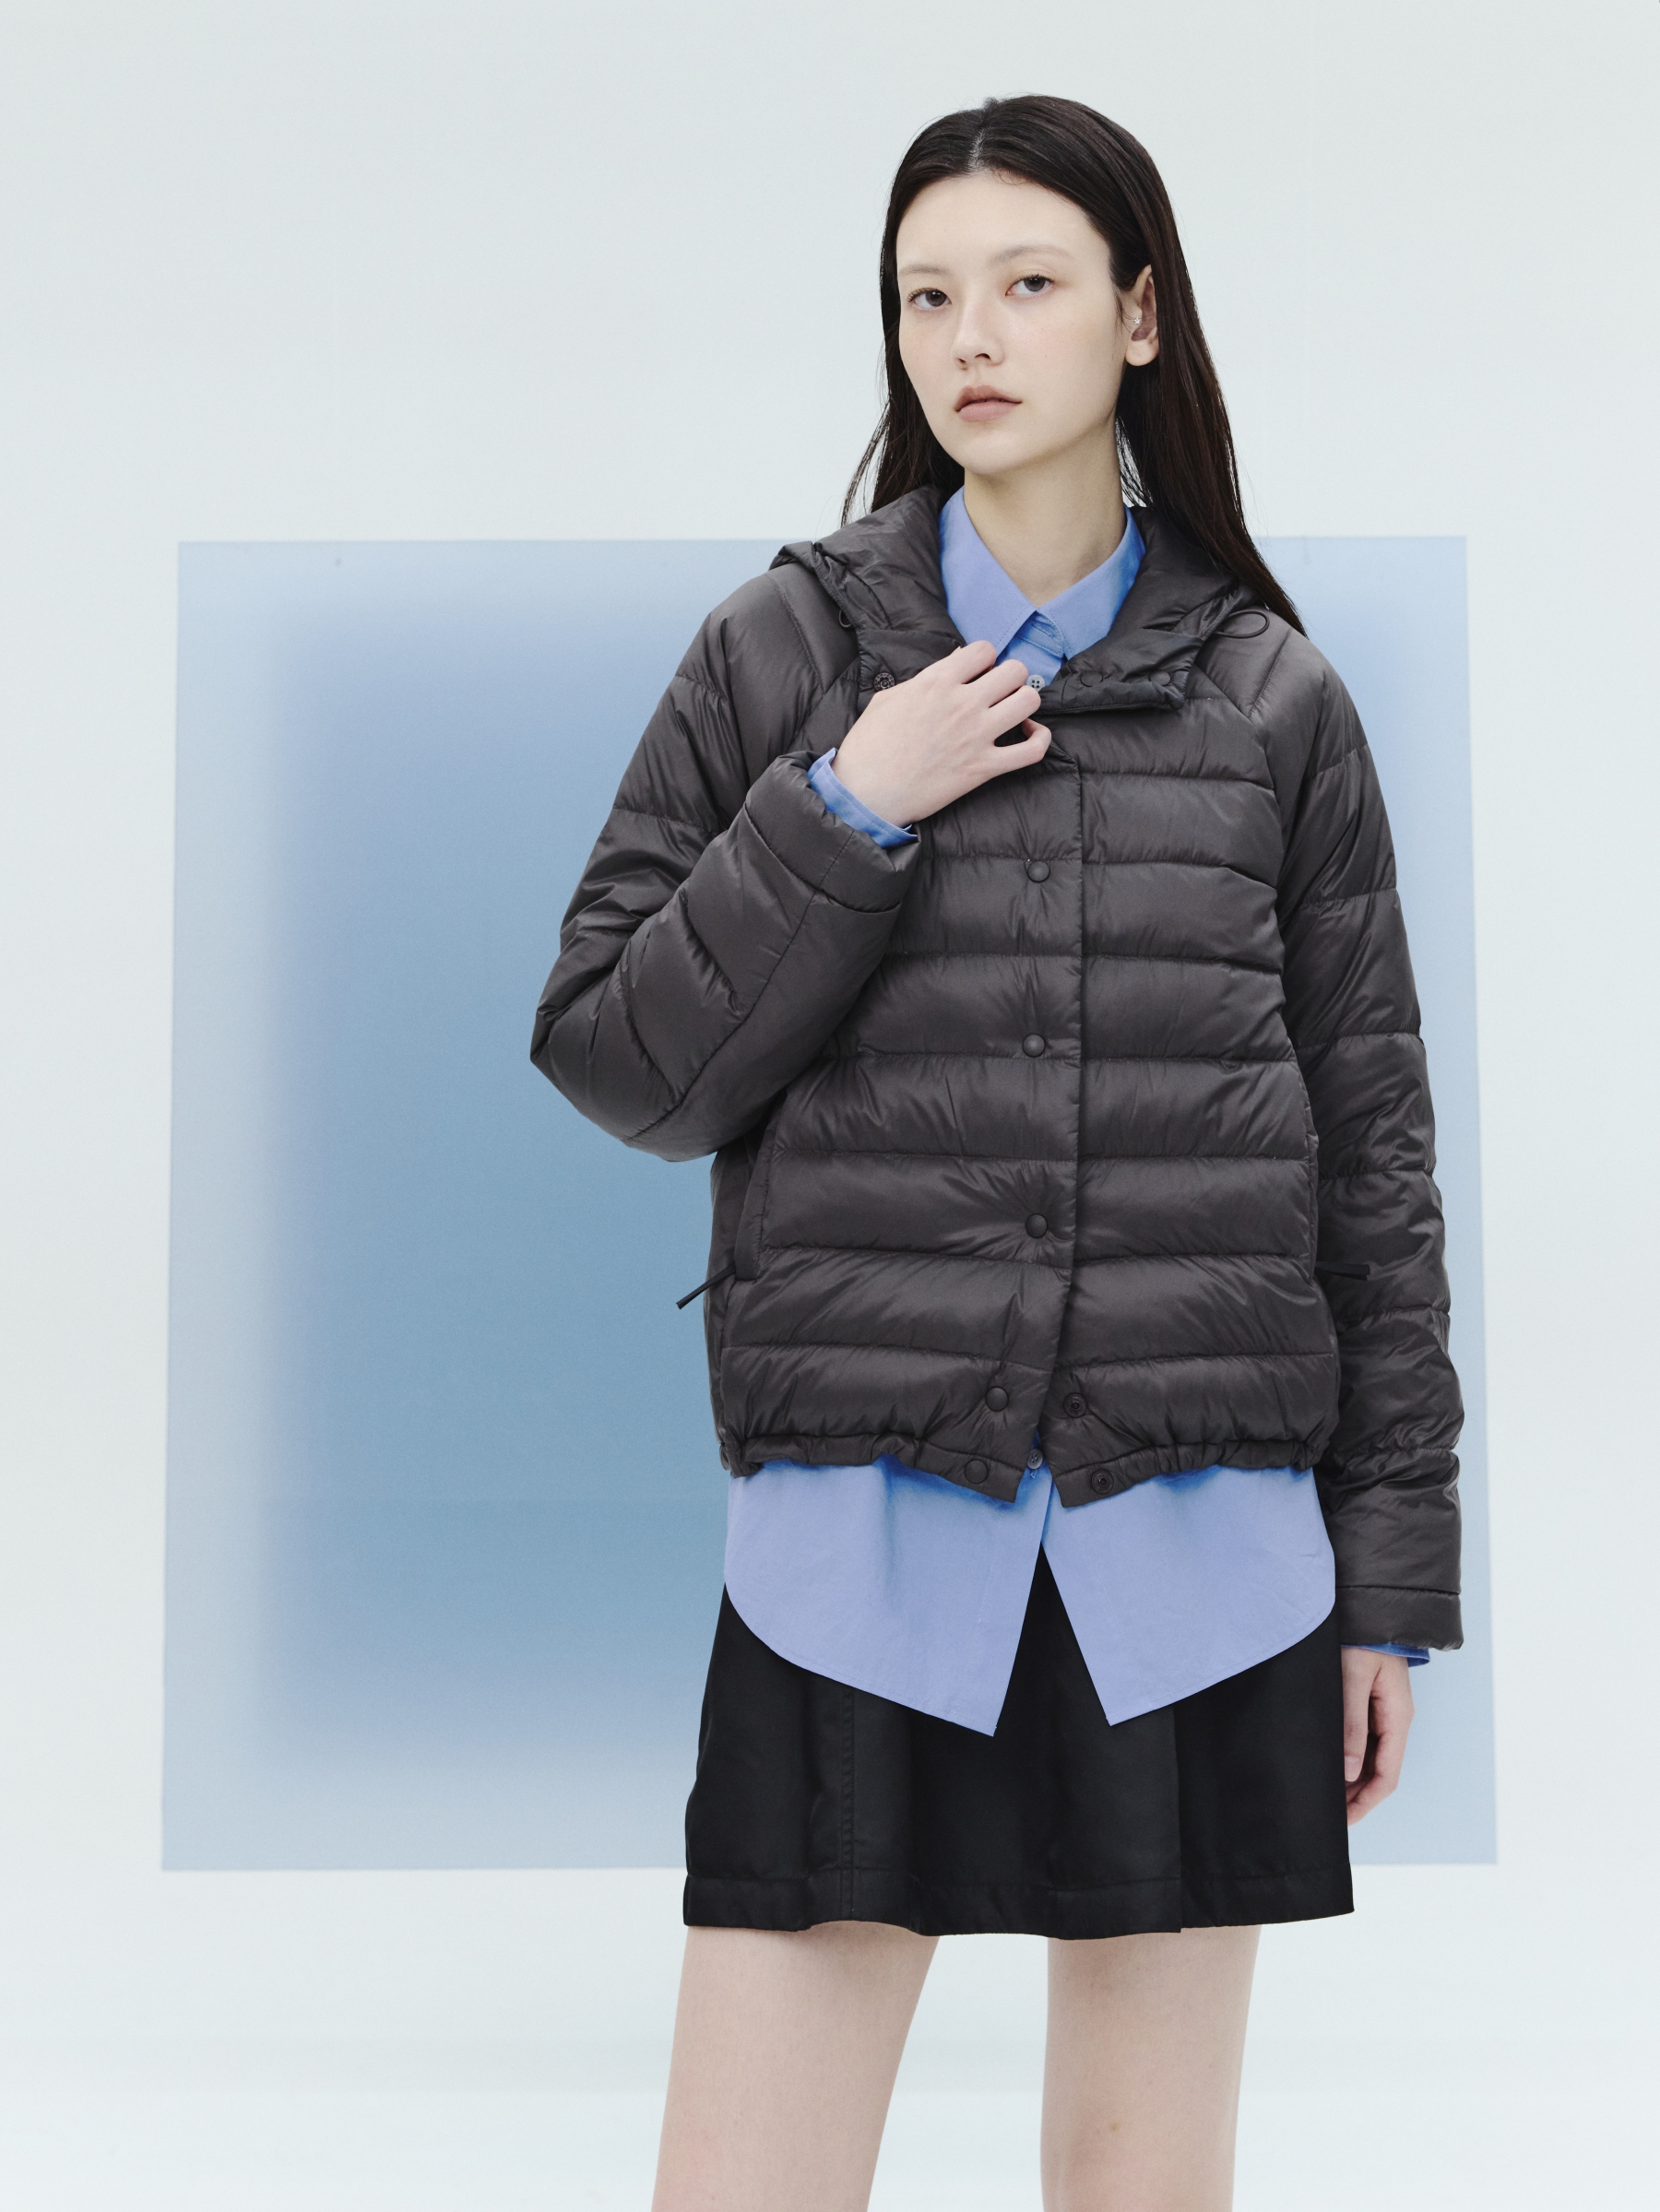
SAMSUNG C&T is a diversified conglomerate operating across construction, trading, fashion, resort, food service, and biopharmaceutical segments. Its construction division executes high-rise buildings, infrastructure, and power plant projects globally, including landmark structures like Burj Khalifa and KL118, under the Raimian residential brand. The trading division handles chemicals, steel, energy, and materials across multiple regions, operating coil centers and stainless steel processing facilities. The fashion segment manages brands such as Galaxy, Bean Pole, Ziozia, and 8 Seconds, alongside the SSF Shop online platform. The resort division operates the Everland theme park, Caribbean Bay water park, and a network of golf courses. The food service division, operated through Samsung Wellstory, provides catering and food distribution in South Korea, China, Vietnam, and Hungary. The biopharmaceutical segment includes Samsung Biologics, which provides contract development and manufacturing of biologics, and Samsung Bioepis, which develops biosimilars for autoimmune, oncology, ophthalmology, and hematology indications. The company maintains partnerships with Global Vision Holdings for small modular reactor technology and holds a stake in Human Genome Sciences. Summarised from the company's own disclosures, fiscal year ended Mar 2026 |
Industry Conglomerates | Homepage samsungcnt.com |
| Sector Industrials | IR page samsungcnt.com/ir/overview.do | |
|
Tags
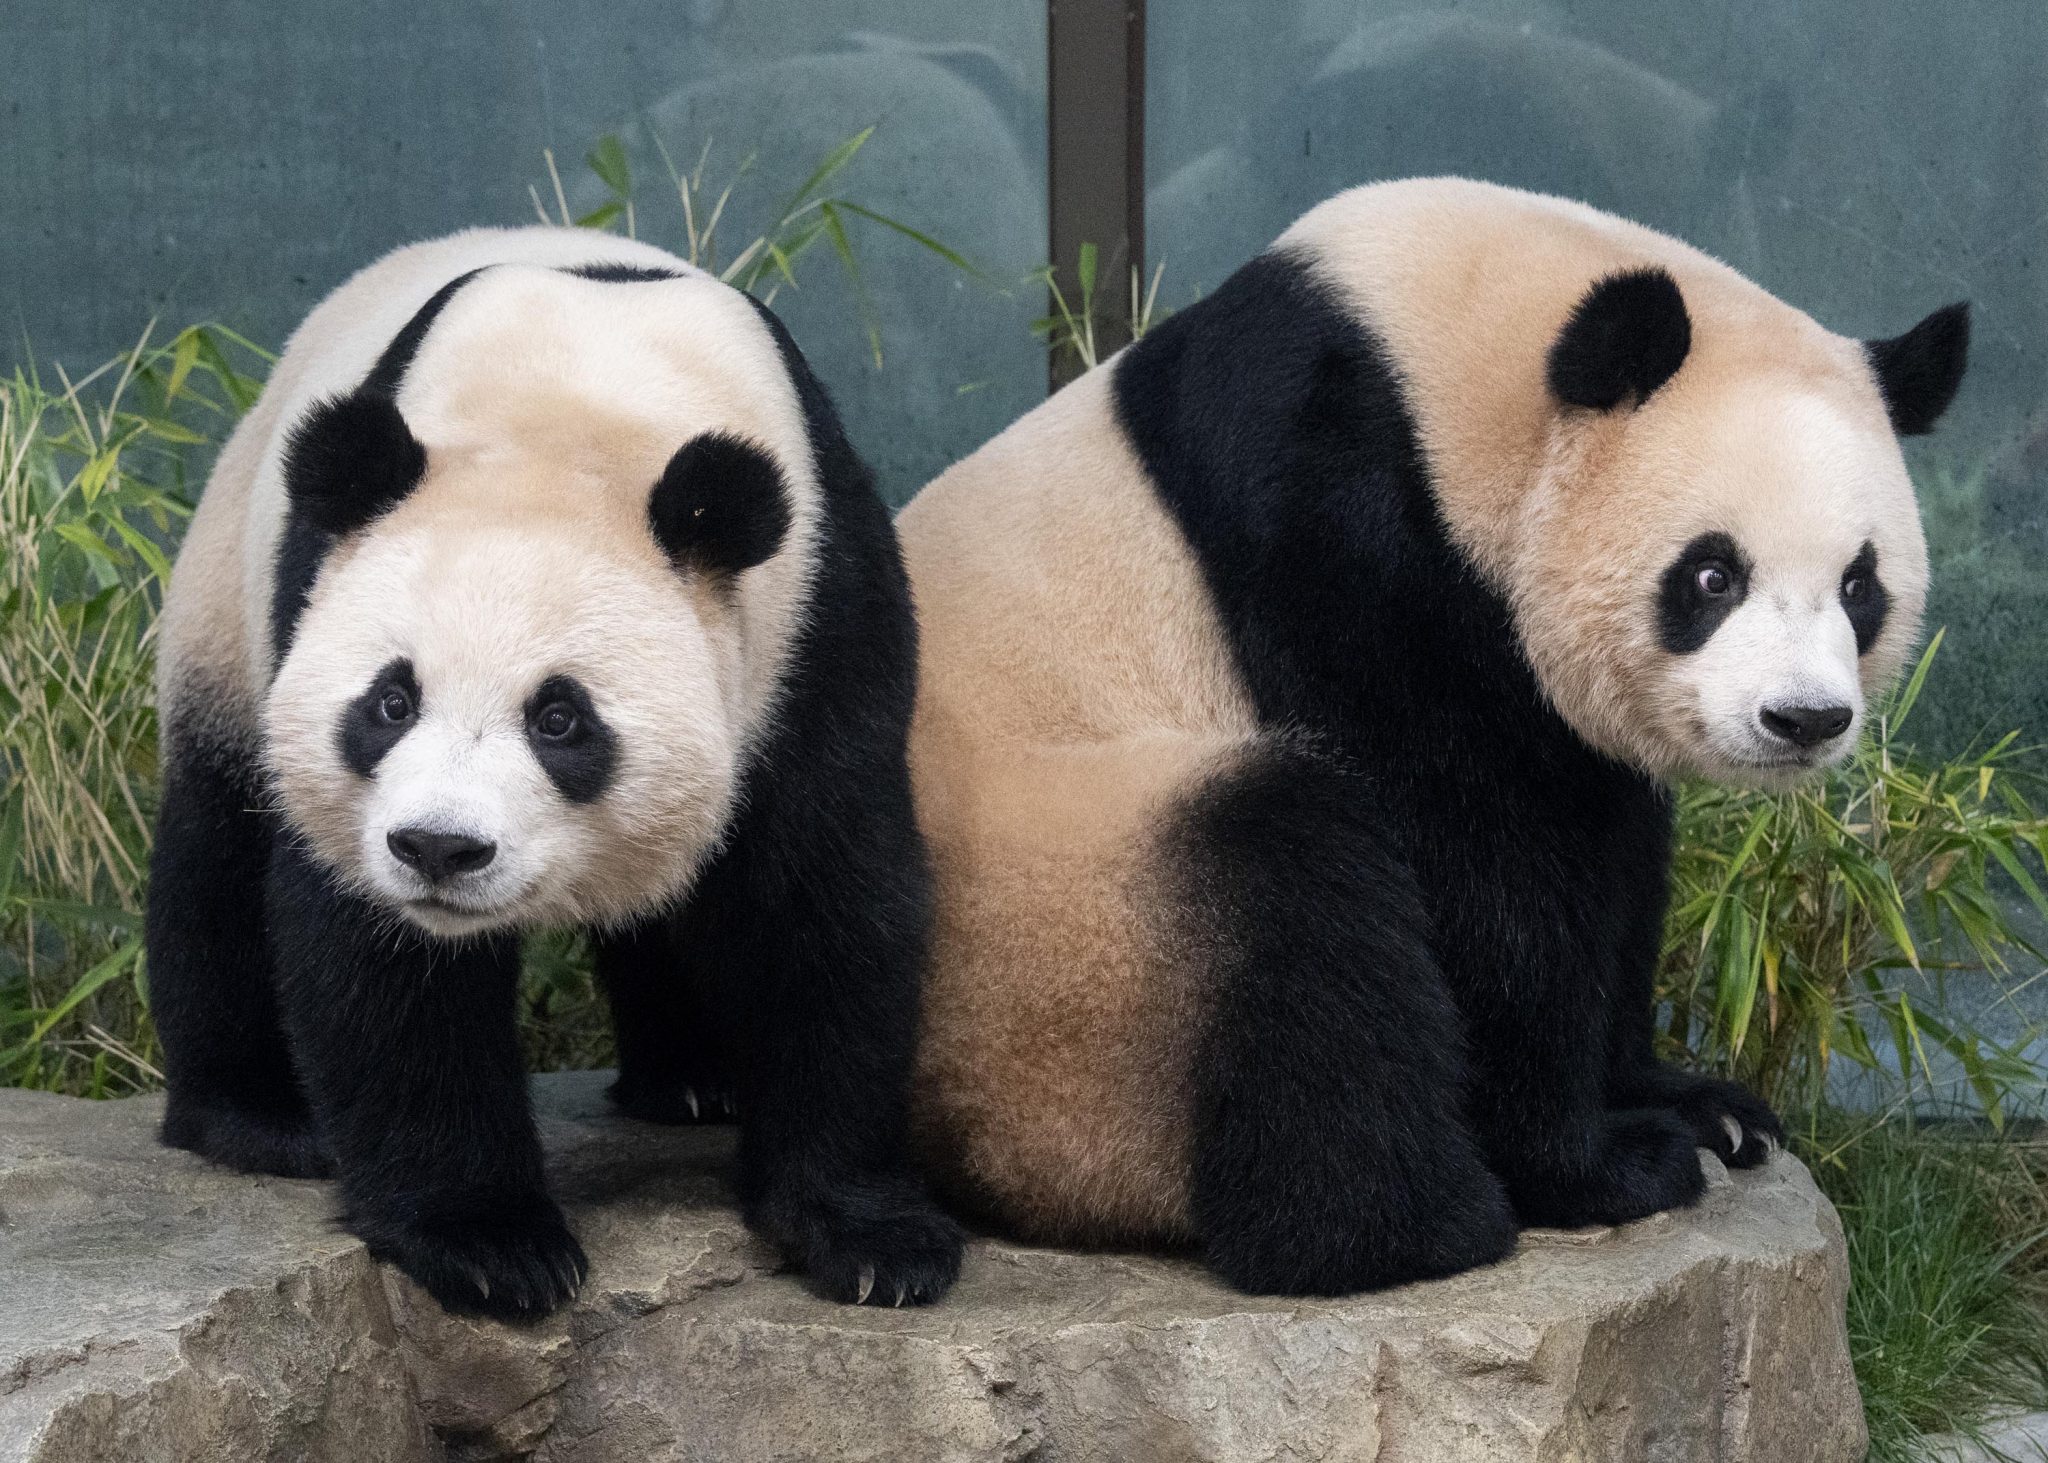
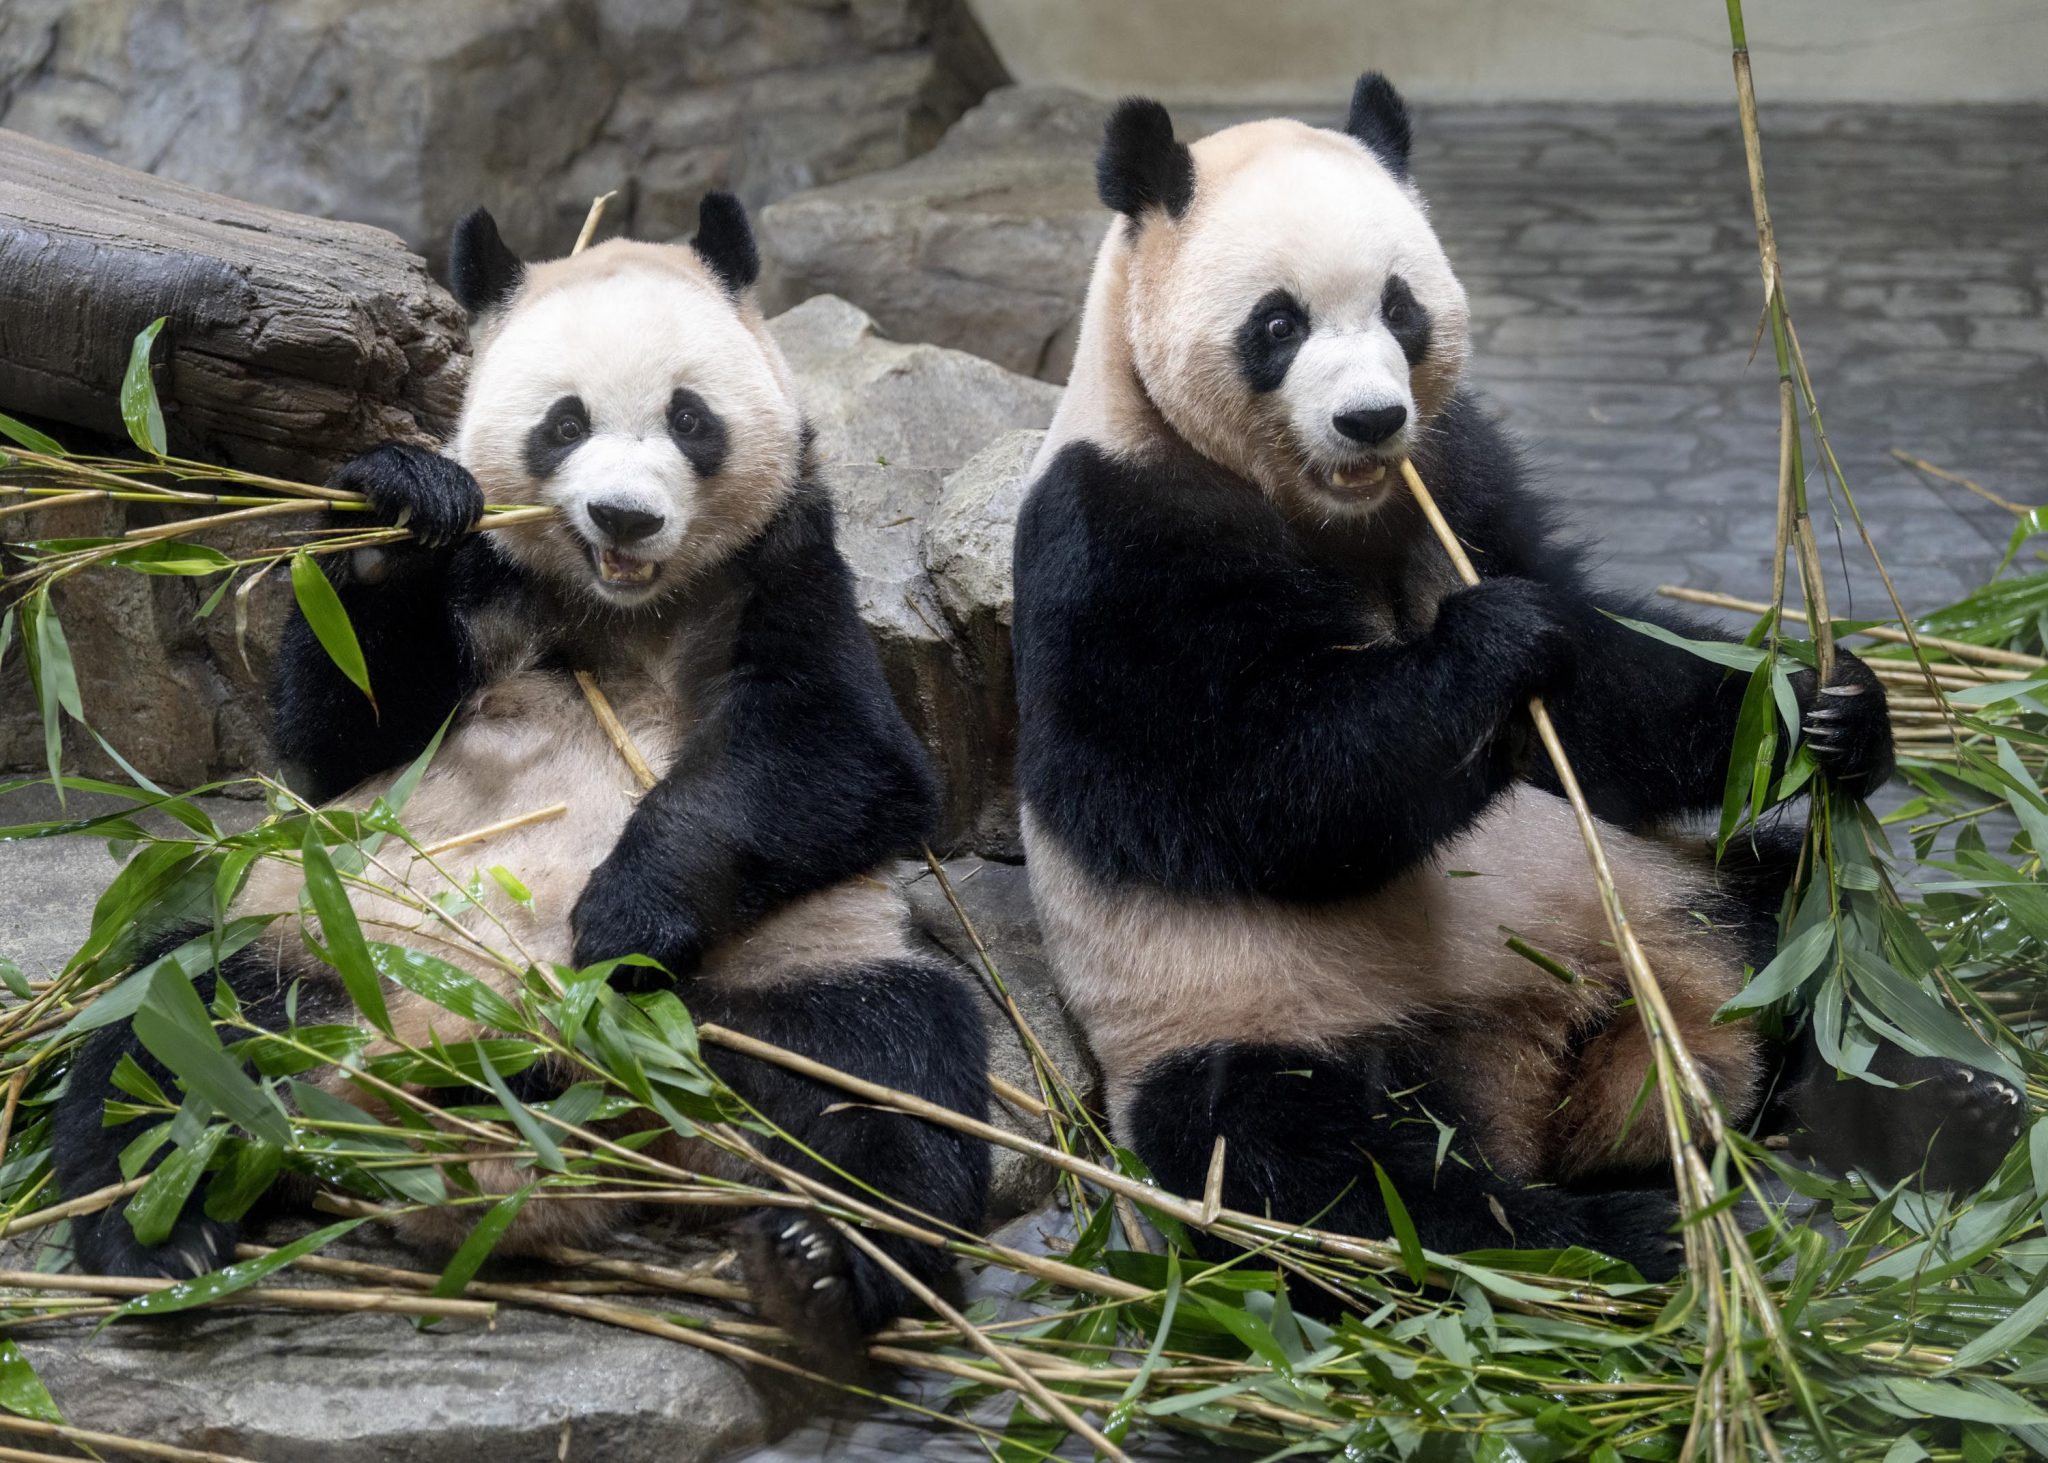
construction, trading, fashion retail, theme parks, golf courses, catering, food distribution, biologics cdmo, biosimilars, steel trading, chemical trading, energy trading, Raimian, Galaxy, Bean Pole, Ziozia, 8 Seconds, KooH, Le Beige, KooH Plus, Sand Sound, The Aperture, Angage, 10 Corso Como, Vicker, SSF Shop, Everland, Caribbean Bay, T-Express, Lost Valley, Mega Storm, Panda World, Anyang Country Club, Gapyeong Country Club, Anseong Country Club, Dongrae Benest, Glen Rose, Lakeside, Samsung Wellstory, Samsung Biologics, Samsung Bioepis, Samsung C&T Deutschland GmbH, S.C. Otelinox S.A., Samsung C&T Japan Corporation, Samsung C&T Singapore Pte.Ltd., Samsung C&T Malaysia Sdn. Bhd., Samsung C&T Thailand Co. Ltd., MSSC Sdn. Bhd, Samsung Chemtech VINA LLC, VSSC Steel Center Limited Liability, Samsung Trading (Shanghai) Co. Ltd, Samsung Precision Stainless Steel(Pinghu) Co. Ltd., Samsung C&T Corporation Saudi Arabia, Samsung C&T Hongkong Limited, Vista Contracting and Investment Global Pte. Ltd., Samsung Biologics America Inc., Human Genome Sciences
|
Press page — |
Metrics
| Valuation | |
|---|---|
| Market cap | ₩ 70.118T |
| Market cap (USD) | $ 51.605B |
| P/E | 25.10 |
| PEG | 4.14 |
| P/BV | 0.66 |
| P/S | 1.61 |
| P/OCF | 13.98 |
| P/FCF | 18.27 |
| Dividend yield | — |
| Turnover / mcap | — |
| Returns | |
|---|---|
| ROE | 6.0% |
| ROI | 4.9% |
| ROIC | 6.0% |
| Profit margin | 6.0% |
| Growth | |
|---|---|
| Revenue growing | No |
| Profits growing | Yes |
| Revenue up 3y | No |
| Revenue up 5y | No |
| Earnings growth 3y (net profit CAGR) | 6.1% |
| Quality | |
|---|---|
| Profitable | Yes |
| Margin expanding | Yes |
| Buying back stock | Yes |
| Diluting (TTM) | No |
| Debt/Equity | — |
| Podcast bulls (TTM) | Sign up |
| Podcast bears (TTM) | Sign up |
| Podcast sentiment (TTM) | Sign up |
| Podcast sentiment % (TTM) | Sign up |
| News sentiment (TTM) | — |
| Quality score | 0% |
| Insiders | |
|---|---|
| Buys, 1w | Sign up |
| Buys, 1m | Sign up |
| Buys, 1y | Sign up |
| Sells, 1w | Sign up |
| Sells, 1m | Sign up |
| Sells, 1y | Sign up |
Sign up to see this company's insider trades
| Figure | FY 2025 | FY 2024 | FY 2023 | FY 2022 | FY 2021 | FY 2020 | FY 2019 | FY 2018 | FY 2017 | FY 2016 | FY 2015 | FY 2014 | FY 2013 |
|---|---|---|---|---|---|---|---|---|---|---|---|---|---|
| Revenue | 40.742T | 42.103T | 41.896T | 43.162T | 34.455T | 30.216T | 30.762T | 31.156T | 29.279T | 28.103T | 13.345T | 5.13T | 3.226T |
| Net profit | 2.439T | 2.23T | 2.218T | 2.044T | 1.635T | 1.035T | 1.05T | 1.713T | 639.798B | 107.357B | 2.747T | 455.647B | 45.216B |
| Free cash flow | 1.287T | 1.679T | 1.57T | 1.513T | 658.761B | — | — | — | — | — | — | — | — |
Filed figures
Lines the statements and their notes report beside the headline figures, read from the filings' XBRL as filed (no restatement applied), with figures computed from one filing's own lines. Cash-flow lines carry their cash direction: an outflow is negative. Each period links to its filing; a figure's period, report date and tag are in its tooltip.
| Figure | Dec 2016 | Dec 2017 | Dec 2018 | Dec 2019 | Dec 2020 | Dec 2021 | Dec 2022 | Dec 2023 | Dec 2024 | Dec 2025 |
|---|---|---|---|---|---|---|---|---|---|---|
| Balance sheet detail | ||||||||||
| Trade receivables (KRW) | 5.38T | 4.99T | 4.88T | 4.37T | 5.08T | 5.71T | 6.71T | 6.41T | 7.33T | 7.38T |
| ↳ YoY growth | -4.4% | -7.3% | -2.2% | -10.5% | +16.2% | +12.5% | +17.5% | -4.5% | +14.3% | +0.8% |
| ↳ 5y CAGR | -2.1% | +1.2% | +6.1% | +5.6% | +10.9% | +7.8% | ||||
| Borrowings, current (KRW) | 1.61T | 3.44T | 3.26T | 2.71T | 2.13T | 349B | 3.56T | 1.44T | 2.13T | 799B |
| Borrowings, non-current (KRW) | 3.66T | — | — | — | — | 1.41T | 2.06T | 1.64T | 1.74T | 1.61T |
| Cash and deposits (KRW) | 2.7T | 2.99T | 2.9T | 2.7T | 2.4T | 2.25T | 4.2T | 3.12T | 3.62T | 3.46T |
| Intangible assets (KRW) | — | — | — | — | — | 739B | 6.67T | 6.43T | 6.19T | 5.96T |
| Right-of-use assets (KRW) | — | 0.00 | 0.00 | 398B | 365B | 292B | 755B | 879B | 1.05T | 567B |
| Net debt (borrowings + leases - cash) (KRW) | 2.57T | 447B | 360B | 8.61B | -275B | -491B | -643B | -43.4B | 245B | -1.05T |
| Cash flow detail | ||||||||||
| Operating cash flow (KRW) | 1.36T | 1.31T | 1.68T | 771B | 1.27T | 1.2T | 2.62T | 2.8T | 3.31T | 3.02T |
| Purchases of property, plant and equipment (KRW) | — | — | — | — | — | -537B | -1.11T | -1.23T | -1.63T | -1.74T |
| Purchases of intangible assets (KRW) | — | — | — | — | — | -49.8B | -146B | -197B | -166B | -169B |
| Dividends paid (cash effect) (KRW) | — | — | — | — | — | -379B | -693B | -376B | -417B | — |
| Share buybacks (cash effect) (KRW) | — | — | — | — | — | — | -199B | 0.00 | 0.00 | — |
| Interest paid (cash effect) (KRW) | -245B | -195B | -224B | -127B | -96.4B | -99.9B | -144B | -238B | -220B | -134B |
| Income taxes paid (cash effect) (KRW) | -254B | -187B | -83.6B | -793B | -275B | -344B | -1.01T | -780B | -874B | -1.22T |
| Free cash flow (OCF - PPE - intangibles) (KRW) | — | — | — | — | — | 609B | 1.37T | 1.37T | 1.51T | 1.12T |
| Income detail | ||||||||||
| Total comprehensive income (KRW) | 1.4T | 4.16T | -2.11T | 4.49T | 6.53T | 791B | -2.42T | 8.37T | -2.23T | 20.8T |
| Comprehensive income to owners (KRW) | 1.48T | 4.36T | -2.15T | 4.49T | 6.42T | 587B | -2.94T | 7.85T | -2.76T | 19.3T |
| Reported | Apr 2, 2018 | Mar 30, 2020 | May 15, 2019 | Mar 30, 2020 | Mar 11, 2021 | Mar 29, 2024 | Mar 29, 2024 | Aug 14, 2025 | Aug 14, 2025 | Mar 12, 2026 |
Sign up to see institutional holdings
Sign UpPodcast Mentions
Sign up to see podcast mentions and sentiment
Sign UpDisclosures filed with DART (material events and exchange disclosures), newest first, headlines as filed in Korean. The link opens the filing on DART. Press releases from the company's own website, newest first.
































Prompts
Click prompts to add them under the company line, click again to take one out, then copy the result into your AI chat. Shared by Asian Century Stocks and Uncovered Thai Stocks. Thank you.
SAMSUNG C&T (ticker 028260), listed in South Korea.
Copied
ETFs Holding SAMSUNG C&T
Exchange-traded funds whose newest published daily portfolio holds one of the company's listings, largest weight first.
| ETF | Weight in ETF | Shares | Market value | As of |
|---|---|---|---|---|
| EMEQ | 4.49% | 99,906 | $ 30.211M | Jun 30, 2026 |
| MKOR | 2.86% | 14,162 | $ 4.283M | Jun 30, 2026 |
| EMM | 2.63% | 5,516 | $ 1.517M | Aug 31, 2026 |
| FPAG | 2.30% | 41,110 | $ 12.431M | Jun 30, 2026 |
| AGEM | 1.54% | 22,284 | $ 5.494M | Jul 31, 2026 |
| EMC | 0.93% | 1,964 | $ 540.294K | Aug 31, 2026 |
| MINV | 0.92% | 5,643 | $ 1.706M | Jun 30, 2026 |
| EYLD | 0.76% | 26,574 | $ 6.552M | Jul 31, 2026 |
| ASIA | 0.53% | 990 | $ 299.371K | Jun 30, 2026 |
| SEEM | 0.21% | 4,200 | $ 1.27M | Jun 30, 2026 |
| AVXC | 0.10% | 1,975 | $ 398.949K | Nov 16, 2026 |
| AVSE | 0.08% | 875 | $ 176.749K | Nov 16, 2026 |
| TIER | 0.06% | 93 | $ 21.666K | Jul 31, 2026 |
| AVEM | 0.05% | 71,620 | $ 14.467M | Nov 16, 2026 |