연결재무제표기준영업(잠정)실적(공정공시)
Bull 0
Bear 4
Results
022100
|
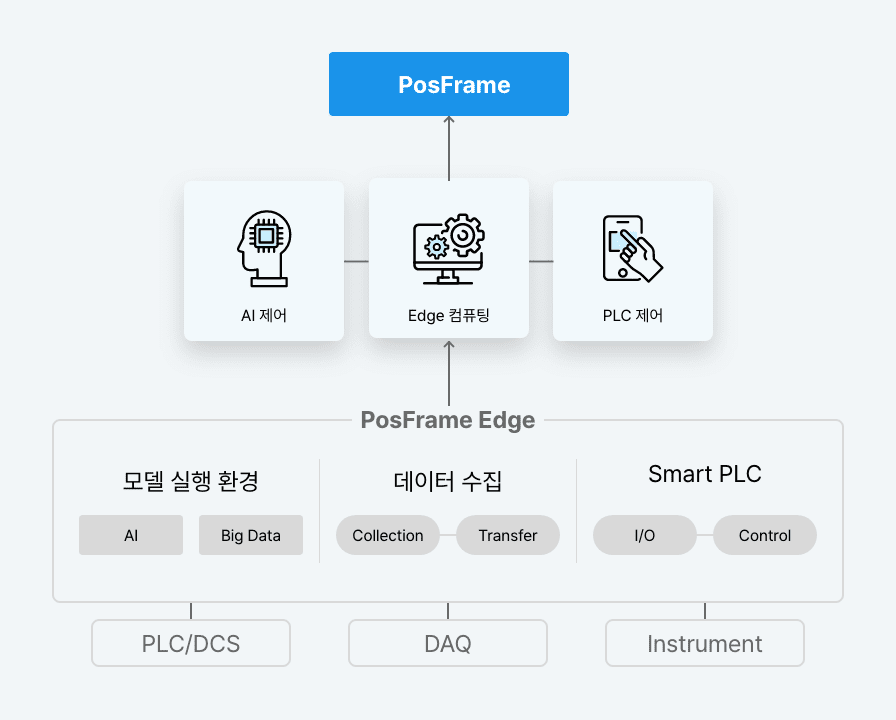
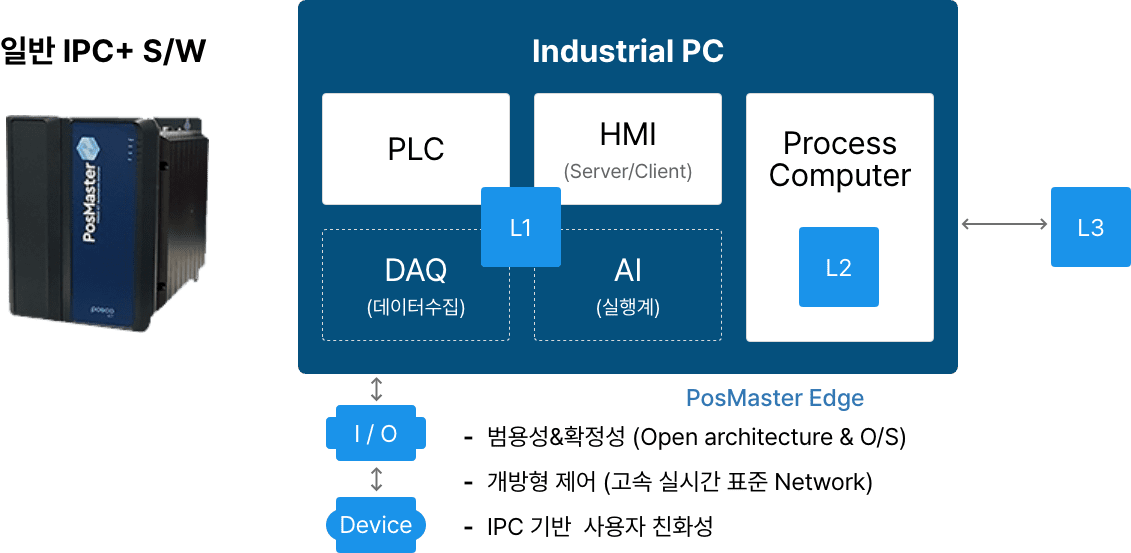
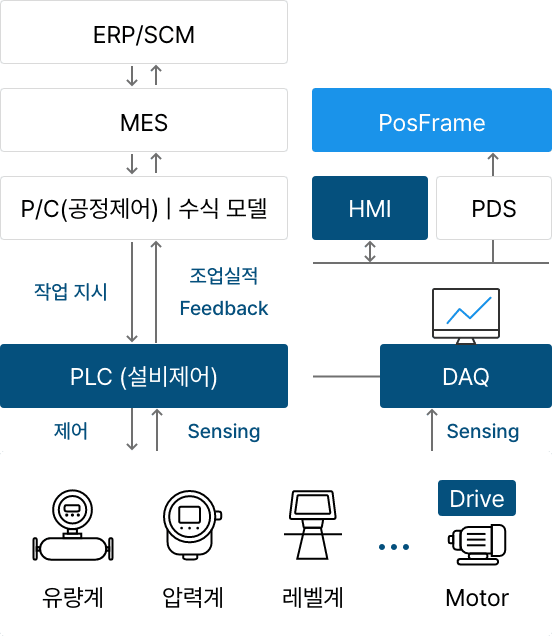
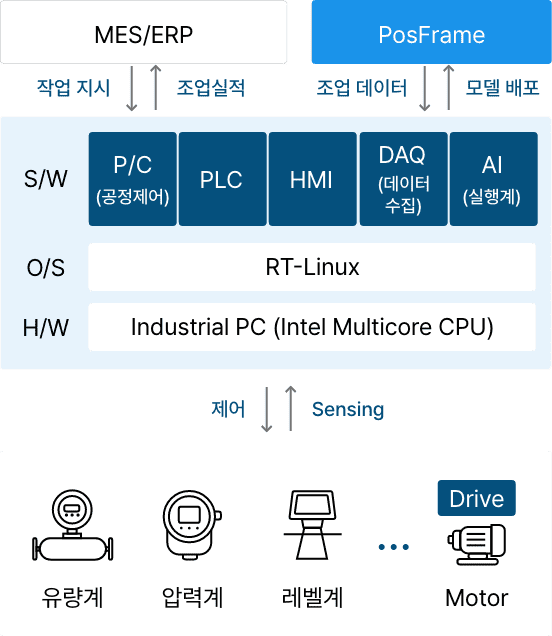
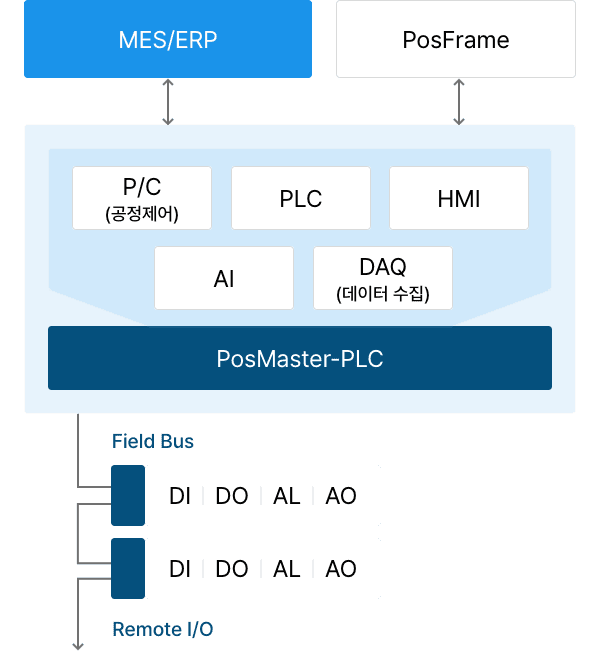
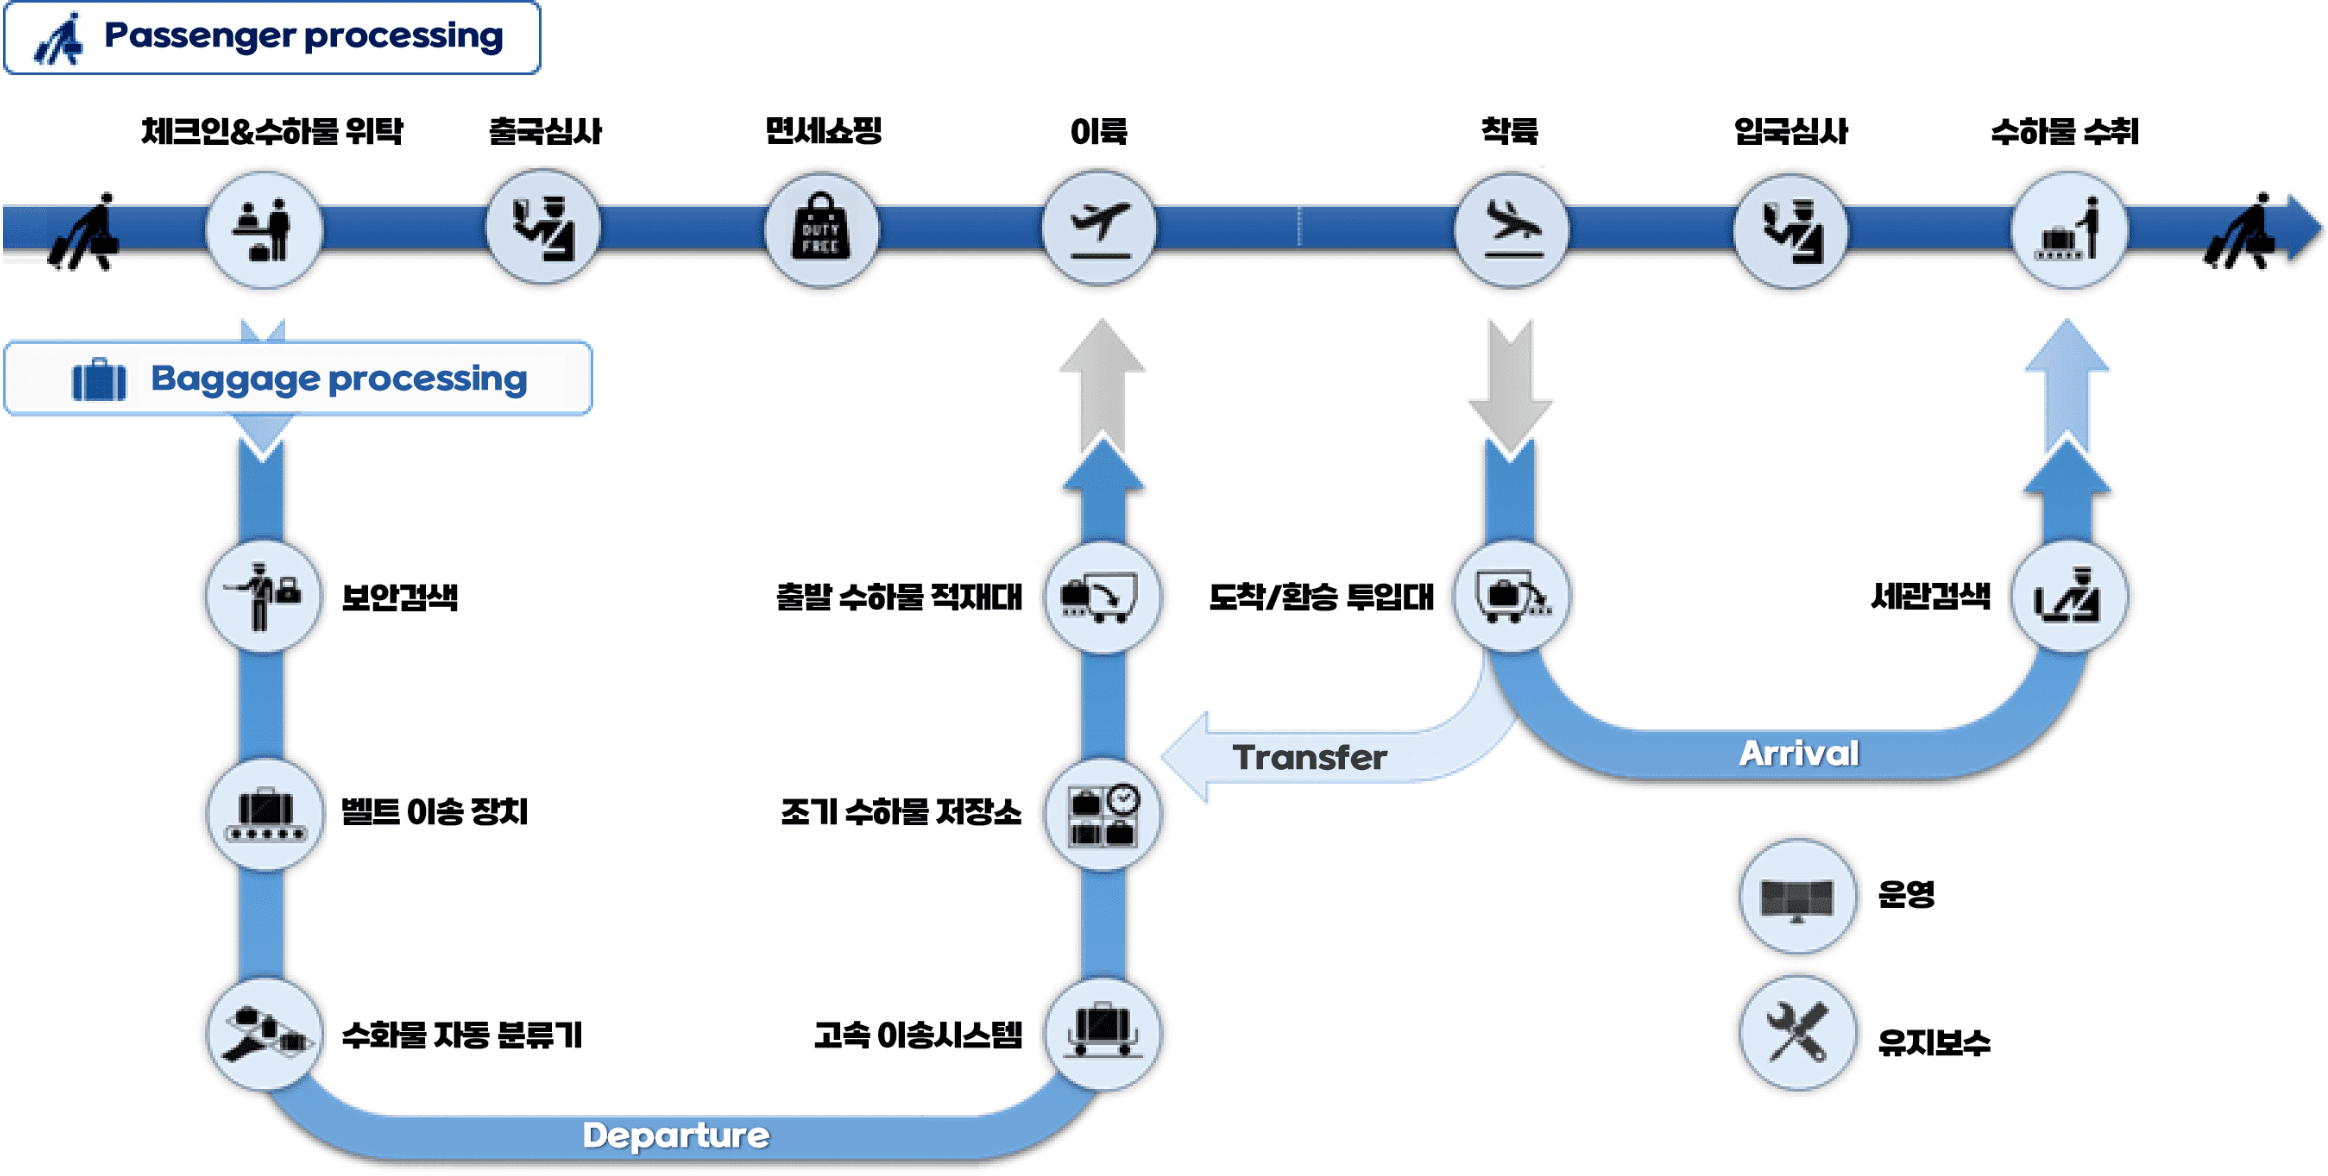
POSCO DX is an IT services and automation company that provides digital transformation solutions for industrial manufacturing. Its business segments include automation, IT services, and logistics automation. The automation segment focuses on process control, power and automatic control equipment, and industrial robotics for steel and secondary battery material production, supporting the transition to Intelligent Factories. The IT services segment offers enterprise solutions such as MES, ERP, data center operations, and AI-driven platforms, including the development of P-GPT and physical AI systems using the NVIDIA Omniverse platform. The company also provides logistics automation services, including baggage handling systems for airports and fulfillment centers for manufacturing and distribution. POSCO DX serves the POSCO Group and external clients in South Korea and overseas, with subsidiaries in China, Indonesia, and Vietnam. Notable partnerships include collaborations with AWS, Cisco, Siemens, and Deepexi for AI and edge computing solutions. The company was formerly known as POSCO DX and has been operating since its establishment, with a history of developing smart factory platforms like PosFrame. Summarised from the company's own disclosures, fiscal year ended Apr 2026 |
Industry Information Technology Services | Homepage poscodx.com |
| Sector Technology | IR page poscodx.com/kor | |
|
Tags
industrial automation, smart factory, it services, ai solutions, logistics automation, robotics, digital transformation, process control, secondary battery materials, steel industry, PosFrame, P-GPT, A.WORKS, Facero, SmartPOP, CREDEX, Vision AI, POSCO DX-VIETNAM CO. LTD, POSCO Fulfillment Center, Incheon International Airport BHS, Hanjin Express Mega Hub, NVIDIA Omniverse, AWS, Cisco, Siemens, Deepexi, Daim Research, Bit Computer, CJ Logistics, POSCO Chemical, POSCO Future M, POSCO International
|
Press page — |
Metrics
| Valuation | |
|---|---|
| Market cap | ₩ 2.607T |
| Market cap (USD) | $ 1.919B |
| P/E | 81.67 |
| PEG | 17.97 |
| P/BV | 4.62 |
| P/S | 2.66 |
| P/OCF | 45.56 |
| P/FCF | 52.98 |
| Dividend yield | — |
| Turnover / mcap | — |
| Returns | |
|---|---|
| ROE | 9.5% |
| ROI | 9.1% |
| ROIC | 8.1% |
| Profit margin | 4.8% |
| Growth | |
|---|---|
| Revenue growing | No |
| Profits growing | No |
| Revenue up 3y | No |
| Revenue up 5y | No |
| Earnings growth 3y (net profit CAGR) | 4.5% |
| Quality | |
|---|---|
| Profitable | Yes |
| Margin expanding | No |
| Buying back stock | — |
| Diluting (TTM) | No |
| Debt/Equity | — |
| Podcast bulls (TTM) | Sign up |
| Podcast bears (TTM) | Sign up |
| Podcast sentiment (TTM) | Sign up |
| Podcast sentiment % (TTM) | Sign up |
| News sentiment (TTM) | — |
| Quality score | -18.8% |
| Insiders | |
|---|---|
| Buys, 1w | Sign up |
| Buys, 1m | Sign up |
| Buys, 1y | Sign up |
| Sells, 1w | Sign up |
| Sells, 1m | Sign up |
| Sells, 1y | Sign up |
Sign up to see this company's insider trades
| Figure | FY 2025 | FY 2024 | FY 2023 | FY 2022 | FY 2021 | FY 2020 | FY 2019 | FY 2018 | FY 2017 | FY 2016 | FY 2015 | FY 2014 | FY 2013 |
|---|---|---|---|---|---|---|---|---|---|---|---|---|---|
| Revenue | 1.075T | 1.473T | 1.486T | 1.153T | 869.274B | 964.202B | 969.787B | 927.077B | 950.592B | 866.894B | 840.546B | 969.869B | 1.207T |
| Net profit | 52.081B | 88.037B | 91.879B | 45.582B | -14.213B | 8.674B | 39.161B | -34.199B | 41.9B | 36.901B | -51.474B | 25.65B | 25.029B |
| Free cash flow | 140.499B | 85.106B | 11.034B | -7.959B | -53.572B | 62.111B | 59.185B | 7.325B | 4.537B | -8.136B | 56.128B | 14.183B | 102.532B |
Filed figures
Lines the statements and their notes report beside the headline figures, read from the filings' XBRL as filed (no restatement applied), with figures computed from one filing's own lines. Cash-flow lines carry their cash direction: an outflow is negative. Each period links to its filing; a figure's period, report date and tag are in its tooltip.
| Figure | Dec 2016 | Dec 2017 | Dec 2018 | Dec 2019 | Dec 2020 | Dec 2021 | Dec 2022 | Dec 2023 | Dec 2024 | Dec 2025 |
|---|---|---|---|---|---|---|---|---|---|---|
| Balance sheet detail | ||||||||||
| Trade receivables (KRW) | 277B | 278B | 197B | 237B | 223B | 241B | 330B | 349B | 300B | 227B |
| ↳ YoY growth | +2.4% | +0.3% | -28.9% | +20.3% | -6.1% | +8.3% | +36.9% | +5.6% | -14.0% | -24.3% |
| ↳ 5y CAGR | -6.8% | -5.1% | -3.8% | -2.7% | +3.6% | +12.1% | +4.8% | +0.4% | ||
| Borrowings, current (KRW) | 2.17B | 1.68B | 1.67B | 1.39B | 983M | 711M | 382M | 0.00 | 0.00 | — |
| Borrowings, non-current (KRW) | 76.6M | 76.6M | — | — | — | — | 76.6M | 76.6M | 76.6M | 76.6M |
| Cash and deposits (KRW) | 71.2B | 59.3B | 51B | 97.7B | 137B | 29.6B | 32B | 60.2B | 129B | 247B |
| Intangible assets (KRW) | 25.7B | 23.7B | 23.6B | 9.52B | 7B | 7.7B | 11.7B | 13.3B | 12.6B | 11.8B |
| Net debt (borrowings + leases - cash) (KRW) | -71.1B | -57.5B | -49.3B | -96.3B | -136B | -28.9B | -31.6B | -60.1B | -129B | -247B |
| Cash flow detail | ||||||||||
| Operating cash flow (KRW) | 7.42B | 22.2B | 29.5B | 63.8B | 65.6B | -51.9B | -3.94B | 21.8B | 97.8B | 146B |
| Purchases of property, plant and equipment (KRW) | -15.6B | -17.6B | -22.2B | -4.65B | -3.44B | -1.66B | -4.02B | -10.8B | -12.7B | -5.45B |
| Purchases of intangible assets (KRW) | -5.22B | -8.91B | -10B | -4.39B | -1.14B | -2.86B | -4.97B | -4.95B | -1.64B | -3.29B |
| Dividends paid (cash effect) (KRW) | -24.1M | -7.79B | -11.4B | -7.63B | -7.64B | -7.63B | -7.63B | -11.5B | -15.3B | -19.1B |
| Interest paid (cash effect) (KRW) | -454M | -168M | -148M | -73.2M | -186M | -295M | -134M | -252M | -223M | -107M |
| Income taxes paid (cash effect) (KRW) | 387M | -5.5B | -10.4B | -2.18B | -3.64B | -3.06B | -810M | -24.5B | -4.37B | -17B |
| Free cash flow (OCF - PPE - intangibles) (KRW) | -13.4B | -4.37B | -2.72B | 54.8B | 61B | -56.4B | -12.9B | 6.09B | 83.5B | 137B |
| Income detail | ||||||||||
| Total comprehensive income (KRW) | 39.8B | 33B | -44.6B | 34.7B | 11.3B | -3.13B | 62.4B | 58.8B | 79.7B | 65.7B |
| Comprehensive income to owners (KRW) | 39.1B | 33B | -44.7B | 34.1B | 11.1B | -3.53B | 62.2B | 58.5B | 78.9B | 65.4B |
| Reported | Jun 22, 2018 | Jun 22, 2018 | Mar 29, 2019 | Mar 25, 2020 | Mar 5, 2021 | Jun 18, 2024 | Mar 14, 2025 | Mar 14, 2025 | Mar 14, 2025 | Apr 17, 2026 |
Sign up to see institutional holdings
Sign UpPodcast Mentions
Sign up to see podcast mentions and sentiment
Sign UpDisclosures filed with DART (material events and exchange disclosures), newest first, headlines as filed in Korean. The link opens the filing on DART. Press releases from the company's own website, newest first.
 - 엔터프라이즈 AI 운영체제 ‘AgentOS’ 개발 스타트업 ‘인핸스’社에 20억 원 규모 투자
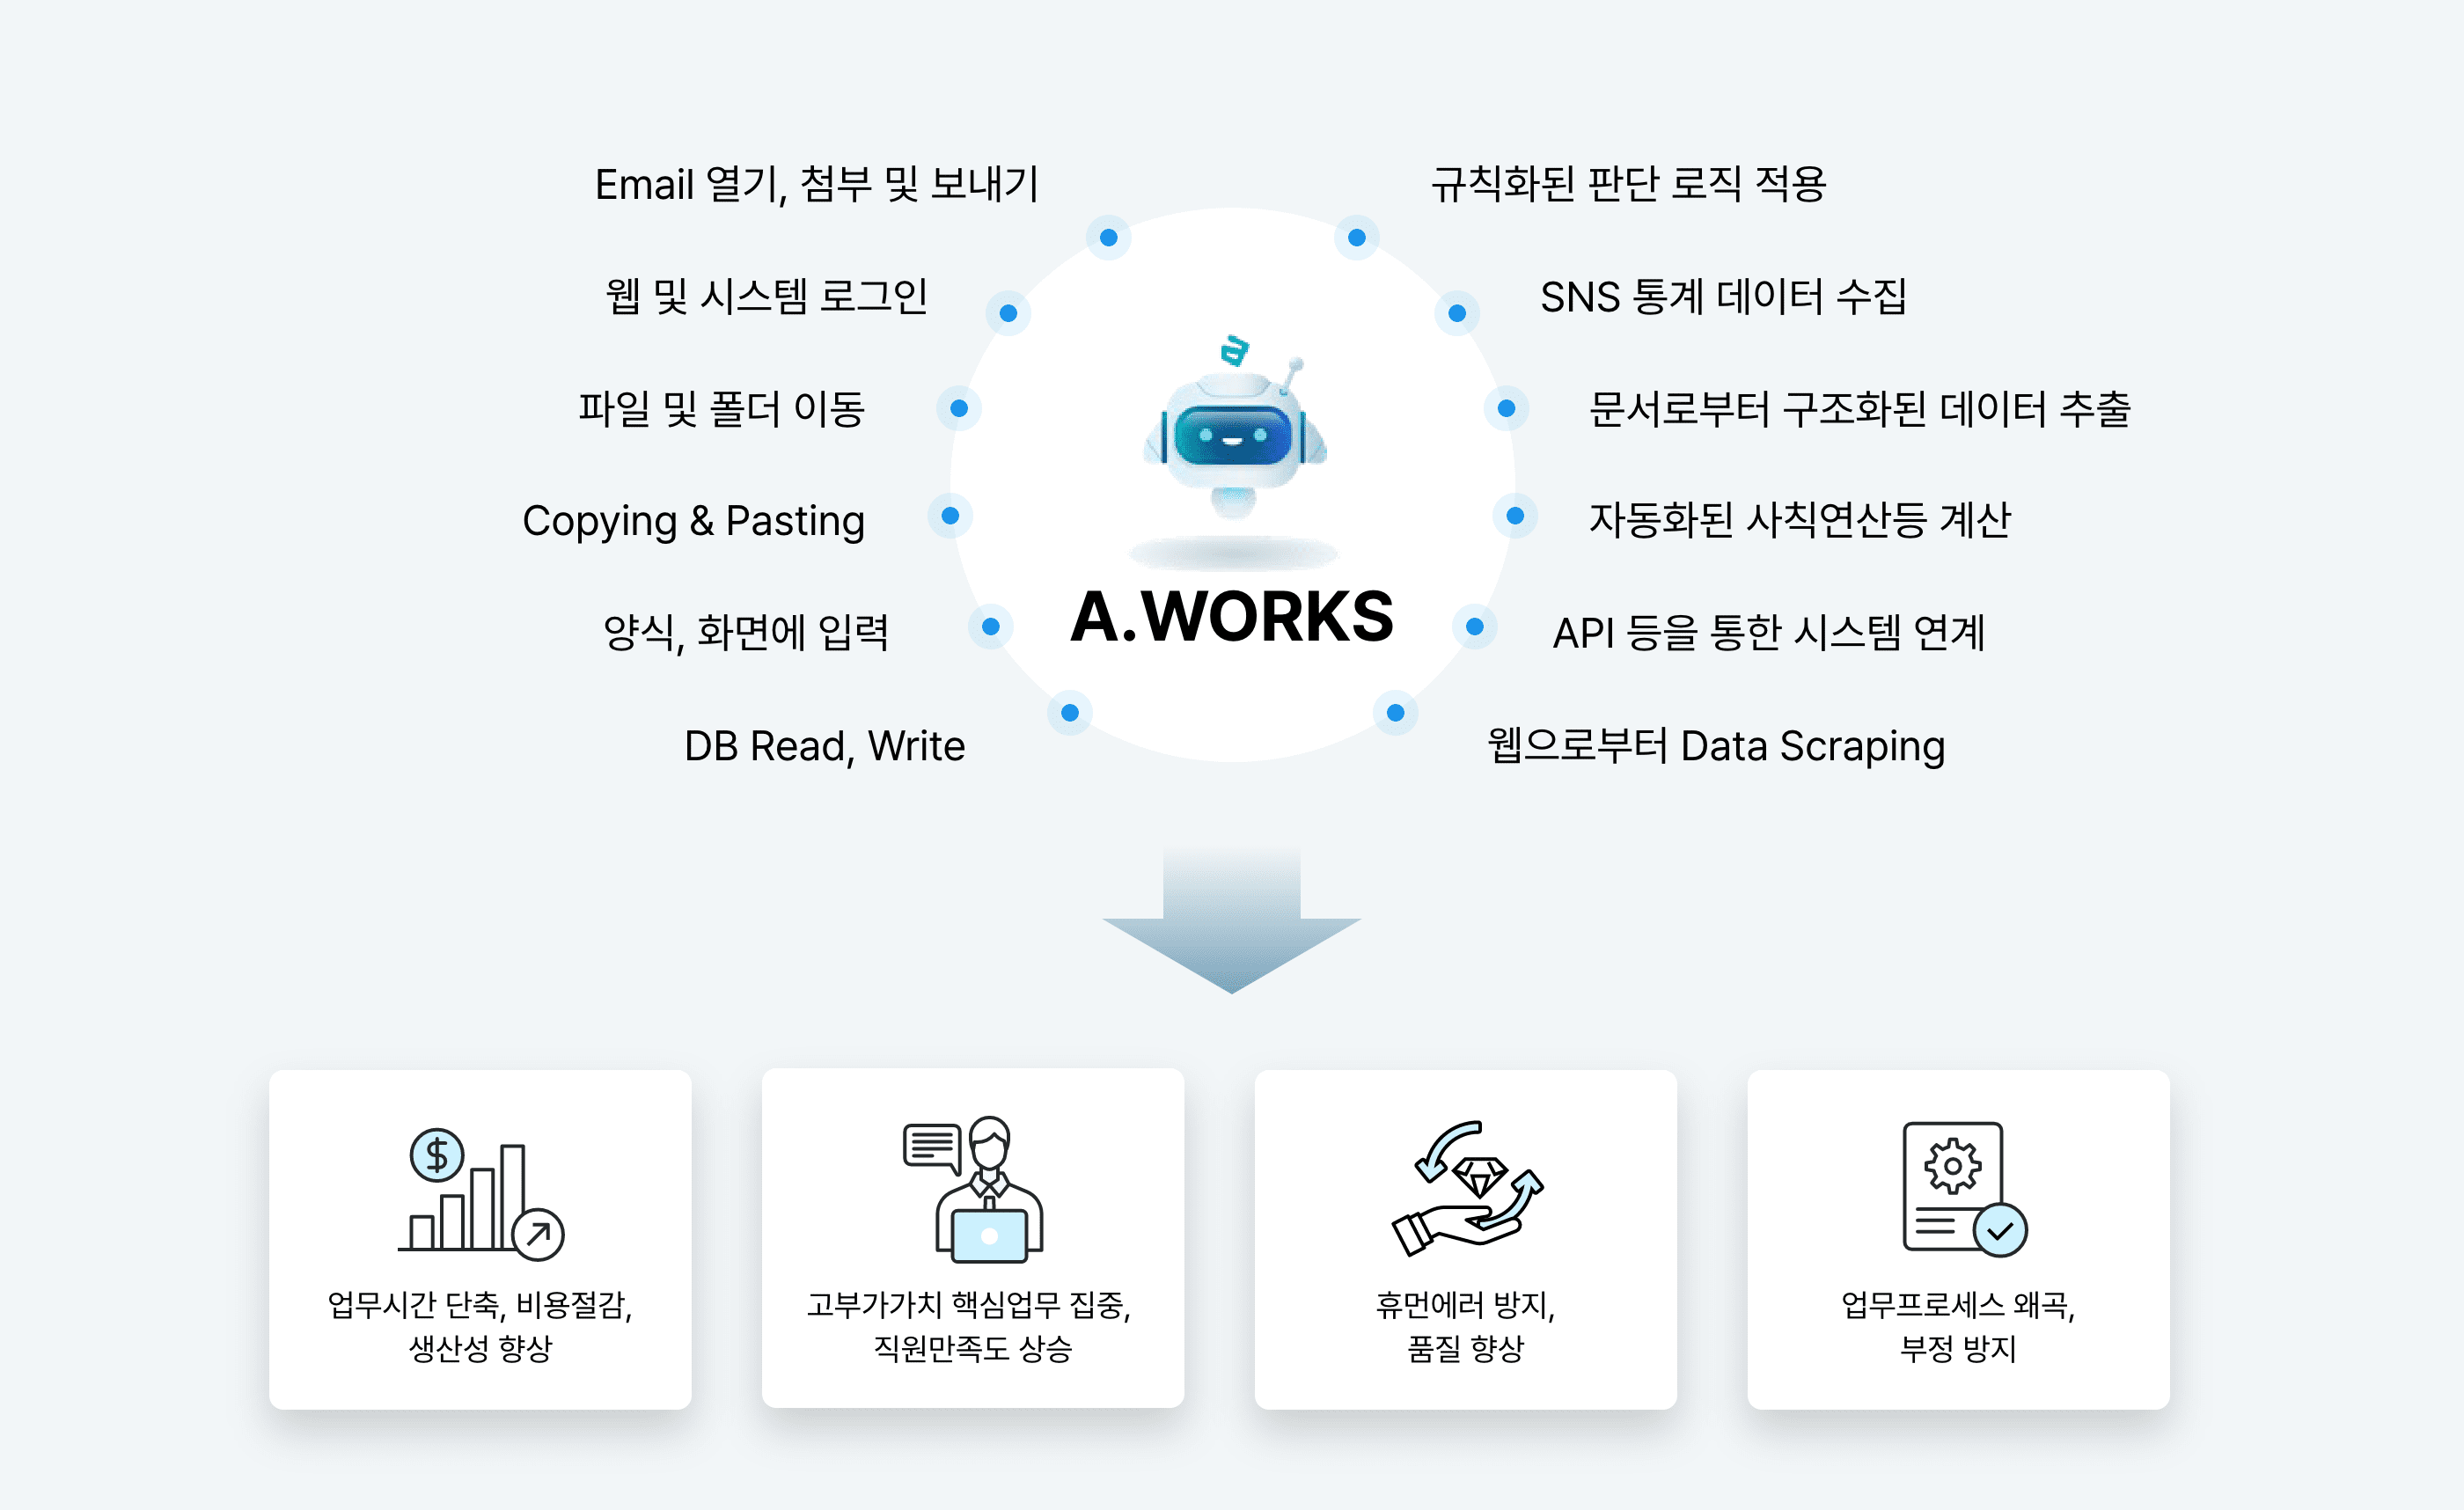
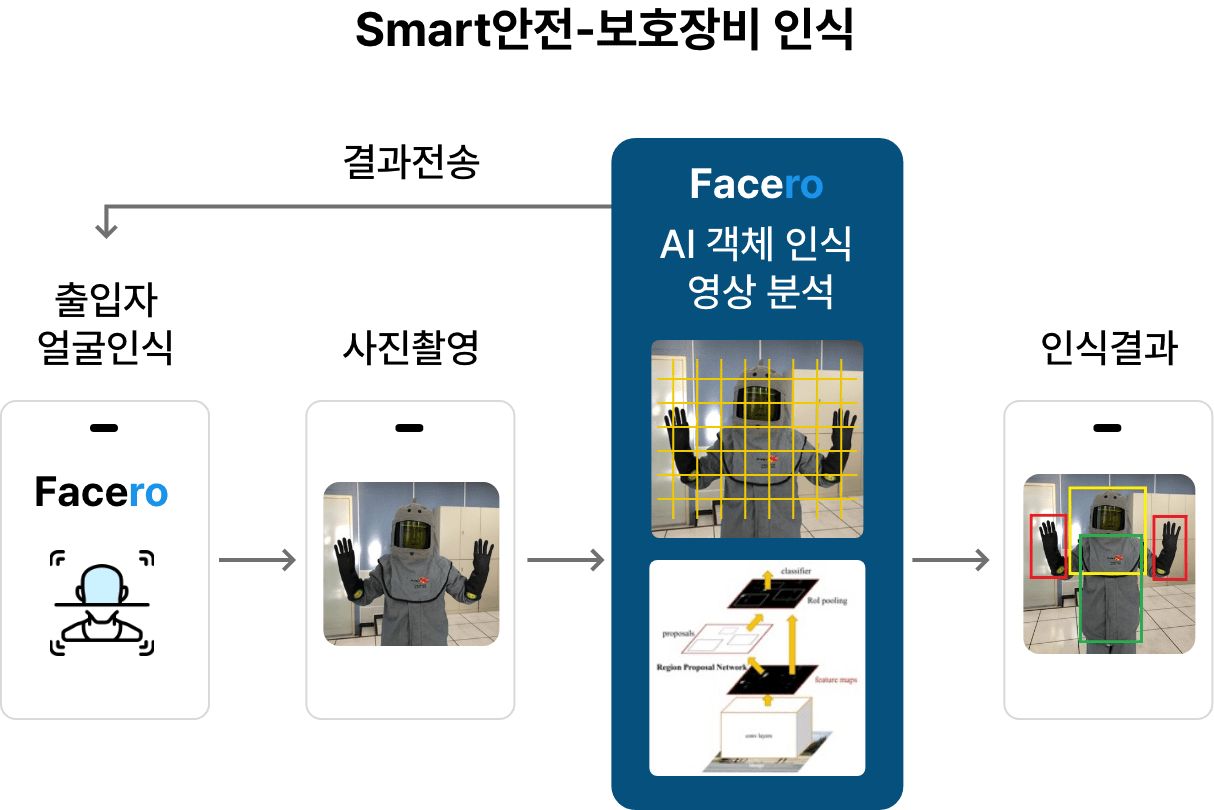
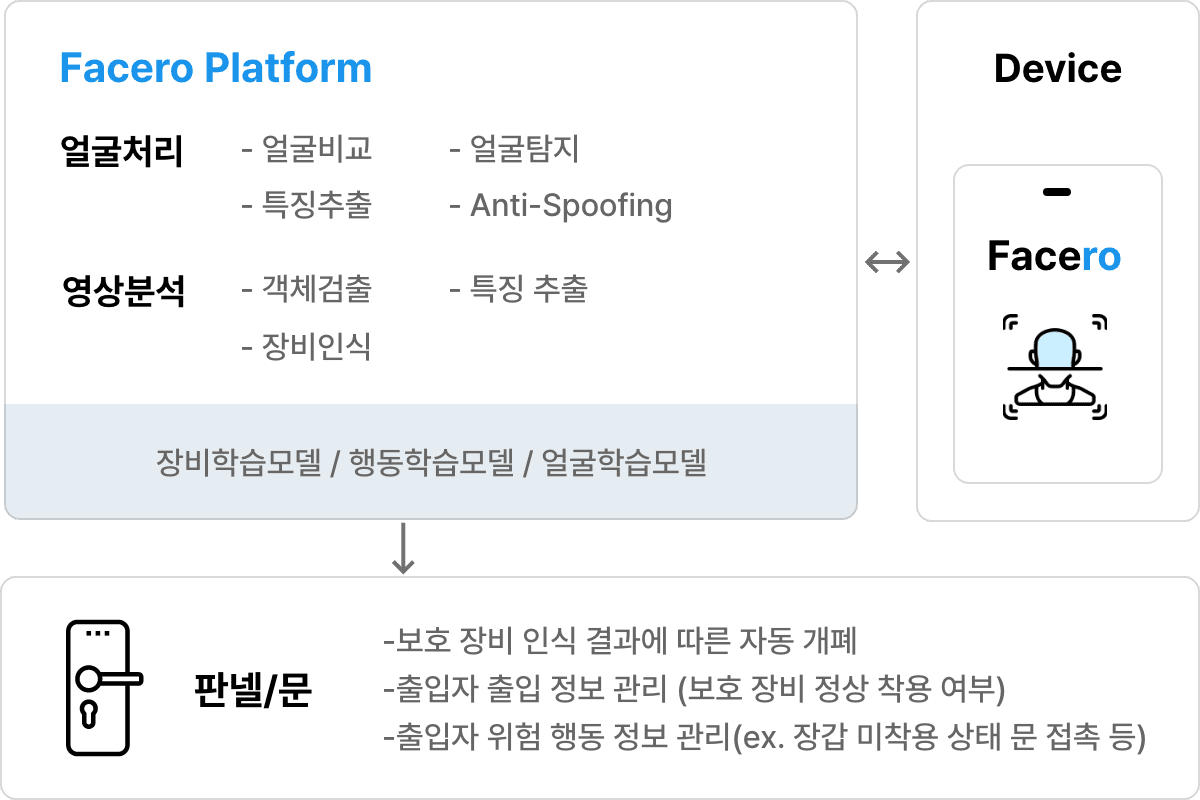
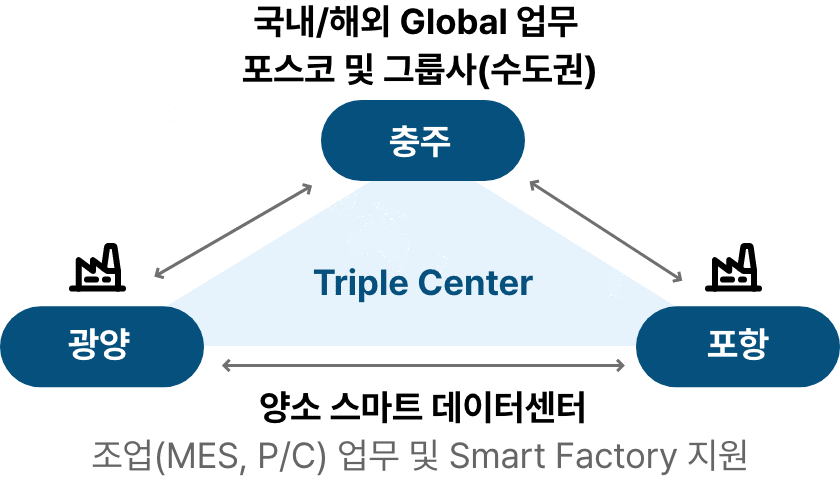
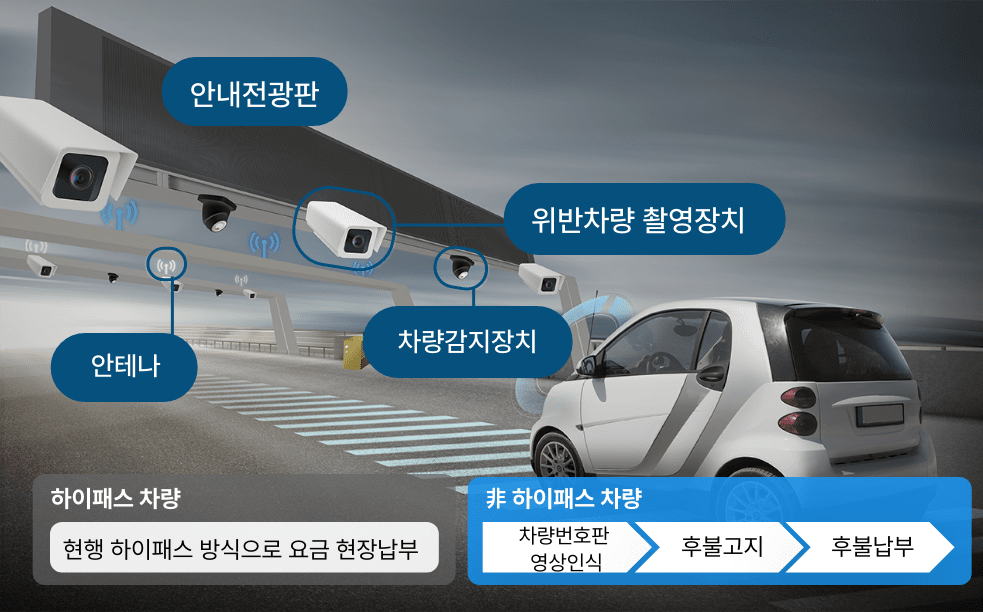
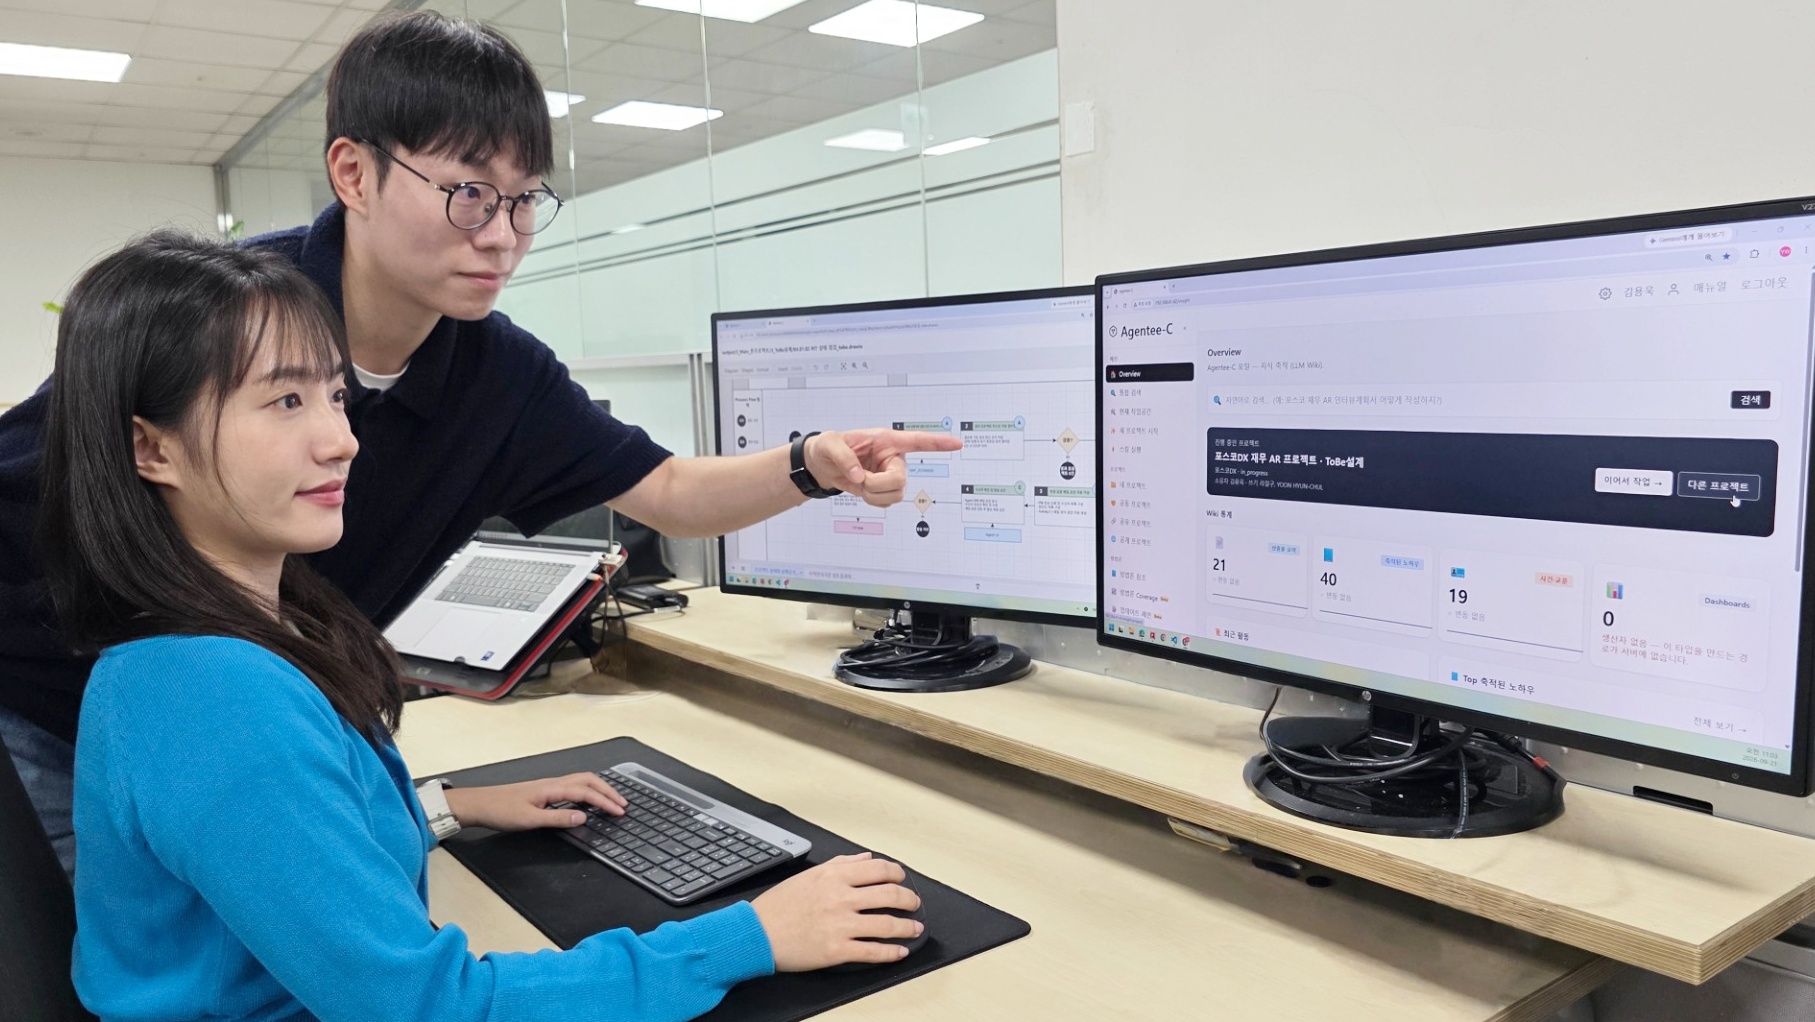 - AX 컨설팅 분석 및 산출물 작성 자동화로 AI 에이전트 도입 기간 절반 이상 단축**- 컨설팅 산출물을 개발 플랫폼과 연계하는 통합 개발 및 운영 체계 구축**포스코그룹이 AI 에이전트 개발 컨설팅 프로젝트에 활용할 수 있는 AI를 개발해 현장에 적용한다.
 - 포스코DX ‘2026 AI Youth Challenge’ 개최, 높은 관심 속 215개 팀 참가**- 아이디어부터 시제품 제작까지 기업·학계 멘토링으로 청소년 AI개발자 꿈 키워**“물벼룩의 행동을 AI로 분석해 수질 오염도를 확인하는 시스템입니다. 수질 변화에 민감한 물벼룩의 움직임을 AI로 탐지하고, 이동 속도와 활동량 등을 분석해 수질 이상 여부를 실시간 판단합니다. 기존 수질 검사는 여러 시약과 시험지에 의존해 실시간 확인이 어려운데, AI를 활용한 효과적인 해결책이 될 것 같습니다.”


 - ‘AX 해커톤’ 개최해 업무 자동화·생산성 향상 아이디어 발굴, 우수작 서비스화 추진
 - 로봇 운영 기술과 AI 모델 결합해 산업현장용 피지컬AI 고도화 위한 MOU체결
 **- '청소년 AI 창의 경진대회’ 개최.. 전국 청소년 대상 AI 활용한 일상∙산업 개선 아이디어 공모
Prompts
Click prompts to add them under the company line, click again to take one out, then copy the result into your AI chat. Shared by Asian Century Stocks and Uncovered Thai Stocks. Thank you.
POSCO DX (ticker 022100), listed in South Korea.
Copied
ETFs Holding POSCO DX
Exchange-traded funds whose newest published daily portfolio holds one of the company's listings, largest weight first.
| ETF | Weight in ETF | Shares | Market value | As of |
|---|---|---|---|---|
| AVEE | 0.07% | 5,812 | $ 90.145K | Nov 16, 2026 |
| DFSE | 0.01% | 4,289 | $ 69.471K | Nov 12, 2026 |
| DFEM | 0.01% | 37,863 | $ 613.287K | Nov 12, 2026 |
| DEXC | 0.00% | 800 | $ 12.958K | Nov 12, 2026 |
| DFAE | 0.00% | 17,820 | $ 288.64K | Nov 12, 2026 |
| DFAX | 0.00% | 19,518 | $ 316.143K | Nov 12, 2026 |
| AVEM | 0.00% | 49,364 | $ 765.642K | Nov 16, 2026 |
| AVXC | 0.00% | 920 | $ 14.269K | Nov 16, 2026 |