의결권대리행사권유참고서류
Bull 3
Bear 0
M&A
011210
|
HYUNDAI WIA is a South Korean manufacturer of automotive components, mobility solutions, and defense equipment. The company produces core automotive parts including engines, modules, constant velocity joints, and 4WD systems, while expanding into electric vehicle components such as integrated thermal management systems and electric axles. Its mobility solutions segment provides smart factory automation, logistics robots, and manufacturing equipment for powertrain and body assembly. In the defense sector, the company manufactures large-caliber artillery, naval guns, and aircraft landing gear, and develops remote control weapon systems and anti-drone technologies. HYUNDAI WIA operates production facilities in South Korea, China, Mexico, India, Russia, Slovakia, and the United States, serving global automotive OEMs and defense agencies. Summarised from the company's own disclosures, fiscal year ended Mar 2026 |
Industry Auto Parts | Homepage hyundai-wia.com |
| Sector Consumer Cyclical | IR page hyundai-wia.com/main/main.asp | |
|
Tags
automotive components, engines, 4wd systems, constant velocity joints, thermal management, smart factory, logistics robots, defense equipment, artillery, naval guns, landing gear, remote control weapon systems, HYUNDAI WIA, e-TVTC, RCWS, CIWS-II, ADS, AMR, AGV, MPR, HMGICS, HMGMA
|
Press page — |
Metrics
| Valuation | |
|---|---|
| Market cap | ₩ 1.758T |
| Market cap (USD) | $ 1.294B |
| P/E | 24.22 |
| PEG | 1.63 |
| P/BV | 0.47 |
| P/S | 0.20 |
| P/OCF | 6.72 |
| P/FCF | -31.04 |
| Dividend yield | — |
| Turnover / mcap | — |
| Returns | |
|---|---|
| ROE | 2.7% |
| ROI | 2.7% |
| ROIC | 5.0% |
| Profit margin | 1.2% |
| Growth | |
|---|---|
| Revenue growing | No |
| Profits growing | No |
| Revenue up 3y | No |
| Revenue up 5y | No |
| Earnings growth 3y (net profit CAGR) | 14.8% |
| Quality | |
|---|---|
| Profitable | Yes |
| Margin expanding | No |
| Buying back stock | — |
| Diluting (TTM) | No |
| Debt/Equity | — |
| Podcast bulls (TTM) | Sign up |
| Podcast bears (TTM) | Sign up |
| Podcast sentiment (TTM) | Sign up |
| Podcast sentiment % (TTM) | Sign up |
| News sentiment (TTM) | — |
| Quality score | -25.0% |
| Insiders | |
|---|---|
| Buys, 1w | Sign up |
| Buys, 1m | Sign up |
| Buys, 1y | Sign up |
| Sells, 1w | Sign up |
| Sells, 1m | Sign up |
| Sells, 1y | Sign up |
Sign up to see this company's insider trades
| Figure | FY 2025 | FY 2024 | FY 2023 | FY 2022 | FY 2021 | FY 2020 | FY 2019 | FY 2018 | FY 2017 | FY 2016 | FY 2015 | FY 2014 | FY 2013 |
|---|---|---|---|---|---|---|---|---|---|---|---|---|---|
| Revenue | 8.482T | 8.181T | 8.59T | 7.767T | 7.528T | 6.592T | 7.315T | 7.88T | 7.487T | 7.589T | 7.884T | 7.596T | 7.092T |
| Net profit | 99.017B | 120.435B | 91.461B | 65.416B | 62.32B | 60.971B | 55.207B | -55.561B | -63.004B | 130.727B | 326.874B | 434.433B | 417.452B |
| Free cash flow | 192.344B | 350.953B | 336.238B | 310.831B | 138.697B | -62.483B | 265.802B | -287.385B | -235.429B | -83.672B | 50.468B | 157.758B | 221.4B |
Filed figures
Lines the statements and their notes report beside the headline figures, read from the filings' XBRL as filed (no restatement applied), with figures computed from one filing's own lines. Cash-flow lines carry their cash direction: an outflow is negative. Each period links to its filing; a figure's period, report date and tag are in its tooltip.
| Figure | Dec 2016 | Dec 2017 | Dec 2018 | Dec 2019 | Dec 2020 | Dec 2021 | Dec 2022 | Dec 2023 | Dec 2024 | Dec 2025 |
|---|---|---|---|---|---|---|---|---|---|---|
| Balance sheet detail | ||||||||||
| Trade receivables (KRW) | 1.19T | 1.17T | 1.67T | 1.4T | 1.46T | 1.49T | 1.65T | 1.51T | 1.43T | 1.34T |
| ↳ YoY growth | -6.8% | -1.4% | +42.4% | -16.1% | +4.5% | +1.8% | +10.4% | -8.1% | -5.4% | -6.0% |
| ↳ 5y CAGR | +9.3% | +1.1% | +2.8% | +4.6% | +7.0% | -2.0% | +0.4% | -1.7% | ||
| Borrowings, current (KRW) | 155B | 198B | 357B | 623B | 746B | 26B | 992B | 50.4B | 767B | 480B |
| Borrowings, non-current (KRW) | 849B | 858B | 775B | 622B | 981B | 1.72T | 927B | 935B | 473B | 730B |
| Bonds payable (KRW) | — | — | — | — | — | 748B | 299B | 99.8B | 49.9B | 349B |
| Lease liabilities (KRW) | — | 0.00 | 0.00 | 9.38B | 6.38B | 6.28B | 4.55B | 3.2B | 2.25B | 13.5B |
| Cash and deposits (KRW) | 799B | 931B | 336B | 383B | 555B | 435B | 674B | 472B | 758B | 1.12T |
| Intangible assets (KRW) | 246B | 244B | 213B | 170B | 172B | 160B | 109B | 106B | 117B | 139B |
| Right-of-use assets (KRW) | — | 0.00 | 0.00 | 9.33B | 29.8B | 29.5B | 26B | 23.2B | 23.8B | 39.5B |
| Net debt (borrowings + leases - cash) (KRW) | 205B | 125B | 796B | 871B | 1.18T | 1.32T | 1.25T | 517B | 484B | 106B |
| Cash flow detail | ||||||||||
| Operating cash flow (KRW) | 355B | 72.7B | -113B | 444B | 189B | 290B | 424B | 468B | 592B | 404B |
| Purchases of property, plant and equipment (KRW) | -438B | -308B | -174B | -178B | -252B | -152B | -113B | -132B | -241B | -212B |
| Purchases of intangible assets (KRW) | -48.1B | -42B | -36.9B | -37.5B | -27.1B | -25.2B | -17.2B | -21.1B | -36.5B | -41.6B |
| Dividends paid (cash effect) (KRW) | -29.2B | -29.2B | -15.9B | -15.9B | -18.6B | -18.6B | -18.6B | -18.7B | -22.6B | -29.3B |
| Share buybacks (cash effect) (KRW) | -2.51B | 0.00 | 0.00 | 0.00 | — | — | — | -24M | -691M | -8.1B |
| Interest paid (cash effect) (KRW) | -44.6B | -49.6B | -63.9B | -65.8B | -60.2B | -57.9B | -64.3B | -68B | -56.2B | -47.3B |
| Income taxes paid (cash effect) (KRW) | -182B | -46.6B | 1.95B | -11.3B | -17.2B | — | — | — | — | — |
| Free cash flow (OCF - PPE - intangibles) (KRW) | -132B | -277B | -324B | 228B | -89.6B | 113B | 294B | 315B | 314B | 151B |
| Income detail | ||||||||||
| Total comprehensive income (KRW) | 125B | -89.3B | -87.2B | 70.8B | 31.5B | 188B | 52.6B | 51.8B | 282B | 66.1B |
| Comprehensive income to owners (KRW) | 125B | -89.3B | -87.2B | 70.8B | 44.9B | 151B | 83.3B | 91.2B | 229B | 40B |
| Reported | Mar 31, 2017 | Mar 30, 2020 | Mar 30, 2020 | Mar 30, 2020 | Mar 16, 2021 | Mar 29, 2024 | Mar 29, 2024 | Mar 17, 2026 | Mar 17, 2026 | Mar 17, 2026 |
Sign up to see institutional holdings
Sign UpPodcast Mentions
Sign up to see podcast mentions and sentiment
Sign UpDisclosures filed with DART (material events and exchange disclosures), newest first, headlines as filed in Korean. The link opens the filing on DART. Press releases from the company's own website, newest first.
연결재무제표기준영업(잠정)실적(공정공시)
Bull 1
Bear 4
Results
현대위아, IZB 2026에서 열관리·차세대 구동 기술 공개
Bull 1
Bear 0
Product/operations
2026-10-28
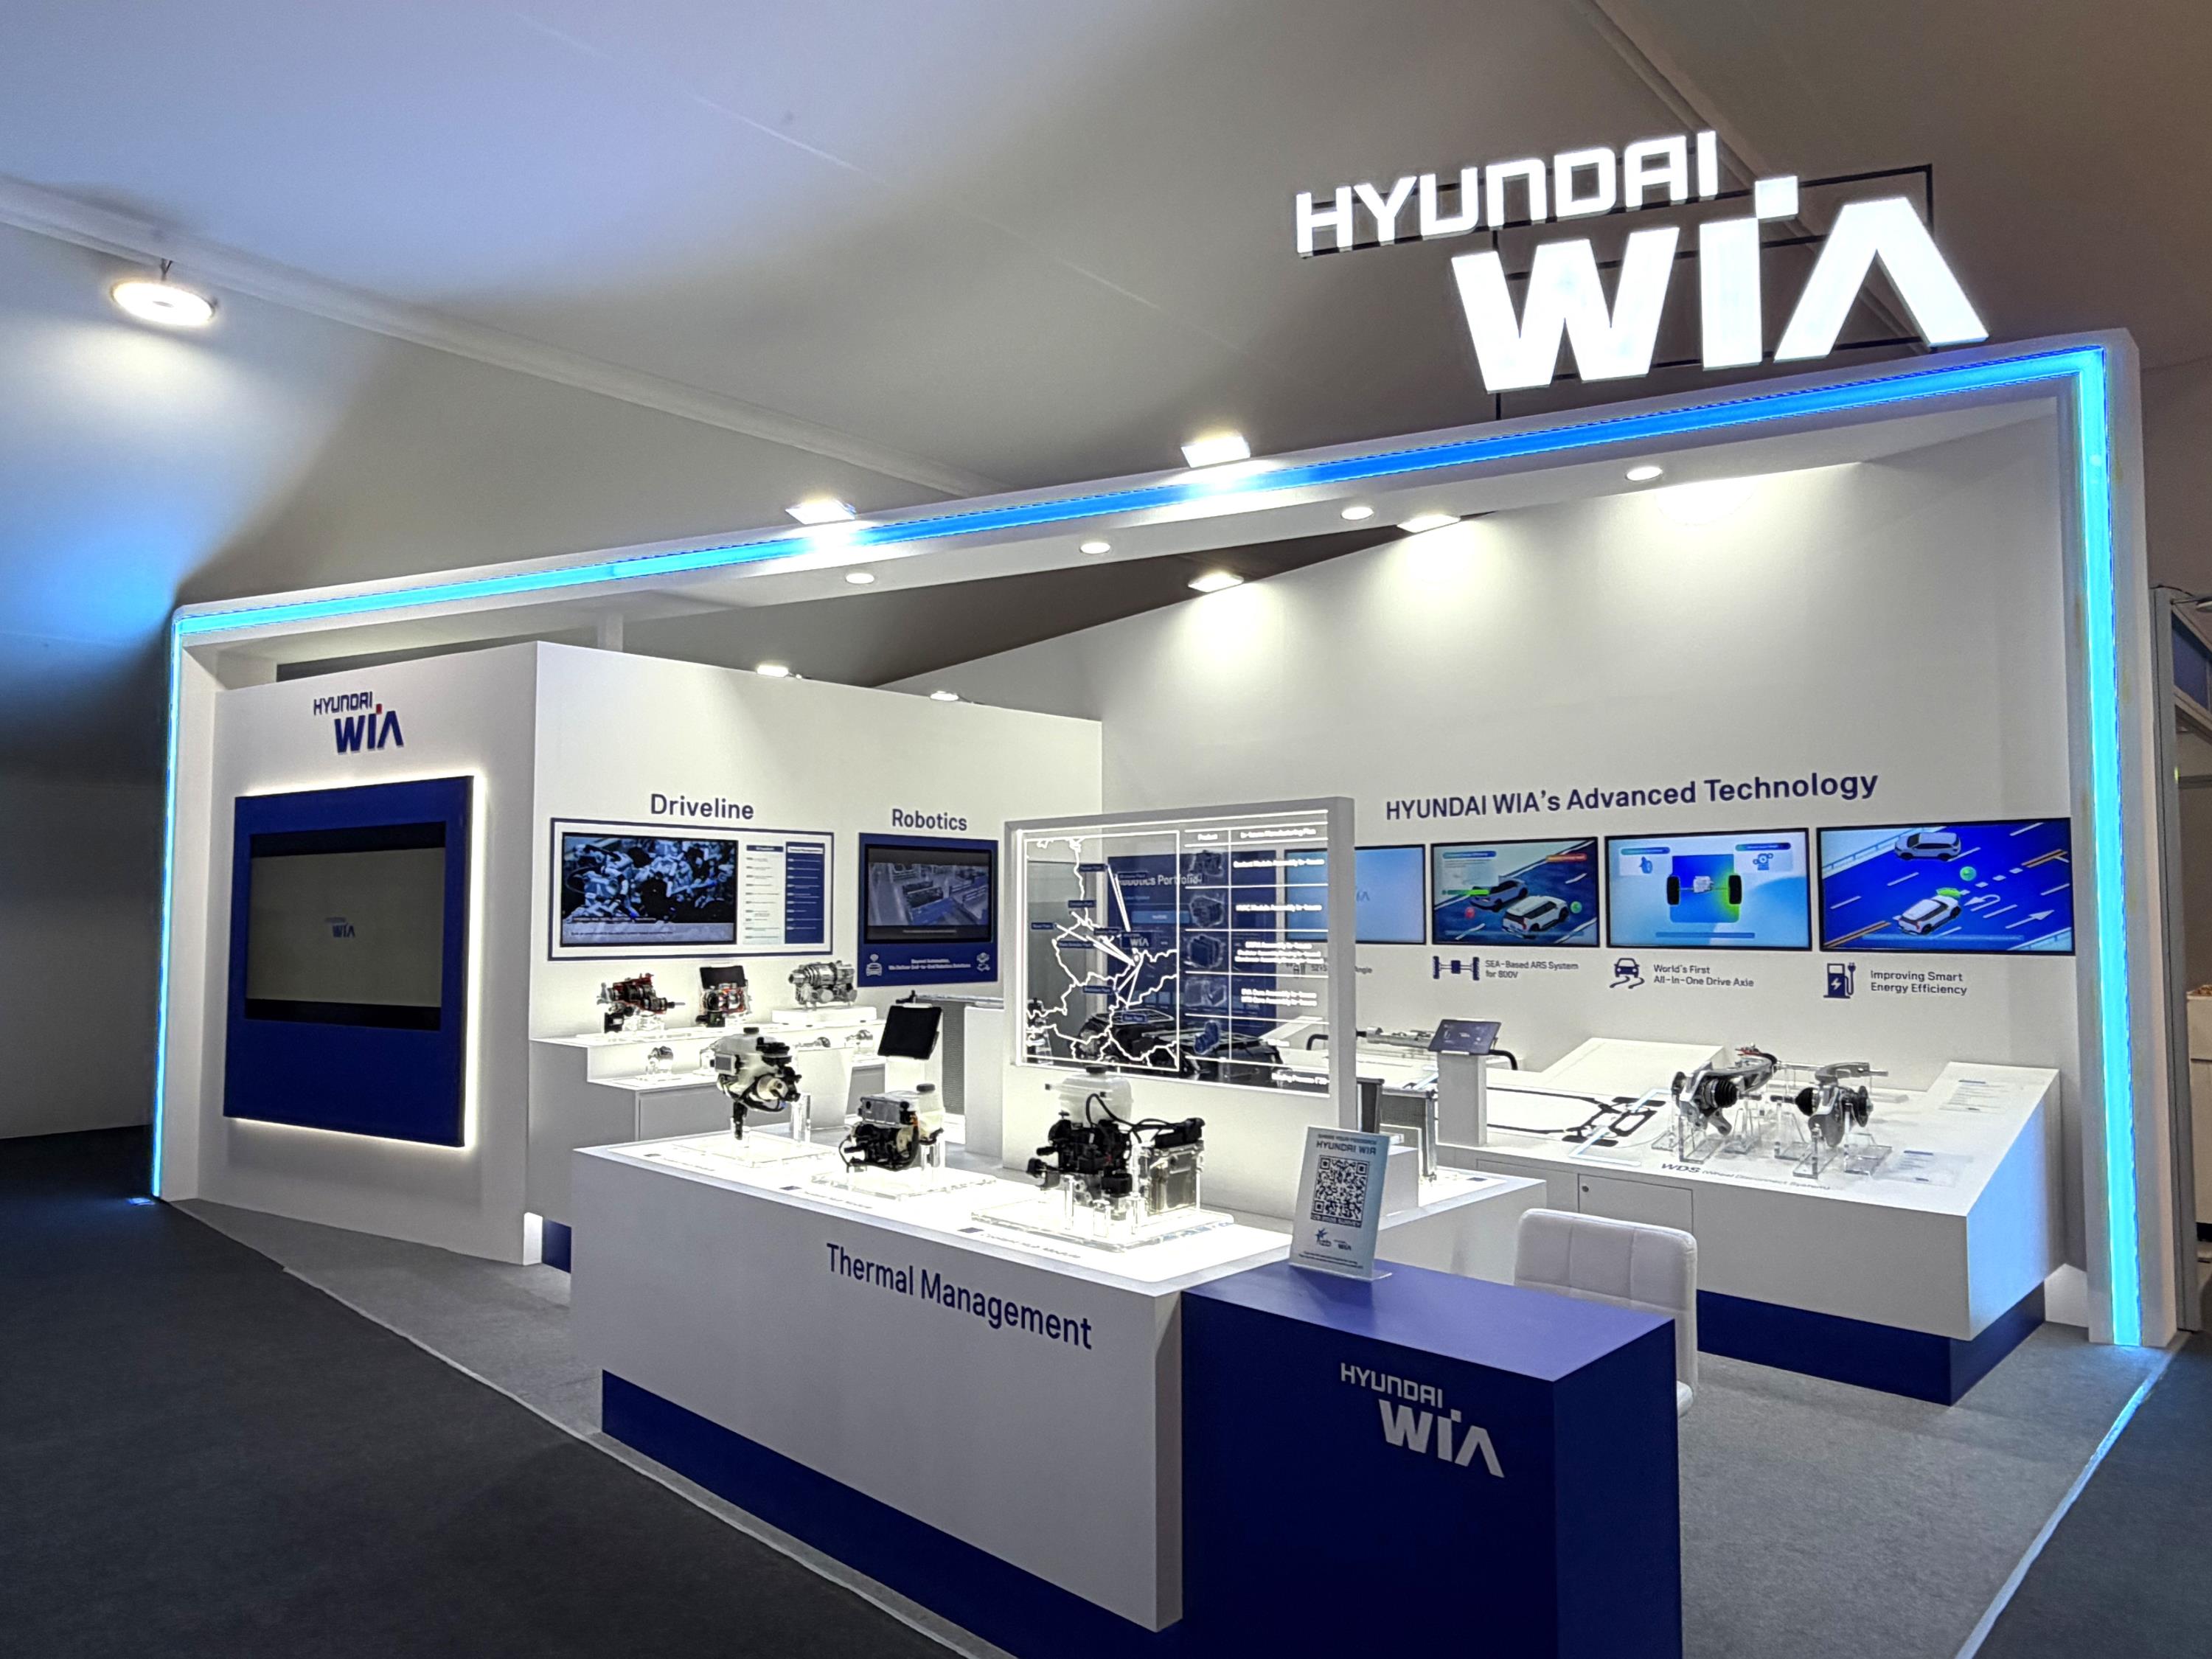
독일 볼프스부르크 알레파크에서 27일(현지시간) 개막한 국제자동차부품전시회 ‘IZB 2026’에 참가한 현대위아의 부스 모습.
현대위아가 열관리 시스템과 차세대 구동 기술로 유럽 완성차 시장 공략에 나선다.
현대위아는 27일(현지 시각) 독일 볼프스부르크 알레파크 전시장에서 개막한 국제자동차부품전시회 'IZB 2026'에서 전동화 차량 부품을 대거 공개했다고 28일 밝혔다. 오는 29일까지 열리는 IZB는 폭스바겐이 주최하는 대규모 자동차 부품 전시회로, 올해는 36개국 858개 업체가 참여한다.
현대위아는 이번 전시회에서 미래 모빌리티 구동과 열관리 분야의 선행 기술을 중점적으로 선보였다. 특히 전비와 공간 효율을 높인 부품을 앞세웠다. 유럽연합(EU)이 2035년까지 자동차에서 발생하는 이산화탄소 배출량을 2021년 대비 90% 감축하는 개정안을 내놓는 등 전동화 기조를 이어가는 점을 공략한 것이다.
현대위아는 이번 전시에서 공조시스템의 핵심 부품인 HVAC(Heating, Ventilation and Air Conditioning Unit)을 선보였다. 이 장치는 외부에서 유입된 공기를 차량 안 상황에 맞는 최적 온도를 만들어 공급해 주는 부품이다. 현대위아는 기존 HVAC보다 높이를 낮춰 공간 활용성과 전비 효율을 높인 ‘슬림 HVAC’도 함께 선보였다.
독일 볼프스부르크 알레파크에서 27일(현지시간) 개막한 국제자동차부품전시회 ‘IZB 2026’에서 참관객들이 현대위아 자동차 부품을 살펴보고 있다.
현대위아는 열관리 핵심 부품인 쿨링모듈도 전시했다. 콘덴서와 라디에이터, 냉각팬 등으로 구성돼 차량 전면부에서 공기와 냉각수를 식혀주는 부품이다. 현대위아는 기존에 따로 배치하던 두 개의 라디에이터를 하나로 통합해 두께와 무게는 줄이고, 배터리와 전력전자(PE·Power Electric) 시스템을 동시에 냉각할 수 있도록 설계했다.
현대위아는 전동화 차량용 차세대 구동 부품인 ‘휠 디스커넥트 시스템(WDS·Wheel Disconnect System)'’도 공개했다. WDS는 필요에 따라 구동축과 바퀴를 분리해 구동력이 불필요하게 낭비되는 것을 줄여주는 부품이다. 현대위아는 아울러 노면 충격과 선회 시 차체가 기울어지는 것을 억제하는 ARS(Active Roll Stabilization)와, 두 개의 등속조인트를 직렬로 연결해 최대 60도의 절각을 구현한 듀얼 등속조인트(Dual C.V.Joint)도 선보였다. 듀얼 등속조인트는 차량의 선회 반경을 줄여 좁은 공간에서 유턴하거나 골목길을 빠져나갈 때 주행을 용이하게 해준다.
현대위아는 이번 전시회를 통해 폭스바겐을 비롯한 유럽 내 완성차 고객사와의 네트워크를 강화하고 수주 기회를 확대한다는 목표다. 현대위아 관계자는 “이번 전시회에서 현대위아의 미래 구동·열관리 기술력을 유럽 시장에 알릴 수 있게 됐다”며 “지속적인 연구개발과 적극적인 영업을 통해 유럽 지역 수주를 확대해 나가겠다”고 말했다.






 미래를 이끄는 현대위아의 기술력
 페이스북
 트위터
 카카오톡


 Youtube
 Instagram
 Blog
 Linkedin
 Facebook













Prompts
Click prompts to add them under the company line, click again to take one out, then copy the result into your AI chat. Shared by Asian Century Stocks and Uncovered Thai Stocks. Thank you.
HYUNDAI WIA (ticker 011210), listed in South Korea.
Copied
ETFs Holding HYUNDAI WIA
Exchange-traded funds whose newest published daily portfolio holds one of the company's listings, largest weight first.
| ETF | Weight in ETF | Shares | Market value | As of |
|---|---|---|---|---|
| AVES | 0.07% | 28,785 | $ 1.051M | Nov 16, 2026 |
| AVEE | 0.06% | 2,062 | $ 75.265K | Nov 16, 2026 |
| AVSE | 0.03% | 1,815 | $ 66.249K | Nov 16, 2026 |
| DFEV | 0.01% | 7,278 | $ 267.499K | Nov 12, 2026 |
| DEXC | 0.01% | 861 | $ 31.646K | Nov 12, 2026 |
| DFEM | 0.01% | 28,535 | $ 1.049M | Nov 12, 2026 |
| DFSE | 0.01% | 1,634 | $ 60.057K | Nov 12, 2026 |
| AVEM | 0.01% | 78,003 | $ 2.847M | Nov 16, 2026 |
| AVXC | 0.01% | 1,251 | $ 45.662K | Nov 16, 2026 |
| DFAE | 0.01% | 13,308 | $ 489.129K | Nov 12, 2026 |
| DFAX | 0.00% | 13,409 | $ 492.841K | Nov 12, 2026 |