본문 바로가기 hyundai 상세 Trendy Hyundai 검색 메뉴 개인 로그인 법인 로그인 KR EN CN 월드와이드 상용글로벌 모델 전체 라인업 보기 구매/이벤트 모델탐색 Trendy Hyundai 내 차 추천받기 모델 비교 사양백과 Pleos Connect 구매 All-in-One 구매 가이드 내 차…
본문 바로가기
hyundai
상세
Trendy Hyundai 검색 메뉴
개인 로그인
법인 로그인
KR
전체메뉴 닫기
[
현대자동차 x 채비 충전 제휴 상품 런칭 2026.05.08 ~ 2026.12.31](https://www.hyundai.com/kr/ko/event/event-hyundai-chaevi-2026)
[
더현대트래블 여행 할인쿠폰 증정 이벤트 2026.06.05 ~ 2026.12.31](https://www.hyundai.com/kr/ko/event/event-bluemembers-the-hyundai-travel-2606)
[
현대차증권 X 현대자동차 제휴 프로모션 출시 이벤트 2026.07.10 ~ 2026.12.11](https://www.hyundai.com/kr/ko/event/event-hyundai-hmsec-2026)
전체메뉴 닫기
[
현대자동차 x 채비 충전 제휴 상품 런칭 2026.05.08 ~ 2026.12.31](https://www.hyundai.com/kr/ko/event/event-hyundai-chaevi-2026)
[
더현대트래블 여행 할인쿠폰 증정 이벤트 2026.06.05 ~ 2026.12.31](https://www.hyundai.com/kr/ko/event/event-bluemembers-the-hyundai-travel-2606)
[
현대차증권 X 현대자동차 제휴 프로모션 출시 이벤트 2026.07.10 ~ 2026.12.11](https://www.hyundai.com/kr/ko/event/event-hyundai-hmsec-2026)
전체메뉴 닫기
[
현대자동차 x 채비 충전 제휴 상품 런칭 2026.05.08 ~ 2026.12.31](https://www.hyundai.com/kr/ko/event/event-hyundai-chaevi-2026)
[
더현대트래블 여행 할인쿠폰 증정 이벤트 2026.06.05 ~ 2026.12.31](https://www.hyundai.com/kr/ko/event/event-bluemembers-the-hyundai-travel-2606)
[
현대차증권 X 현대자동차 제휴 프로모션 출시 이벤트 2026.07.10 ~ 2026.12.11](https://www.hyundai.com/kr/ko/event/event-hyundai-hmsec-2026)
전체메뉴 닫기
[
현대자동차 x 채비 충전 제휴 상품 런칭 2026.05.08 ~ 2026.12.31](https://www.hyundai.com/kr/ko/event/event-hyundai-chaevi-2026)
[
더현대트래블 여행 할인쿠폰 증정 이벤트 2026.06.05 ~ 2026.12.31](https://www.hyundai.com/kr/ko/event/event-bluemembers-the-hyundai-travel-2606)
[
현대차증권 X 현대자동차 제휴 프로모션 출시 이벤트 2026.07.10 ~ 2026.12.11](https://www.hyundai.com/kr/ko/event/event-hyundai-hmsec-2026)
더현대트래블 여행 할인쿠폰 증정 이벤트 2026.06.05 ~ 2026.12.31](https://www.hyundai.com/kr/ko/event/event-bluemembers-the-hyundai-travel-2606)
- [
현대차증권 X 현대자동차 제휴 프로모션 출시 이벤트 2026.07.10 ~ 2026.12.11](https://www.hyundai.com/kr/ko/event/event-hyundai-hmsec-2026)
- [
현대자동차 x 채비 충전 제휴 상품 런칭 2026.05.08 ~ 2026.12.31](https://www.hyundai.com/kr/ko/event/event-hyundai-chaevi-2026)
- [
더현대트래블 여행 할인쿠폰 증정 이벤트 2026.06.05 ~ 2026.12.31](https://www.hyundai.com/kr/ko/event/event-bluemembers-the-hyundai-travel-2606)
- [
현대차증권 X 현대자동차 제휴 프로모션 출시 이벤트 2026.07.10 ~ 2026.12.11](https://www.hyundai.com/kr/ko/event/event-hyundai-hmsec-2026)
- [
현대자동차 x 채비 충전 제휴 상품 런칭 2026.05.08 ~ 2026.12.31](https://www.hyundai.com/kr/ko/event/event-hyundai-chaevi-2026)
- [
더현대트래블 여행 할인쿠폰 증정 이벤트 2026.06.05 ~ 2026.12.31](https://www.hyundai.com/kr/ko/event/event-bluemembers-the-hyundai-travel-2606)
'; htm += '
'; }else{ var link = (data.menuLink)? data.menuLink : '#'; if(link.indexOf('/kr/ko/') == 0 && link.indexOf('/kr/ko/e/') < 0 && editMode){ link = '/content/hyundai' + link + '.html'; } htm += ' '+data.menuName+''; } htm += ''; return htm; } function drawingSubGnb(data, index, dept1Menu, dept2Menu, lnbIndex){ var htm = ''; var link = ''; // 2022.12.06 gnb 개편으로 인한 메뉴 id 변경 // H0200006(이벤트), H0300019(자동차 교환환불제도 안내), H0300020(하자재발 통보서 안내), H0300044(홈투홈 서비스) var noUseMenuForCorp = "H0200006 H0300019 H0300020 H0300044"; // 구매/이벤트 > Shop > 현대 Shop(H0300021), 현대 컬렉션(H0300022) // 서비스/멤버십 > 서비스 네트워크 찾기 > 부품 가격/보유점 조회(H0300038) // 서비스/멤버십 > 전기차 > IONIQ 디지털 오너스 메뉴얼(H0300047) // 브랜드 > 패밀리 사이트 > 현대 모터스튜디오(H0300082), 드라이빙 익스피리언스(H0300083), 고객소통채널 H-ear(H0300084), 현대 컬렉션(H0300088), 채용 홈페이지(H0300140) // 브랜드 > 사업망 > 해외 사업망 소개(H0300090) // 디지털/고객지원 > 업데이트 > 블루링크 스토어 (H0300175) //var externalLinkMenu = "H0300021 H0300022 H0300038 H0300047 H0300082 H0300083 H0300084 H0300088 H0300140 H0300090 H0300145"; // 2022.12.01 현대 모터스튜디오(H0300082) 임시로 닷컴내 페이지로 전환 // 구매/이벤트 > 인증중고차 > 인증중고차 바로가기, 내 차 시세 조회, 트레이드-인 혜택 안내 var externalLinkMenu = "H0300021 H0300022 H0300038 H0300047 H0300076 H0300083 H0300084 H0300088 H0300140 H0300090 H0300145 H0300161 H0300175 H0300177 H0300178 H0300180, H0300188"; if(data.list.length < 1){ return htm; } var dept1Menu = dept1Menu; var dept2Menu = dept2Menu; var lnbIndex = lnbIndex; htm += '
'; $.each(data.list, function(subIndex, item){ if(memberInfo.isCorpMem && noUseMenuForCorp.indexOf(item.menuId) > -1){ return; } // 2022.03.02 현대 Shop sso 링크 적용 if('H0200008' == item.menuId || 'H0300021' == item.menuId){ item.menuLink = 'javascript:goMenuAutoN()'; } link = (item.menuLink)? item.menuLink : '#'; link = link.replace(/^\s+|\s+$/gm, ''); if(link.indexOf('/kr/ko/') == 0 && link.indexOf('/kr/ko/e/') < 0 && editMode){ link = '/content/hyundai' + link + '.html'; } var linkArr = link.split("/"); if(index == 1){ if(item.list && item.list.length > 0){ htm += '
-
'; }else{ // 2022.10.14 마이현대 일경우 1depth에 'on' class 추가 htm += '
-
'; } if(link != '#'){ //htm += ' '+item.menuName+''; htm += ' '+item.menuName+''; htm += ' 자세히 보기'; }else{ htm += ' '+item.menuName+''; } dept1Menu=data.menuName; // sticky menu 여부 체크 if(!setStickyFlag){ // 2023.01.05 1depth 정비/서비스 프로그램이 2depth 올케어맵서비스와 url이 같아 예외처리 if(link == "/kr/ko/service-membership/all-care-service"){ setStickyFlag = false; }else{ // gnb 메뉴 1depth url과 현재페이지 url이 같을 경우 if(linkArr[linkArr.length - 1] == currentPathArr[currentPathArr.length - 1]){ setStickyFlag = true; } } // sticky menu 생성 if(setStickyFlag){ stickyData.gnbTitle = dept1Menu; stickyData.depth1Link = link; stickyData.depth1Title = item.menuName; stickyData.depth1On = true; stickyData.depth2List = item.list; stickyData.depth2On = 0; if(currentLnbIndex == -1){ currentLnbIndex = lnbIndex; } setStickyMenu(stickyData); } } }else if(index == 2){ if(item.list && item.list.length > 0){ htm += '
-
'; htm += ' '+item.menuName+'하위메뉴 버튼'; }else{ if(item.menuId == "H0300184"){ htm += '
-
'; } else{ htm += '
-
'; } htm += ' -1) ? 'class="btn-text btn_link"' : '') + '>'+item.menuName+''; } dept2Menu = data.menuName; // sticky menu 여부 체크 if(!setStickyFlag){ // gnb 메뉴 url과 현재페이지 url이 같을 경우 if(linkArr.length == currentPathArr.length){ if(linkArr[linkArr.length - 1] == currentPathArr[currentPathArr.length - 1]){ setStickyFlag = true; } // gnb 메뉴 url이 현재페이지 url보다 길 경우 }else if(linkArr.length > currentPathArr.length){ if(linkArr[linkArr.length - ((linkArr.length - currentPathArr.length) + 1)] == currentPathArr[currentPathArr.length - 1]){ setStickyFlag = true; } // gnb 메뉴 url 뒤에 추가로 path가 붙는 경우(상세페이지, 스텝별 페이지) }else if(linkArr.length < currentPathArr.length){ /* - gnb에서 각각의 메뉴인 예외 case - 서비스/멤버십 > 서비스 네트워크 찾기 > 서비스 네트워크 소개 /kr/ko/service-membership/service-network/service-network-information /kr/ko/service-membership/service-network/service-network-information/bluehands 서비스/멤버십 > 블루멤버스 > 블루멤버스 포인트 /kr/ko/service-membership/bluemembers/bluemembers-point /kr/ko/service-membership/bluemembers/bluemembers-point/point-saveuse / var sameParentPathCaseArr = new Array(); sameParentPathCaseArr.push("service-network-information"); sameParentPathCaseArr.push("bluemembers-point"); if(sameParentPathCaseArr.indexOf(linkArr[linkArr.length - 1]) < 0){ if(linkArr[linkArr.length - 1] == currentPathArr[currentPathArr.length - ((currentPathArr.length - linkArr.length) + 1)]){ setStickyFlag = true; } } } if(!setStickyFlag){ / - gnb 메뉴 url과 현재 url이 다른 예외 case - 1. 탭 또는 step별 이동으로 url이 바뀌는 case 구매/이벤트 > 정책 안내 > 보증수리 안내 /kr/ko/purchase-event/policy-Information/warranty/normal-period /kr/ko/purchase-event/policy-Information/warranty/gas-part-warranty /kr/ko/purchase-event/policy-Information/warranty/gas-specific-warranty-vehicle /kr/ko/purchase-event/policy-Information/warranty/exclution-of-warranty 구매/이벤트 > 정책 안내 > 하자재발 통보서 안내 /kr/ko/purchase-event/policy-Information/notification-of-defect-recurrence /kr/ko/purchase-event/policy-Information/notification-of-defect-recurrence-form 서비스/멤버십 > 블루멤버스 > 포인트 양도/신청 조회 /kr/ko/service-membership/bluemembers/bluemembers-point/point-over/point-transfer-information /kr/ko/service-membership/bluemembers/bluemembers-point/point-over/point-transfer-application /kr/ko/service-membership/bluemembers/bluemembers-point/point-over/point-transfer-lookup 서비스/멤버십 > 블루멤버스 > 실 운행자 차량 등록 /kr/ko/service-membership/bluemembers/car-register/bluemembers-car-register /kr/ko/service-membership/bluemembers/car-register/bluemembers-rider-register /kr/ko/service-membership/bluemembers/car-register/bluemembers-rider-check 서비스/멤버십 > 정비/서비스 프로그램 > 친환경폐차 /kr/ko/service-membership/car-management-service/eco-scrap-vehicle/introduce /kr/ko/service-membership/car-management-service/eco-scrap-vehicle/request/service-request /kr/ko/service-membership/car-management-service/eco-scrap-vehicle/request/request-completed /kr/ko/service-membership/car-management-service/eco-scrap-vehicle/progress 서비스/멤버십 > 전기차 > IONIQ The Unique 소개 /kr/ko/service-membership/ev/ioniq-the-unique-information /kr/ko/service-membership/ev/ioniq-the-unique-information-members /kr/ko/service-membership/ev/ioniq-the-unique-information-program /kr/ko/service-membership/ev/ioniq-the-unique-information-join 디지털/고객 지원 > App > 현대 디지털 키 1 /kr/ko/digital-customer-support/app/hyundai-digital-key/hyundai-digital-key-information/hyundai-digital-key-information /kr/ko/digital-customer-support/app/hyundai-digital-key/hyundai-digital-key-information/hyundai-digital-key-membership-type /kr/ko/digital-customer-support/app/hyundai-digital-key/hyundai-digital-key-information/hyundai-digital-key-membership-by-member-type /kr/ko/digital-customer-support/app/hyundai-digital-key/nfc-card-key/registration /kr/ko/digital-customer-support/app/hyundai-digital-key/smartphone-app/install-app /kr/ko/digital-customer-support/app/hyundai-digital-key/smartphone-app/car-registration 디지털/고객 지원 > App > 현대 디지털 키 2 /kr/ko/digital-customer-support/app/digital-key-2/digital-key-registration /kr/ko/digital-customer-support/app/digital-key-2/digital-key-sharing /kr/ko/digital-customer-support/app/digital-key-2/digital-key-delete /kr/ko/digital-customer-support/app/digital-key-2/digital-key-touch-door-control /kr/ko/digital-customer-support/app/digital-key-2/digital-key-touch-vehicles-control 브랜드 > 사업망 > 국내 사업망 소개 /kr/ko/brand/business-network/korea/head-office /kr/ko/brand/business-network/korea/factory /kr/ko/brand/business-network/korea/labor /kr/ko/brand/business-network/korea/training /kr/ko/brand/business-network/korea/delivery 서비스/멤버십 > 전기차 > KONA EV 신차구매 충전혜택 /kr/ko/service-membership/ev/kona-ev/new-vehicle-charging-service-members /kr/ko/service-membership/ev/kona-ev/new-vehicle-charging-service-programs /kr/ko/service-membership/ev/kona-ev/new-vehicle-charging-service-join 서비스/멤버십 > 전기차 > 2025 EV 에브리케어 /kr/ko/service-membership/ev/ev-everycare/add /kr/ko/service-membership/ev/ev-everycare/driving /kr/ko/service-membership/ev/ev-everycare/sell-off 서비스/멤버십 > 정비/서비스 프로그램 > 바디케어 서비스 /kr/ko/service-membership/car-management-service/body-care-service /kr/ko/service-membership/car-management-service/body-care-warranty-history /kr/ko/service-membership/car-management-service/body-care-information /kr/ko/service-membership/car-management-service/body-care-terms 브랜드 > 브랜드 스토리 > 브랜드 저널 /kr/ko/brand/brandstory/campaigns-lifestyle 구매/이벤트 > 현대 인증중고차 > 인증중고차 소개 /kr/ko/purchase-event/certified-used-car/hyundai-certified-info /kr/ko/purchase-event/certified-used-car/hyundai-certified-buy /kr/ko/purchase-event/certified-used-car/hyundai-certified-sell /kr/ko/purchase-event/certified-used-car/hyundai-certified-hi-lab 2. gnb 메뉴에 없는 url case 서비스/멤버십 > 서비스 네트워크 찾기 > 서비스 네트워크 소개 > 블루핸즈 소개 /kr/ko/service-membership/service-network/bluehands-information /kr/ko/service-membership/service-network/bluehands-information/franchise-business /kr/ko/service-membership/service-network/bluehands-information/franchise-public-offering /kr/ko/service-membership/service-network/bluehands-information/dedicated-bluehands-settings /kr/ko/service-membership/service-network/bluehands-information/standard-maintenance-time-guide 디지털/고객 지원 > App > 블루링크 > 블루링크 소개 > 서비스 소개 /kr/ko/digital-customer-support/app/bluelink/use-guide/join /kr/ko/digital-customer-support/app/bluelink/bluelink-service/smart-control /kr/ko/digital-customer-support/app/bluelink/bluelink-service/bluelink-safety /kr/ko/digital-customer-support/app/bluelink/bluelink-service/bluelink-vehicle-care /kr/ko/digital-customer-support/app/bluelink/bluelink-service/smart-driving /kr/ko/digital-customer-support/app/bluelink/bluelink-service/music-streaming 디지털/고객 지원 > App > 마이현대 > 카라이프 서비스 > 서비스 소개 /kr/ko/digital-customer-support/app/myhyundai/carlife-service /kr/ko/digital-customer-support/app/myhyundai/carlife-service/service-information /kr/ko/digital-customer-support/app/myhyundai/carlife-service/service-target /kr/ko/digital-customer-support/app/myhyundai/carlife-service/menu-detail-information /kr/ko/digital-customer-support/app/myhyundai/carlife-service/menu-detail-information/visit-car-wash-service /kr/ko/digital-customer-support/app/myhyundai/carlife-service/menu-detail-information/hand-wash-service /kr/ko/digital-customer-support/app/myhyundai/carlife-service/menu-detail-information/chauffeur-opaeration-service /kr/ko/digital-customer-support/app/myhyundai/carlife-service/menu-detail-information/delivery-service /kr/ko/digital-customer-support/app/myhyundai/carlife-service/menu-detail-information/pickup-and-recharge-service 브랜드 > 롱기스트런 /kr/ko/brand/longestrun/information /kr/ko/brand/longestrun/story /kr/ko/brand/longestrun/join-2023-longestrun/challenge /kr/ko/brand/longestrun/join-2023-longestrun/mini-run /kr/ko/brand/longestrun/join-2023-longestrun/final-run /kr/ko/brand/longestrun/event-mypage /kr/ko/brand/longestrun/event-mypage.status 서비스/멤버십 > 전기차 > N브랜드 급속 충전소 /kr/ko/service-membership/ev/n-brand-evsis/benefit /kr/ko/service-membership/ev/n-brand-evsis/use-guide /kr/ko/service-membership/ev/n-brand-evsis/location 디지털/고객지원 > App > 현대셀렉션 /kr/ko/digital-customer-support/app/hyundai-selection/appdownload /kr/ko/digital-customer-support/app/hyundai-selection/monthlysubs /kr/ko/digital-customer-support/app/hyundai-selection/dailysubs /kr/ko/digital-customer-support/app/hyundai-selection/jejusubs /kr/ko/digital-customer-support/app/hyundai-selection/newuserbenefit /kr/ko/digital-customer-support/app/hyundai-selection/longtermbenefit /kr/ko/digital-customer-support/app/hyundai-selection/recommendation /kr/ko/digital-customer-support/app/hyundai-selection/faq /kr/ko/digital-customer-support/app/hyundai-selection/faq/all /kr/ko/digital-customer-support/app/hyundai-selection/faq/regular-pack /kr/ko/digital-customer-support/app/hyundai-selection/faq/special-pack /kr/ko/digital-customer-support/app/hyundai-selection/faq/guide /kr/ko/digital-customer-support/app/hyundai-selection/event */ // url이 다른 예외 case의 sticky menu를 위한 list // 0 : 문자열 비교 type('e'(equals) or 'c'(contains)) // 1 : 현재 url, gnb url에서 비교할 url array의 index // 2 : 현재 url, gnb url에서 비교할 문자열 // 3 : gnb url에서 비교할 url array의 index(gnb 메뉴에 없는 case only) // 4 : gnb url에서 비교할 문자열(gnb 메뉴에 없는 case only) var changePathCaseArr = new Array(); changePathCaseArr.push("e,5,warranty"); changePathCaseArr.push("c,5,notification-of-defect-recurrence"); changePathCaseArr.push("e,6,point-over"); changePathCaseArr.push("e,5,car-register"); changePathCaseArr.push("e,5,eco-scrap-vehicle"); changePathCaseArr.push("c,5,ioniq-the-unique-information"); changePathCaseArr.push("e,5,hyundai-digital-key"); changePathCaseArr.push("e,5,digital-key-2"); changePathCaseArr.push("e,5,korea"); changePathCaseArr.push("e,5,kona-ev"); changePathCaseArr.push("c,5,body-care"); changePathCaseArr.push("e,5,myhyundai"); changePathCaseArr.push("e,5,bluehands-information,6,bluehands"); changePathCaseArr.push("e,5,bluelink,6,bluelink-information"); changePathCaseArr.push("e,6,carlife-service,5,myhyundai"); changePathCaseArr.push("c,5,campaigns"); changePathCaseArr.push("e,4,longestrun,5,event-mypage"); changePathCaseArr.push("e,5,n-brand-evsis"); changePathCaseArr.push("e,5,hyundai-selection"); changePathCaseArr.push("c,5,hyundai-certified"); changePathCaseArr.push("e,5,ev-everycare"); changePathCaseArr.push("e,5,ev-everycare,6,driving"); changePathCaseArr.push("e,5,ev-everycare,6,sell-off"); for(var i = 0; i < changePathCaseArr.length; i ++){ var changePathArr = changePathCaseArr[i].split(","); // 탭 또는 step별 이동으로 url이 바뀌는 case if(changePathArr.length == 3){ if(currentPathArr.length > changePathArr[1] && linkArr.length > changePathArr[1]){ if(changePathArr[0] == "e"){ if((currentPathArr[changePathArr[1]] == changePathArr[2]) && (linkArr[changePathArr[1]] == changePathArr[2])){ setStickyFlag = true; break; } }else{ if((currentPathArr[changePathArr[1]].indexOf(changePathArr[2]) > -1) && (linkArr[changePathArr[1]].indexOf(changePathArr[2]) > -1)){ setStickyFlag = true; break; } } } // gnb 메뉴에 없는 url case }else if(changePathArr.length == 5){ if(currentPathArr.length > changePathArr[1] && linkArr.length > changePathArr[3]){ if(changePathArr[0] == "e"){ if((currentPathArr[changePathArr[1]] == changePathArr[2]) && (linkArr[changePathArr[3]] == changePathArr[4])){ setStickyFlag = true; break; } }else{ if((currentPathArr[changePathArr[1]].indexOf(changePathArr[2]) > -1) && (linkArr[changePathArr[3]].indexOf(changePathArr[4]) > -1)){ setStickyFlag = true; break; } } } } } } // sticky menu 생성 if(setStickyFlag){ var depth1LinkVal = (data.menuLink)? data.menuLink : '#'; depth1LinkVal = depth1LinkVal.replace(/^\s+|\s+$/gm, ''); stickyData.gnbTitle = dept1Menu; stickyData.depth1Link = depth1LinkVal; stickyData.depth1Title = dept2Menu; stickyData.depth1On = false; stickyData.depth2List = data.list; stickyData.depth2On = subIndex; if(currentLnbIndex == -1){ currentLnbIndex = lnbIndex; } setStickyMenu(stickyData); } } }else if(index == 3){ htm += '
-
'; htm += ' '+item.menuName+''; } if(item.list){ //console.log(index+1); htm += drawingSubGnb(item, (index+1), dept1Menu, dept2Menu, lnbIndex); } htm += '
'; }); htm += '
'; return htm; } function drawingModelTab(data, index){ var htm = ''; htm +='
- '; htm +=' '+data.menuName+''; htm +='
'; htm +='
'; htm +='
'; var menuName = data.menuName; $.each(data.list, function(index, item){ if('H0200001' === item.menuId){ htm += drawingModelInfo(item, menuName); }else if('H0200002' === item.menuId){ // 2022.05.06 모델카테고리 구매정보 삭제 // htm += drawingModelResearch(item, menuName); }else if('H0200003' === item.menuId){ htm += drawingModelBuyInfo(item, menuName); } }); htm +='
'; htm += ' 전체메뉴 닫기'; htm +='
'; htm +='
'; htm +='
'; return htm; } function drawingModelBuyInfo(data, menuName){ var htm = ''; var className = ''; htm += '
'; htm += '
'+data.menuName+'
'+data.menuName+'
'; htm += '
'; $.each(data.list, function(index, item){ if('H0300005' === item.menuId){ className = 'link icon_purchase'; }else if('H0300006' === item.menuId){ className = 'link icon_mycar'; }else if('H0300007' === item.menuId){ className = 'link icon_calc'; }else if('H0300008' === item.menuId){ className = 'link icon_gift'; }else if('H0300009' === item.menuId){ className = 'link icon_drive'; }else{ className = ''; } htm += '
'; htm += ' '+item.menuName+''; htm += '
'; htm += '
'; }); htm += '
'; htm += '
'; return htm; } function drawingModelResearch(data, menuName){ var htm = ''; var className = ''; htm += '
'; htm += '
'+data.menuName+'
'+data.menuName+'
'; htm += '
'; $.each(data.list, function(index, item){ if('H0300001' === item.menuId){ className = 'btn ico_searchfilter'; }else if('H0300002' === item.menuId){ className = 'btn ico_mycarsearch'; }else if('H0300003' === item.menuId){ className = 'btn ico_comperison'; }else if('H0300004' === item.menuId){ className = 'btn ico_spac'; }else if('H0300134' === item.menuId){ className = 'btn icon_download'; }else if('H0300006' === item.menuId){ className = 'btn icon_estimation'; }else if('H0300005' === item.menuId){ className = 'btn icon_purchase-consult'; }else if('H0300007' === item.menuId){ className = 'btn icon_installment'; }else if('H0300008' === item.menuId){ className = 'btn icon_monthly-benefit'; }else if('H0300009' === item.menuId){ className = 'btn icon_drive'; }else{ className = ''; } htm += '
'; htm += '
'; return htm; } function drawingModelInfo(data, menuName){ var htm = ''; htm += '
'; // 220923 del //htm += '
'+data.menuName+'
'+data.menuName+'
'; htm += '
'; var isOn = ''; var carTypeLink = ''; $.each(data.carTypeList, function(index, item){ isOn = (index == 0)?'on' : ''; carTypeLink = (item.menuLink && item.menuLink != '' && item.carTypeEngName != 'commercial' && item.carTypeEngName != 'truck' && item.carTypeEngName != 'bus') ? addUrlPrefix(item.menuLink) : 'javascript:void(0)'; htm += '
'; var carLink = ''; $.each(item.repnCarInfos, function(index, subItem){ htm += '
'; if(subItem.customerNewYn == 'Y'){ htm += ' NEW'; // 220530 태그 추가 } carLink = subItem.menuLink; // 2022.07.29 menuLink2 컬럼값이 있으면 menuLink 대신 menuLink2 값으로 사용 // ex) menuLink: "/kr/ko/e/vehicles/ioniq6/intro", menuLink2: "/vehicles/ioniq6/price" // -> '/kr/ko/e' + menuLink2 if(subItem.menuLink2 && subItem.menuLink2 != ''){ if(item.carTypeCode == "T" || item.carTypeCode == "B") carLink = (subItem.menuLink2).includes('/kr/ko/c') ? subItem.menuLink2 : '/kr/ko/c' + subItem.menuLink2; else carLink = (subItem.menuLink2).includes('/kr/ko/e') ? subItem.menuLink2 : '/kr/ko/e' + subItem.menuLink2; } htm += ' ['; htm += '
'; htm += '  '; htm += '
](https://www.hyundai.com/kr/ko/digital-customer-support/notice/news/'+addUrlPrefix(carLink)+') '; htm += ' '+subItem.carName+' '; if(subItem.carLowPrice == '0'){ htm += ' - '; }else if(subItem.carLowPrice == '1'){ htm += ' 가격 추후 공개 '; }else if(subItem.carLowPrice == '2'){ // 2 입력 시, 가격 영역 비노출 처리 }else{ htm += ' '+changedRate(subItem.carLowPrice)+'만원 '; } // N Line 로고 추가 2023.07.06 if(subItem.customerNLineYn == 'Y'){ htm += '
N line포함
'; } htm += ' '; // 2022.07.21 customerCarDtlYn 값이 N이면 자세히보기 링크 숨기기 if('Y' == subItem.customerCarDtlYn){ htm += ' 자세히 보기 '; } if('Y' == subItem.customerEstimationYn){ if(item.carTypeCode == "T" || item.carTypeCode == "B") { // 트럭 or 버스 면 url 다름 var carnCd = subItem.carCode.substr(0,2); var carnNo = subItem.carCode.substr(2,2); htm += ' 내 차 만들기'; } else { htm += ' 내 차 만들기'; } } htm += ' '; htm += '
'; htm += '
'; }); htm += '
'; htm += '
'; }); /* htm += '
- '; htm += ' 트럭&버스 '; htm += '
'; htm += '
'; htm += '
'; htm += '
'; htm += ' 트럭 & 버스 '; htm += ' Partner in Every Way '; htm += '
'; htm += ' 고객과 함께 성장하는 비즈니스 파트너, 현대 상용차는 고객의 깊은 안목과
고객의 비즈니스를 이해하고 함께하기 위해 노력합니다.'; htm += '
'; htm += ' 대형 상용 차량에 대한 정보는 해당 홈페이지에서 조회해 주시기 바랍니다. '; htm += ' 현대 트럭&버스 홈페이지로 바로가기'; htm += '
'; htm += '
'; htm += '
'; htm += '
'; */ htm += '
'; htm += '
'; htm += '

'; htm += '
'; htm += ' GENESIS '; // htm += ' The journey begins '; htm += '
'; htm += ' 제네시스라는 이름에는 열망의 창조,
'; htm += ' 새로운 시작과 긍정적인 변화를 향한 우리의 염원이 담겨 있습니다.'; htm += '
'; htm += ' 제네시스 차량에 대한 정보는 해당 홈페이지에서 조회해 주시기 바랍니다. '; htm += ' 제네시스닷컴 바로가기'; htm += '
'; htm += '
'; htm += '
'; htm += '
'; htm += '
- '; htm += ' CASPER '; htm += '
'; htm += '
'; htm += '

'; htm += '
'; htm += ' CASPER '; // htm += ' The journey begins '; htm += '
'; htm += ' case by CASPER
캐스퍼가 새로운 케이스를 만든다.'; htm += '
'; htm += ' 캐스퍼 차량에 대한 정보는 해당 홈페이지에서 조회해 주시기 바랍니다. '; htm += ' 캐스퍼 온라인 바로가기'; htm += '
'; htm += '
'; htm += '
'; htm += '
'; htm += '
'; htm += '
'; return htm; } function drawingEventBanner(data){ var htm = ''; htm +='
'; htm +='
'; $.each(data, function(index, item){ if(index > 2){ return false; } htm +='
'; htm +=' ['; htm +='
'; htm +=' '; htm +='
'; htm +=' ' + item.eventTitle + ''; htm +=' ' + (item.eventStartDate).substring(0, 10).replaceAll('-', '.') + ' ~ ' + (item.eventEndDate).substring(0, 10).replaceAll('-', '.') + ''; htm +='
'; htm +='](https://www.hyundai.com/kr/ko/digital-customer-support/notice/news/' + ComUtils.getServerURL(item.eventDetailUrl) + ')'; htm +='
'; }); htm +='
'; htm +='
'; return htm; } function drawingMobileEventBanner(data){ var htm = ''; htm += '
'; htm += '
'; htm += '
'; $.each(data, function(index, item){ if(index > 2){ return false; } htm += '
'; htm += ' ['; htm += '
'; htm += ' '; htm += '
'; htm += ' ' + item.eventTitle + ''; htm += ' ' + (item.eventStartDate).substring(0, 10).replaceAll('-', '.') + ' ~ ' + (item.eventEndDate).substring(0, 10).replaceAll('-', '.') + ''; htm += '
'; htm += '](https://www.hyundai.com/kr/ko/digital-customer-support/notice/news/' + ComUtils.getServerURL(item.eventDetailUrl) + ')'; htm += '
'; htm += '
'; }); htm += '
'; htm += '
'; htm += '
'; htm += '
'; htm += '
- '; htm += ' '; htm += '
'; htm += '
'; htm += '
'; htm += '
'; const moEventUl = document.querySelector('.mv_ev_le_dev') moEventUl.innerHTML = htm; const $slide = $( '.gnb_events.mo_only .slide' ); $slide.ixSlideMax(); $( window ).on( 'resize', function(e) { $slide.ixSlideMax( 'resize' ); }); } function addUrlPrefix(url){ return url; // return url.replace("/vehicles/","/kr/ko/e/vehicles/"); } function changedRate(str){ str = str.replace(/0000$/,''); return str.toString().replace(/\B(?=(\d{3})+(?!\d))/g, ","); } function getDefaultGnb(){ var htm = ''; return htm; } function checkUrlForm(strUrl) { var expUrl = /^http[s]?:///i; return expUrl.test(strUrl); } // s: 250211 add function goBlueLinkStore(){ const param = {}; param.link = autoNConfig.blueLinkStore; // + pageInfo; const { pc, mobile } = param.link window.open(pc); } //e: 250211 add function goGnbAutoN(){ var param = {}; var pageInfo = "gnb"; param.keyNm = autoNConfig.keyNm; param.selectorNm = autoNConfig.selectorNm; param.link = autoNTarget.hyundaiShop; // + pageInfo; param.shopLink = autoNTarget.shopLink; window.open(param.link); //ComUtils.goAutoN(param); } function goMenuAutoN(){ var param = {}; //var pageInfo = "menu"; param.keyNm = autoNConfig.keyNm; param.selectorNm = autoNConfig.selectorNm; //param.link = autoNTarget.hyundaiShop + pageInfo; param.link = autoNTarget.hyundaiShop; param.shopLink = autoNTarget.shopLink; window.open(param.link); //ComUtils.goAutoN(param); } function setStickyMenu(stickyData){ var depth1On = false; var depth1LinkArr = stickyData.depth1Link.split("/"); depth1On = stickyData.depth1On; var stickyHtml = ''; if(stickyData.depth1Link == "#"){ stickyHtml += '' + stickyData.depth1Title + ''; }else{ stickyHtml += '[' + stickyData.depth1Title + '](https://www.hyundai.com/kr/ko/digital-customer-support/notice/news/' + stickyData.depth1Link + ')'; } stickyHtml += '
'; $.each(stickyData.depth2List, function(index, item){ var depth2Title = item.menuName; var depth2Link = (item.menuLink)? item.menuLink : '#'; depth2Link = depth2Link.replace(/^\s+|\s+$/gm, ''); if(depth2Link.indexOf('/kr/ko/') == 0 && depth2Link.indexOf('/kr/ko/e/') < 0 && editMode){ depth2Link = '/content/hyundai' + depth2Link + '.html'; } var depth2On = false; if(!depth1On){ depth2On = (index == stickyData.depth2On) ? true : false; } stickyHtml += '
'; $("div.scroll_depth ul.depth1 li").html(stickyHtml); }
Trendy Hyundai
KR
로그인
전체 메뉴
검색창 닫기
'; carHtm += ' '+item.keyword+''; carHtm += ' '; carHtm += ' '; carHtm += ''; } mHtm += ''; mHtm += '
- '; if(item.linkurl != ''){ mHtm += ' ['; mHtm += '
'+item.keyword+'
'; mHtm += ' 바로가기'; mHtm += '](https://www.hyundai.com/kr/ko/digital-customer-support/notice/news/'+linkurl+')'; }else{ mHtm += ' '; mHtm += '
'+item.keyword+'
'; mHtm += ''; } mHtm += '
'; }); $('#autoKeyword').html(htm); $('#autoKeywordPrd').html(carHtm); $('#autoKeywordM').html(mHtm); } } }// success end }); // ajax end //자동환성 리스트 highlight 그리기 // _public.setAutocompleteList( autoCompleteWord, keyword ); // {Array}keywordList - 키워드 리스트, {String}searchWord - 검색어 } //인기 검색어 function setPopularKeyword(){ var htm1 = ''; var htm2 = ''; $.ajax({ type: "POST", url : "/wsvc/kr/ws/rest/eplatform/search.sla.do", beforeSend: function(){ //hmc.loading.open(); }, complete: function(){ //hmc.loading.close(); }, success: function(resData){ if(resData.data){ if('0000' === resData.data.rspStatus.rspCode){ if(!resData.data.data[0].Query){ htm1 += '
인기 검색어
'; }else{ htm1 += '
인기 검색어 Top'+resData.data.data[0].Query.length+'
'; $.each(resData.data.data[0].Query, function(index, item){ htm1 += '
'+(index + 1)+'위. '+item.content+'
'; htm2 += '
- '; htm2 += ' '; htm2 += ' '+(index+1)+'위. '+item.content+''; htm2 += ''; htm2 += '
'; }); } $('#pupularKeyword').html(htm1); $('#pupularKeywordM').html(htm2); } } }// success end }); // ajax end } //최근 검색어 function setRecentKeyword(){ var html = ''; var mHtml = ''; var recentArr = localStorage.getItem('search-recent') != null ? JSON.parse(localStorage.getItem('search-recent')) : []; html += '
최근 검색어
'; if(typeof(recentArr) != 'string' && recentArr.toString() != '' ){ $.each(recentArr, function(index, item){ html += '
'; html += ' '+item; html += ''; html += ' 검색어삭제'; html += '
'; }); $.each(recentArr, function(index, item){ mHtml += '
- '; mHtml += ' '; mHtml += ' '+item+''; mHtml += ''; mHtml += ' '; mHtml += '
'; }); } $('#recent_keyword').html(html); $('.tabContents div[data-id="recentKeyword"] .m-tab__list').html(mHtml); } // 2) 최근검색어 저장 (검색시) function fnSetRecentList(keyword) { var recentArr = localStorage.getItem('search-recent') != null ? JSON.parse(localStorage.getItem('search-recent')) : []; if (recentArr) { //console.log('401 -->'); var isInclude = false; for(var i=0; i'; htm += ' '+gnbRandomBanner.bannerText+''; htm += '
'; htm += '
'; htm += ' KR'; htm += '
'; htm += '
'; // 2022.11.18 한국어 사이트에서 KR 제외 //htm += '
- KR
'; htm += '
- EN
'; htm += '
- CN
'; htm += '
- 월드와이드
'; htm += '
- 상용글로벌
'; htm += '
'; htm += '
'; htm += '
'; htm += '
'; // 로그인/마이페이지 영역 if(memberInfo.memberType){ htm += '
'; htm += ' 마이페이지'; htm += '
'; htm += '
'; htm += '
'; htm += '
'; htm += '
'; $("#hmc_header").data("login", "1"); $("#hmc_header").data("time", $.now()); }else{ htm += '
'; htm += ' 로그인'; htm += '
'; htm += '
'; htm += '
'; htm += '
'; htm += '
'; $("#hmc_header").data("login", "0"); } htm += '
'; // s: add 221024 htm += '
전체 메뉴
'; // e: add 221024 $('#header-menu-pc').html(htm); var htmMobile = ''; if(memberInfo.memberType){ if(memberInfo.corpType === '1' || memberInfo.corpType === '2'|| memberInfo.corpType === '3'){ htmMobile += '
[법인 페이지](https://www.hyundai.com/kr/ko/digital-customer-support/notice/news/'+ComUtils.getServerURL()
'; }else{ htmMobile += '
[마이페이지](https://www.hyundai.com/kr/ko/digital-customer-support/notice/news/'+ComUtils.getServerURL()
'; } htmMobile += '
'; htmMobile += ' '; htmMobile += ' 로그아웃'; htmMobile += ' '; htmMobile += '
'; $("#hmc_header").data("login", "1"); $("#hmc_header").data("time", $.now()); }else{ htmMobile += '
'; htmMobile += ' 개인 로그인'; htmMobile += '
'; htmMobile += '
'; htmMobile += ' [법인 로그인](https://www.hyundai.com/kr/ko/digital-customer-support/notice/news/'+ComUtils.getServerURL()'; htmMobile += '
'; $("#hmc_header").data("login", "0"); } htmMobile += '
'; htmMobile += ' KR'; htmMobile += '
'; htmMobile += '
'; // 2022.11.18 한국어 사이트에서 KR 제외 //htmMobile += '
- KR
'; htmMobile += '
- EN
'; htmMobile += '
- CN
'; htmMobile += '
- 월드와이드
'; htmMobile += '
- 상용글로벌
'; htmMobile += '
'; htmMobile += '
'; htmMobile += '
'; $('#header-menu-mobile').html(htmMobile); var currentPath = window.location.pathname; var currentPathArr = currentPath.split("/"); if(currentPathArr.length > 3 && currentPathArr[3] == "mypage"){ $('div.scroll_depth').hide(); } } function setGnbBannerUrl(){ var bannerlink = new Array(); // bannerlink[0] = "https://www.hyundai.com/kr/ko/e/vehicles/eco-incentive?utm_source=hyundaicom&utm_medium=display&utm_campaign=2023_quickwin&utm_content=gnb_util"; // bannerlink[1] = "https://www.hyundai.com/kr/ko/brand/longestrun/information"; bannerlink[0] = "https://www.hyundai.com/kr/ko/e/vehicles/explorer?utm_source=homepage&utm_medium=gnb&utm_campaign=find_mycar"; bannerlink[1] = "https://www.hyundai.com/kr/ko/e/service-membership/ev/hi-ev"; bannerlink[2] = "https://www.hyundai.com/kr/ko/e/vehicles/eco-incentive?utm_source=hyundaicom&utm_medium=display&utm_campaign=2023_quickwin&utm_content=gnb_util"; bannerlink[3] = "https://www.hyundai.com/kr/ko/e/vehicles/trendy-hyundai"; bannerlink[4] = "https://www.hyundai.com/kr/ko/e/vehicles/spec-dictionary?carCode=GN11"; var bannerTitle = new Array(); // bannerTitle[0] = "전기 · 수소차 보조금 조회"; // bannerTitle[1] = "롱기스트 런 바로가기 "; bannerTitle[0] = "내 차 추천받기"; bannerTitle[1] = "Hi, EV"; bannerTitle[2] = "전기 · 수소차 보조금 조회"; bannerTitle[3] = "Trendy Hyundai"; bannerTitle[4] = "사양백과"; var bannerText = new Array(); // bannerText[0] = "전기 · 수소차 보조금 조회"; // bannerText[1] = "롱기스트 런 바로가기"; bannerText[0] = "내 차 추천받기"; bannerText[1] = "Hi, EV"; bannerText[2] = "전기 · 수소차 보조금 조회"; bannerText[3] = "Trendy Hyundai"; bannerText[4] = "사양백과"; var bannerDataName = new Array(); // bannerDataName[0] = "전기 · 수소차 보조금 조회"; // bannerDataName[1] = "롱기스트 런 바로가기"; bannerDataName[0] = "내 차 추천받기"; bannerDataName[1] = "Hi, EV"; bannerDataName[2] = "전기 · 수소차 보조금 조회"; bannerDataName[3] = "Trendy Hyundai"; bannerDataName[4] = "사양백과"; var ranNum=Math.floor(Math.random()*bannerTitle.length); gnbRandomBanner.bannerlink = bannerlink[ranNum]; gnbRandomBanner.bannerTitle = "새창열기"; //bannerTitle[ranNum]; gnbRandomBanner.bannerText = bannerText[ranNum]; gnbRandomBanner.bannerDataName = bannerDataName[ranNum]; $('#gnb_top_Banner').attr({href : bannerlink[ranNum], title: bannerTitle[ranNum]}); $('#gnb_top_Banner').attr("data-link-name", bannerDataName[ranNum]); $('#gnb_top_Banner').html(bannerText[ranNum]); } function isLoginAvailable(){ var retVal = false; if($("#hmc_header").data("login")){ var startTime = $("#hmc_header").data("time"); var now = $.now(); var isTerm = parseInt((now - startTime)/ 60000); if(isTerm > 30){ var url = '/wsvc/kr/session.islogin.do'; var param = {} var result = ComUtils.callAjax(url, param); if(result){ retVal = result.data.login; } } else retVal = true; } return retVal; } function recallCheck() { if(!memberInfo.memberType){ return false; } if(localStorage.getItem('recallPopUpConfirm') != null){ var recall = JSON.parse(localStorage.getItem('recallPopUpConfirm')); var recallYn = recall.recallYn; var checkYn = recall.checkYn; if(recallYn == 'Y'){ var confirmTime = (ComUtils.isEmpty(recall.confirmTime)) ? '': ComUtils.toDate(recall.confirmTime); var currentTime = new Date(); if(confirmTime == ''){ drawRecallPopup(); return false; } if(checkYn == 'Y' && confirmTime.getTime() > new Date(currentTime.setDate(currentTime.getDate()-1)).getTime()){ return false; }else{ drawRecallPopup(); } } }else{ var data = {}; var url = ''; if(memberInfo.memberType.substring(0,1) == '2'){ url = '/wsvc/kr/ws/rest/eplatform/user/recall.memberRecall.do'; data = {mbrMbno : memberInfo.memberUID, mbrNm : memberInfo.name}; }else if(memberInfo.memberType.substring(0,1) == '3'){ url = '/wsvc/kr/ws/rest/eplatform/user/recall.corpMemberRecall.do'; data = {bizrRgno : memberInfo.bizrRgno}; } $.ajax({ type: 'POST' , contentType: 'application/json; charset=utf-8', data : JSON.stringify(data), url: url, success: function(data) { if(data.resultCode == '0000'){ if(data.result.recallYn){ if(data.result.recallYn == 'Y'){ drawRecallPopup(); }else if(data.result.recallYn == 'N'){ saveRecallInfo('N', 'N', ''); } } }else if(data.resultCode == '9995'){ saveRecallInfo('N', 'N', ''); } } }); } } function drawRecallPopup(){ var popupContent = '
' + '
코나 일렉트릭 SOC 설정 고객 안내
' + '
' + '
코나 일렉트릭 고객님께 안내 드립니다.
' + '현대자동차는 올해 3월부터 고객님 차량 운행에 지장을 줄 수 있는 가능성을 사전에 방지하기 위해
' + '자발적 리콜 조치를 실시하고 있습니다.
' + '부품 수급 일정으로 인해 리콜조치(고전압 배터리 교환)까지 일정기간 소요가 예상되는바,
' + '배터리 교체 전까지는 배터리 충전율을 90%로 설정해주시기를 권고 드립니다.
' + '배터리 충전율 설정은 블루링크 앱 또는 차량 내에서 가능합니다.
' + '현대자동차는 앞으로도 고객님의 안전을 위해 최선을 다하겠습니다.
' + '문의사항이 있으신 경우 현대자동차 고객센터(02-3488-0010)로 연락 주시기 바랍니다.
' + '※ 블루링크 앱을 활용한 배터리 설정 충전 방법' + '
' + '
' + '' + '오늘 하루 다시 보지 않기' + '
' + '
' + '
' + '확인' + '
' + '
'; var modal = hmc.modal.open( popupContent, { sizeType: 'L' }).addListener( 'modal-close', function (e) { var recallYn = ''; var checkYn = ''; var confirmTime = ComUtils.dateFormat(new Date(),'yyyyMMddhhmmss'); if($modalEl.find('#check1').prop('checked')){ recallYn = 'Y'; checkYn = 'Y'; }else{ recallYn = 'Y'; checkYn = 'N'; } saveRecallInfo(recallYn, checkYn, confirmTime); }); var $modalEl = modal.getElement(); $modalEl.find('.recall_popup_close_btn').on('click', function (e) { modal.close(); }); } function saveRecallInfo(in_recallYn, in_checkYn, in_confirmTime){ var recallPopupConfirm = { recallYn : in_recallYn, checkYn : in_checkYn, confirmTime : in_confirmTime }; localStorage.setItem('recallPopUpConfirm',JSON.stringify(recallPopupConfirm)); } function getNowDate(){ var toDay = null; var param = {}; param.fromat = 'yyyyMMddHHmmss'; $.ajax({ type : 'get', async: false, url : '/wsvc/kr/front/common/utils.getNowDate.do', data : param, success : function(data) { console.log(data); if(data.resultCode == '0000' && data.data.length == 14){ console.log("data.data : ", data.data); var dateArr = /(\d{4})(\d{2})(\d{2})(\d{2})(\d{2})(\d{2})/.exec(data.data); toDay = new Date(dateArr[1],(dateArr[2] - 1),dateArr[3],dateArr[4],dateArr[5],dateArr[6]); return toDay; }else{ console.log('I/F ERROR'); toDay = new Date(); return toDay; } } }); return toDay; } function drawSystemErrorPopup(){ var now = getNowDate(); var nowStr = now.getHours() + ':' + now.getMinutes(); now.setMinutes(now.getMinutes() + 30); var toStr = now.getHours() + ':' + now.getMinutes(); var popupContent = '' + '
' + '
시스템 공지사항
' + '
' + '
시스템 오류가 발생하여 조치 중입니다.
' + '
' + ' ' + ' 조치 예상시간' + ' 30분 (' + nowStr +' ~ ' + toStr+ ')' + '' + '
' + '
조치가 완료되면 재공지 드리겠습니다.
' + '
' + '
' ; var modal = hmc.modal.open( popupContent, { sizeType: 'M' }); var $modalEl = modal.getElement(); $modalEl.find('.recall_popup_close_btn').on('click', function (e) { modal.close(); }); }
홈 디지털/고객지원 공지/뉴스 뉴스 상세
뉴스
현대자동차의 최신뉴스를 신속하게 알려 드립니다.
현대자동차, 글로벌 브랜드 가치 250억 달러 달성
기타/마케팅 2026.10.28
인쇄
이전 슬라이드 썸네일 보기 다음 슬라이드 썸네일 보기
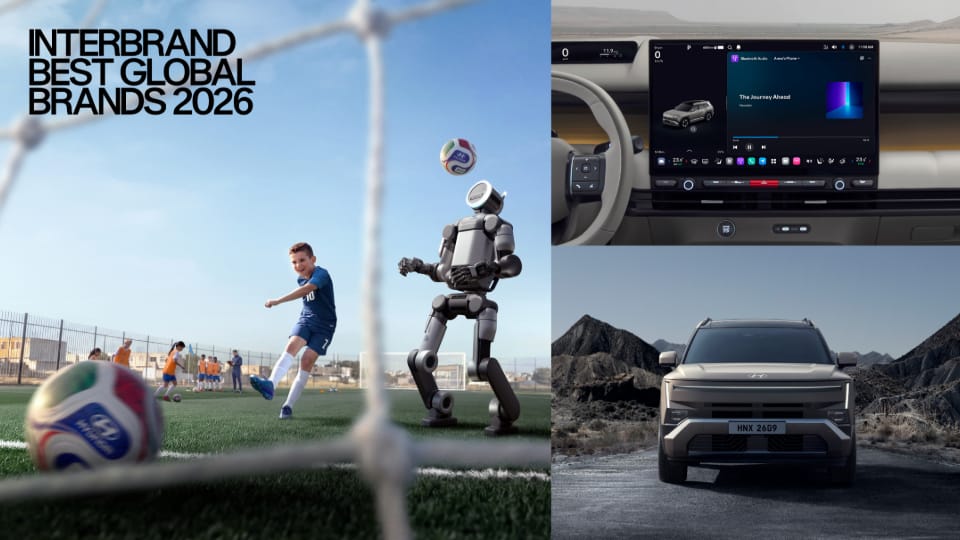
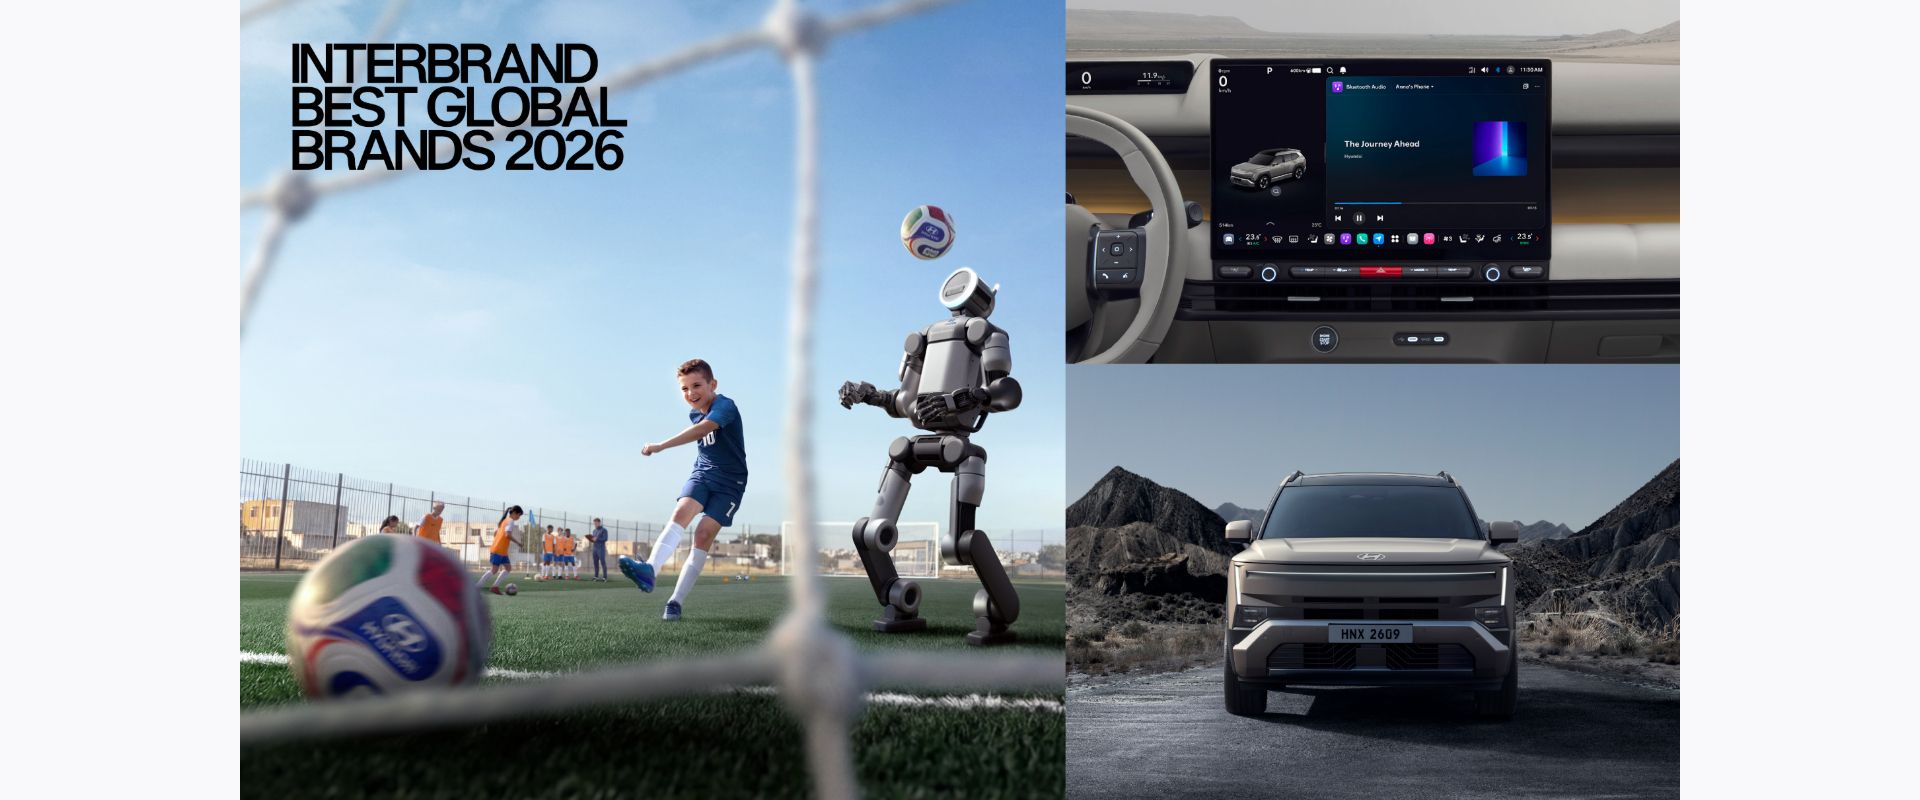
현대자동차는 글로벌 브랜드 컨설팅 업체 '인터브랜드(Interbrand)'가 발표한 '2026 글로벌 100대 브랜드(Best Global Brands 2026)'에서 브랜드 가치 250억 달러를 기록하며 종합 브랜드 순위 29위에 올랐다고 28일(수) 밝혔다.
세계적으로 권위를 인정받는 브랜드 컨설팅 업체 인터브랜드는 매년 전 세계 주요 브랜드의 가치 평가를 시행해 글로벌 100대 브랜드를 선정한다.
2005년 처음으로 글로벌 100대 브랜드에 이름을 올린 현대차는 녹록지 않은 환경 속에서도 2010년부터 올해까지 17년 연속 브랜드 가치를 상승시키는 대기록을 이어갔다.
특히 다른 자동차 브랜드들이 실적 둔화로 가치 하락세를 보인 가운데, 현대차는 창사 이래 최초로 종합 순위 20위권에 진입하며 독보적인 저력을 보였다. 자동차 브랜드 부문에서도 전년 대비 두 계단 상승한 4위를 기록했다.
인터브랜드 관계자는 "현대차는 로보틱스와 전동화 등 미래 모빌리티 기술에서 실질적인 경쟁력을 입증하며 브랜드의 차별성과 신뢰를 강화했다"며 "이러한 성과가 미국, 유럽 등 주요 시장의 견고한 브랜드 기반과 맞물려 브랜드 가치 상승의 주요 동력이 됐다"고 밝혔다.
현대차는 불확실한 경영 환경 속에서도 지속된 사업 경쟁력과 실적 성장을 바탕으로 브랜드 가치를 높였다. 지난해 매출 186조 2,545억 원의 사상 최대 실적을 달성했으며, 하이브리드 라인업 확대에 힘입어 미국 시장 연간 100만 대 판매와 글로벌 친환경차 96만 대 판매를 동시에 돌파했다.
전동화 플래그십 SUV 아이오닉 9은 2026 세계 여성 올해의 차(Women's Worldwide Car of the Year, WWCOTY)에서 최고의 대형 SUV(World's Best Large SUV) 부문을 수상했고, 팰리세이드는 2026 북미 올해의 차(North American Car, Truck and Utility Vehicle of the Year, NACTOY) 유틸리티 부문에서 최종 1위를 차지해 뛰어난 제품 경쟁력을 선보였다.
아울러 투싼 하이브리드는 2025년 글로벌 하이브리드 판매 확대를 견인하고 2026년 1분기 하이브리드 역대 최대 분기 판매에 기여해 친환경차 성장의 핵심 모델로 자리매김했다. 여기에 지난 9월 공개된 '디 올 뉴 투싼'은 차세대 하이브리드 시스템을 탑재하며 글로벌 SUV 시장에서의 입지를 더욱 넓히고 있다.
현대차는 완성차 제조를 넘어 피지컬 AI와 로보틱스 등 미래 성장 동력 확보에도 속도를 내고 있다.
지난 1월 현대차그룹은 CES 2026에서 인간 중심 AI 로보틱스 생태계 전략과 중장기 사업화 계획, 기술 실증을 공개하며 현대차 미래 사업 경쟁력을 입증했다. 이를 바탕으로 현대차 시가총액은 사상 처음으로 100조 원을 넘어섰다.
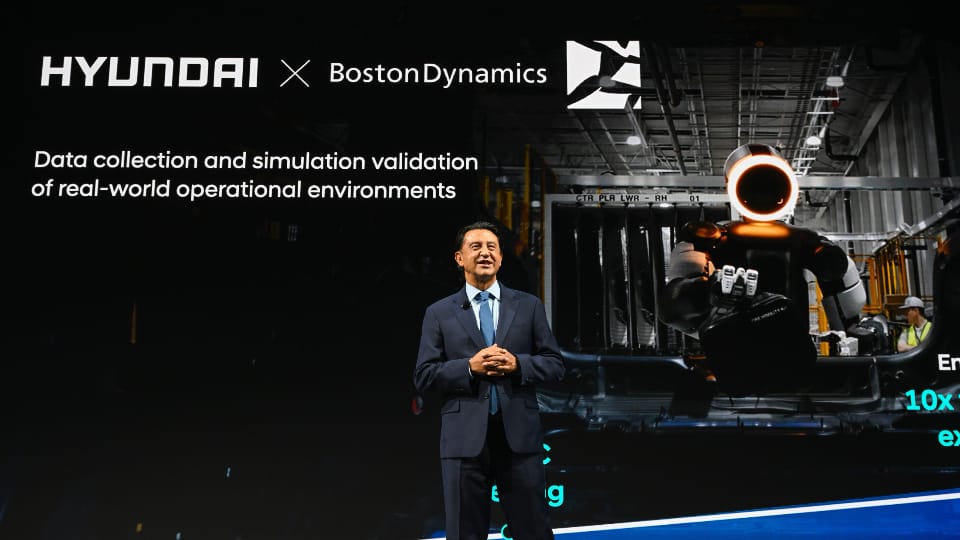
로보틱스 분야에서는 미국 조지아주 현대차그룹 메타플랜트 아메리카(HMGMA) 내 로보틱스 메타플랜트 응용 센터(Robotics Metaplant Application Center, RMAC)에서 휴머노이드 로봇 아틀라스(Atlas)가 훈련을 시작하며 2028년 HMGMA 투입 준비를 본격화했다.
특히 아틀라스는 글로벌 IT 전문 매체 CNET이 선정하는 Best of CES 2026에서 최고 로봇(Best Robot)상을 받았고, 차세대 자율주행 모빌리티 로봇 플랫폼 모베드(MobED)는 CES 2026 로보틱스 부문 최고혁신상(Best of Innovation Awards)과 레드닷 디자인 어워드(Red Dot Design Award) 제품 디자인 부문 본상을 잇달아 거머쥐며 그룹의 로보틱스 기술력과 디자인 경쟁력을 입증했다.
이 외에도 현대차는 엔비디아와의 전략적 파트너십 강화, 새로운 모빌리티 소프트웨어 브랜드이자 기술 플랫폼인 플레오스(Pleos) 등을 통해 자율주행 및 소프트웨어 중심 차량(SDV, Software Defined Vehicle) 전환에 박차를 가하고 있다.
글로벌 스포츠·문화 마케팅을 통한 브랜드 경험 확대도 현대차의 가치 상승을 견인했다.
1999년부터 27년간 FIFA와 파트너십을 이어온 현대차는 FIFA 월드컵 2026™에서 역대 최대 규모의 공식 차량을 제공하며 브랜드 캠페인 '미래는 지금 여기서부터(Next Starts Now)'를 전개해 글로벌 팬과의 접점을 넓혔다.
더불어, 국제크리켓평의회(International Cricket Council, ICC) 최상위 프리미어 파트너(Premier Partner)로 복귀해 인도를 비롯한 글로벌 크리켓 팬층을 공략하고, 남미 최상위 축구 클럽 대항전 코파 리베르타도레스(Copa Libertadores)도 공식 후원하며 여러 지역에서 브랜드 친밀도를 끌어올렸다.
현대차 푸에르토리코가 기획한 현지 밀착형 캠페인 '코키 알람(Coquí Alarmed)'은 세계 최고 권위의 국제 광고제 칸 라이언즈(Cannes Lions) 2026 오디오·라디오(Audio & Radio) 부문에서 그랑프리(Grand Prix)를 수상하고, 전 세계 바다숲 보전 사회공헌 캠페인 '이름 없는 숲(Forests Without Names)'은 크리에이티브 데이터(Creative Data) 부문 동상(Bronze Lion)을 수상하며 글로벌 광고계에서도 의미 있는 공감을 얻어냈다.
호세 무뇨스(José Muñoz) 현대자동차 대표이사 사장은 "17년 연속 브랜드 가치 성장은 현대차를 선택해주신 고객과 그 신뢰를 쌓아온 임직원 및 딜러 파트너가 함께 이뤄낸 성과"라며 "자동차 브랜드 부문 4위로의 도약은 현재의 제품 경쟁력은 물론 소프트웨어 중심 차량(SDV), 피지컬 AI 등 미래 기술 경쟁력까지 보여준다"고 소감을 밝혔다.
목록

 [October 14, 2026
 [October 13, 2026
 [August 26, 2026
 [August 19, 2026


 [September 22, 2026
 [September 07, 2026
 [September 03, 2026
 [August 11, 2026


 [October 29, 2026
 [October 28, 2026
 [September 21, 2026
 [September 21, 2026
 [October 29, 2026