분기보고서 (2026.09)
Bull 0
Bear 0
Routine
003090
|
Daewoong is a holding company that provides investment and management services to a group of subsidiaries operating in the pharmaceutical and healthcare sectors. Its main subsidiaries include Daewoong Pharmaceutical, which manufactures and sells prescription drugs, over-the-counter medicines, and botulinum toxin products such as Naveva, Ulsan, and Pexclou; Daewoong Bio, which produces active pharmaceutical ingredients and finished drugs; and HanAll Biopharma, which focuses on the development of synthetic and biopharmaceuticals for autoimmune, ophthalmic, and neurological diseases. The group also engages in digital healthcare through products like the thynC smart bed monitoring system and continuous glucose monitors. Daewoong Pharmaceutical was established in 2002 following a spin-off from Daewoong, while HanAll Biopharma was founded in 1973. The company serves domestic and global markets, with significant export activity in botulinum toxin products, and maintains partnerships with entities such as Evolus and Immunovant for the commercialization and development of its therapies. Summarised from the company's own disclosures, fiscal year ended Mar 2026 |
Industry Drug Manufacturers - General | Homepage daewoong.com |
| Sector Healthcare | IR page daewoong.com/ko | |
|
Tags
botulinum toxin, prescription drugs, active pharmaceutical ingredients, biopharmaceuticals, digital healthcare, autoimmune diseases, ophthalmology, neurology, holding company, Daewoong Pharmaceutical, Daewoong Bio, HanAll Biopharma, Naveva, Ulsan, Pexclou, Enblo, thynC, Freestyle Libre, Mobicare, CartBee, Whisky, Biotop, Eligard, Norimics, Hairgro, Verciforin, DWP216, DWP220, Batoquelimab, Immerofurbat, Tanfanercept, HL192, Evolus, Immunovant, Harbour BioMed, NurrOn Pharmaceuticals, PT Selatox Bio Pharma, PT Daewoong Group Indonesia, Daewoong Development, Daewoong Therapeutics, Apicell Therapeutics, IN Therapeutics, Daewoong Pet, Sunmaeul, Daewoong Management Development Institute, Daewoong Engineering, IDS&Trust, Danaa Data
|
Press page daewoong.com/ko/newsroom/news |
Metrics
| Valuation | |
|---|---|
| Market cap | — |
| Market cap (USD) | — |
| P/E | — |
| PEG | — |
| P/BV | — |
| P/S | — |
| P/OCF | — |
| P/FCF | — |
| Dividend yield | — |
| Turnover / mcap | — |
| Returns | |
|---|---|
| ROE | 16.1% |
| ROI | 14.9% |
| ROIC | 20.8% |
| Profit margin | 8.5% |
| Growth | |
|---|---|
| Revenue growing | Yes |
| Profits growing | Yes |
| Revenue up 3y | — |
| Revenue up 5y | — |
| Earnings growth 3y (net profit CAGR) | 19.5% |
| Quality | |
|---|---|
| Profitable | Yes |
| Margin expanding | No |
| Buying back stock | No |
| Diluting (TTM) | No |
| Debt/Equity | — |
| Podcast bulls (TTM) | Sign up |
| Podcast bears (TTM) | Sign up |
| Podcast sentiment (TTM) | Sign up |
| Podcast sentiment % (TTM) | Sign up |
| News sentiment (TTM) | — |
| Quality score | 54.5% |
| Insiders | |
|---|---|
| Buys, 1w | Sign up |
| Buys, 1m | Sign up |
| Buys, 1y | Sign up |
| Sells, 1w | Sign up |
| Sells, 1m | Sign up |
| Sells, 1y | Sign up |
Sign up to see this company's insider trades
| Figure | FY 2025 | FY 2024 | FY 2023 | FY 2022 | FY 2021 | FY 2020 | FY 2019 | FY 2018 | FY 2017 | FY 2016 | FY 2015 | FY 2014 | FY 2013 |
|---|---|---|---|---|---|---|---|---|---|---|---|---|---|
| Revenue | 2.068T | 1.937T | — | 1.697T | — | — | — | — | — | — | — | — | — |
| Net profit | 175.063B | 57.886B | 152.665B | 102.566B | 78.73B | 98.379B | 62.439B | 29.863B | 66.251B | 19.831B | 38.623B | 23.811B | 40.772B |
| Free cash flow | -37.218B | -100.204B | 24.211B | 81.068B | 64.94B | 113.741B | 98.555B | -20.288B | 73.188B | — | — | — | — |
Filed figures
Lines the statements and their notes report beside the headline figures, read from the filings' XBRL as filed (no restatement applied), with figures computed from one filing's own lines. Cash-flow lines carry their cash direction: an outflow is negative. Each period links to its filing; a figure's period, report date and tag are in its tooltip.
| Figure | Dec 2016 | Dec 2017 | Dec 2018 | Dec 2019 | Dec 2020 | Dec 2021 | Dec 2022 | Dec 2023 | Dec 2024 | Dec 2025 |
|---|---|---|---|---|---|---|---|---|---|---|
| Balance sheet detail | ||||||||||
| Trade receivables (KRW) | 189B | 186B | 196B | 227B | 175B | 193B | 229B | 223B | 269B | 267B |
| ↳ YoY growth | +18.2% | -1.3% | +5.4% | +15.9% | -22.9% | +9.9% | +18.7% | -2.5% | +20.7% | -0.6% |
| ↳ 5y CAGR | +10.3% | +11.2% | +1.9% | +0.4% | +4.2% | +2.6% | +3.4% | +8.8% | ||
| Borrowings, current (KRW) | 124B | 95.7B | 207B | 99.3B | 147B | 256B | 234B | 380B | 0.00 | 209B |
| Borrowings, non-current (KRW) | — | — | 200M | 0.00 | 92.6B | 94.5B | 119B | 65B | 325B | 551B |
| Bonds payable (KRW) | 99.9B | 89.9B | 200B | 89.9B | 89.9B | 200B | 89.8B | 89.9B | 194B | 334B |
| Lease liabilities (KRW) | — | — | 0.00 | 3.61B | 3.47B | 5.24B | 1.41B | 3.91B | 4.08B | 3.3B |
| Cash and deposits (KRW) | 106B | 135B | 95.1B | 67.5B | 197B | 125B | 190B | 162B | 192B | 256B |
| Intangible assets (KRW) | 159B | 180B | 155B | 173B | 186B | 232B | 275B | 308B | 356B | 380B |
| Right-of-use assets (KRW) | — | — | 0.00 | 5.46B | 4.72B | 5.65B | 3.74B | 4.34B | 20.6B | 18.9B |
| Net debt (borrowings + leases - cash) (KRW) | 17.7B | -39.4B | 112B | 35.5B | 46.2B | 231B | 164B | 287B | 137B | 507B |
| Cash flow detail | ||||||||||
| Operating cash flow (KRW) | 18.8B | 148B | 45.4B | 139B | 145B | 133B | 149B | 206B | 162B | 258B |
| Purchases of property, plant and equipment (KRW) | -149B | -74.6B | -65.7B | -40B | -31.6B | -68.2B | -68B | -181B | -263B | -295B |
| Purchases of intangible assets (KRW) | -25.1B | -28.5B | -1.41B | -28.4B | -33.5B | -47.3B | -49.6B | -47.5B | -73.7B | -53.2B |
| Dividends paid (cash effect) (KRW) | -8.18B | -7.68B | -7.68B | -7.68B | -7.64B | -7.48B | -8.91B | -8.12B | -8.19B | -12.6B |
| Share buybacks (cash effect) (KRW) | — | — | -1.41M | -3.32M | -20.1B | — | -127M | -10B | 0.00 | 0.00 |
| Interest paid (cash effect) (KRW) | -8.01B | -10.1B | -10.1B | -10.4B | -10.7B | -9.93B | -11.6B | -17.4B | -23.7B | -24.9B |
| Income taxes paid (cash effect) (KRW) | -37.2B | -4.67B | -16.1B | -39.2B | -20.7B | -43B | -36.3B | -37.5B | -64B | -42.7B |
| Free cash flow (OCF - PPE - intangibles) (KRW) | -155B | 44.7B | -21.7B | 70.1B | 80.3B | 17.7B | 31.5B | -23.3B | -174B | -90.4B |
| Income detail | ||||||||||
| Total comprehensive income (KRW) | 31.6B | 81.7B | 36B | 77.2B | 135B | 53.4B | 132B | 186B | 69.2B | 242B |
| Comprehensive income to owners (KRW) | 18.1B | 64.4B | 31.2B | 64.7B | 98.9B | 66.2B | 104B | 137B | 65.6B | 181B |
| Reported | Apr 2, 2018 | Apr 2, 2018 | Mar 18, 2021 | Mar 18, 2021 | Mar 18, 2021 | Mar 20, 2024 | Aug 14, 2025 | Mar 20, 2024 | Aug 14, 2025 | Mar 18, 2026 |
Sign up to see institutional holdings
Sign UpPodcast Mentions
Sign up to see podcast mentions and sentiment
Sign UpDisclosures filed with DART (material events and exchange disclosures), newest first, headlines as filed in Korean. The link opens the filing on DART. Press releases from the company's own website, newest first.
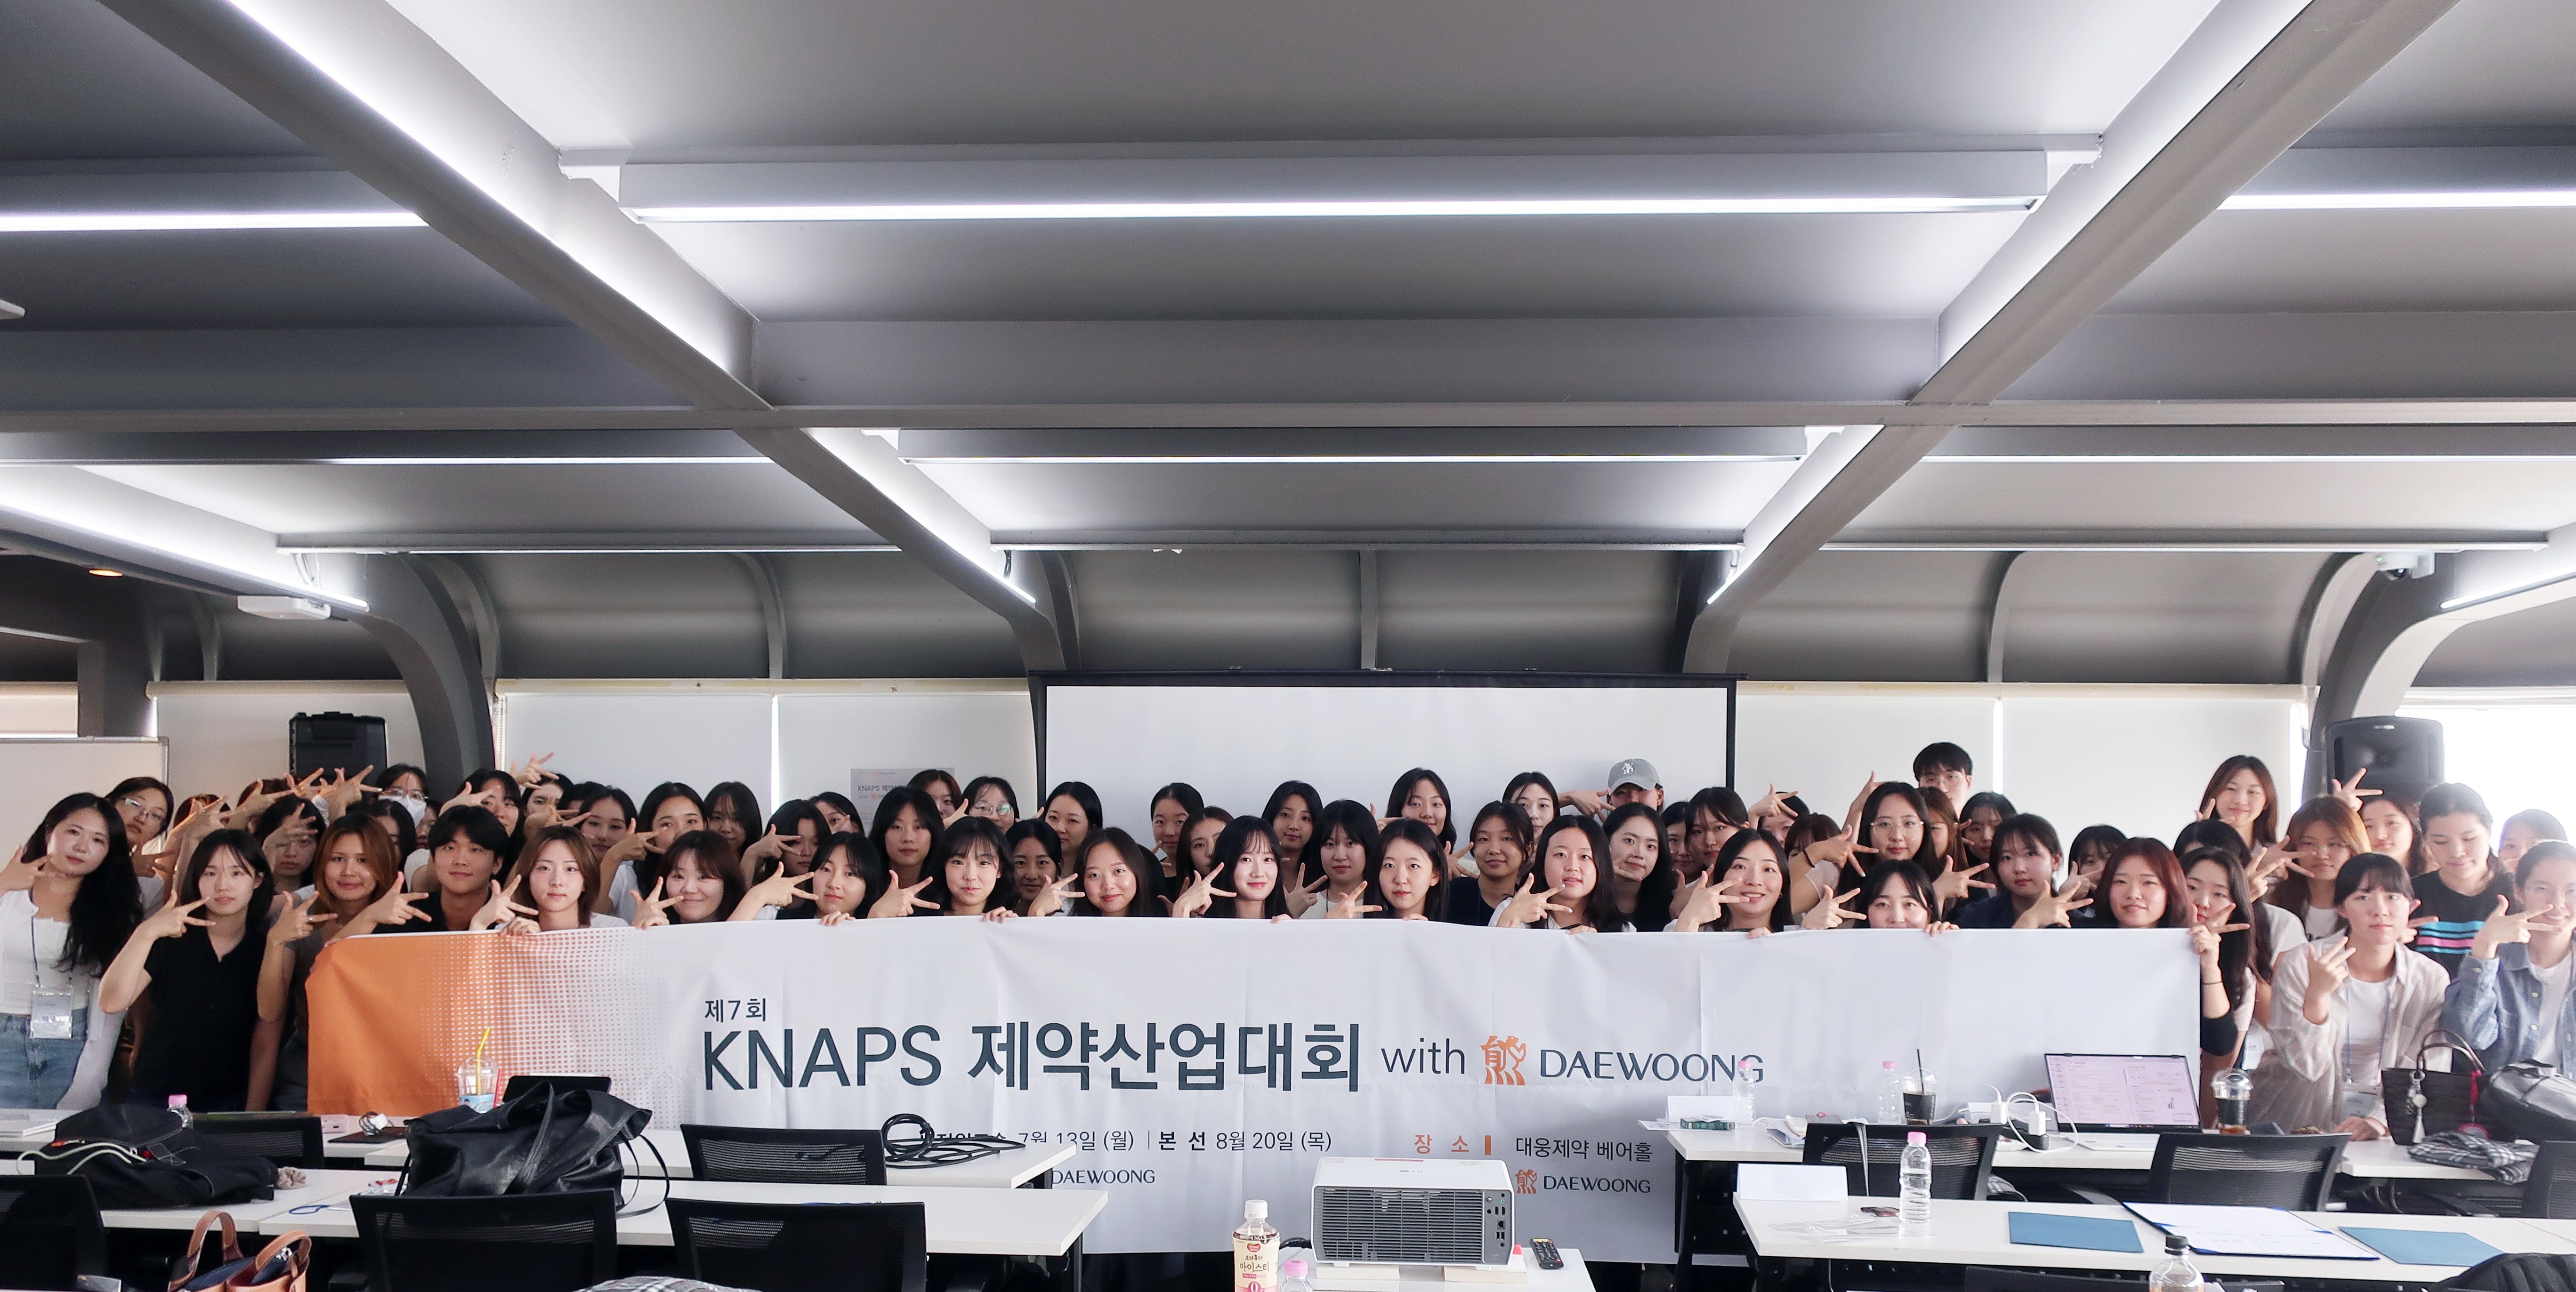 ▲ 대웅제약이 한국약학대학생연합(KNAPS)과 함께 개최한 ‘제약산업대회(ISE)’ 참가 학생들이 기념 촬영을 하고 있다.
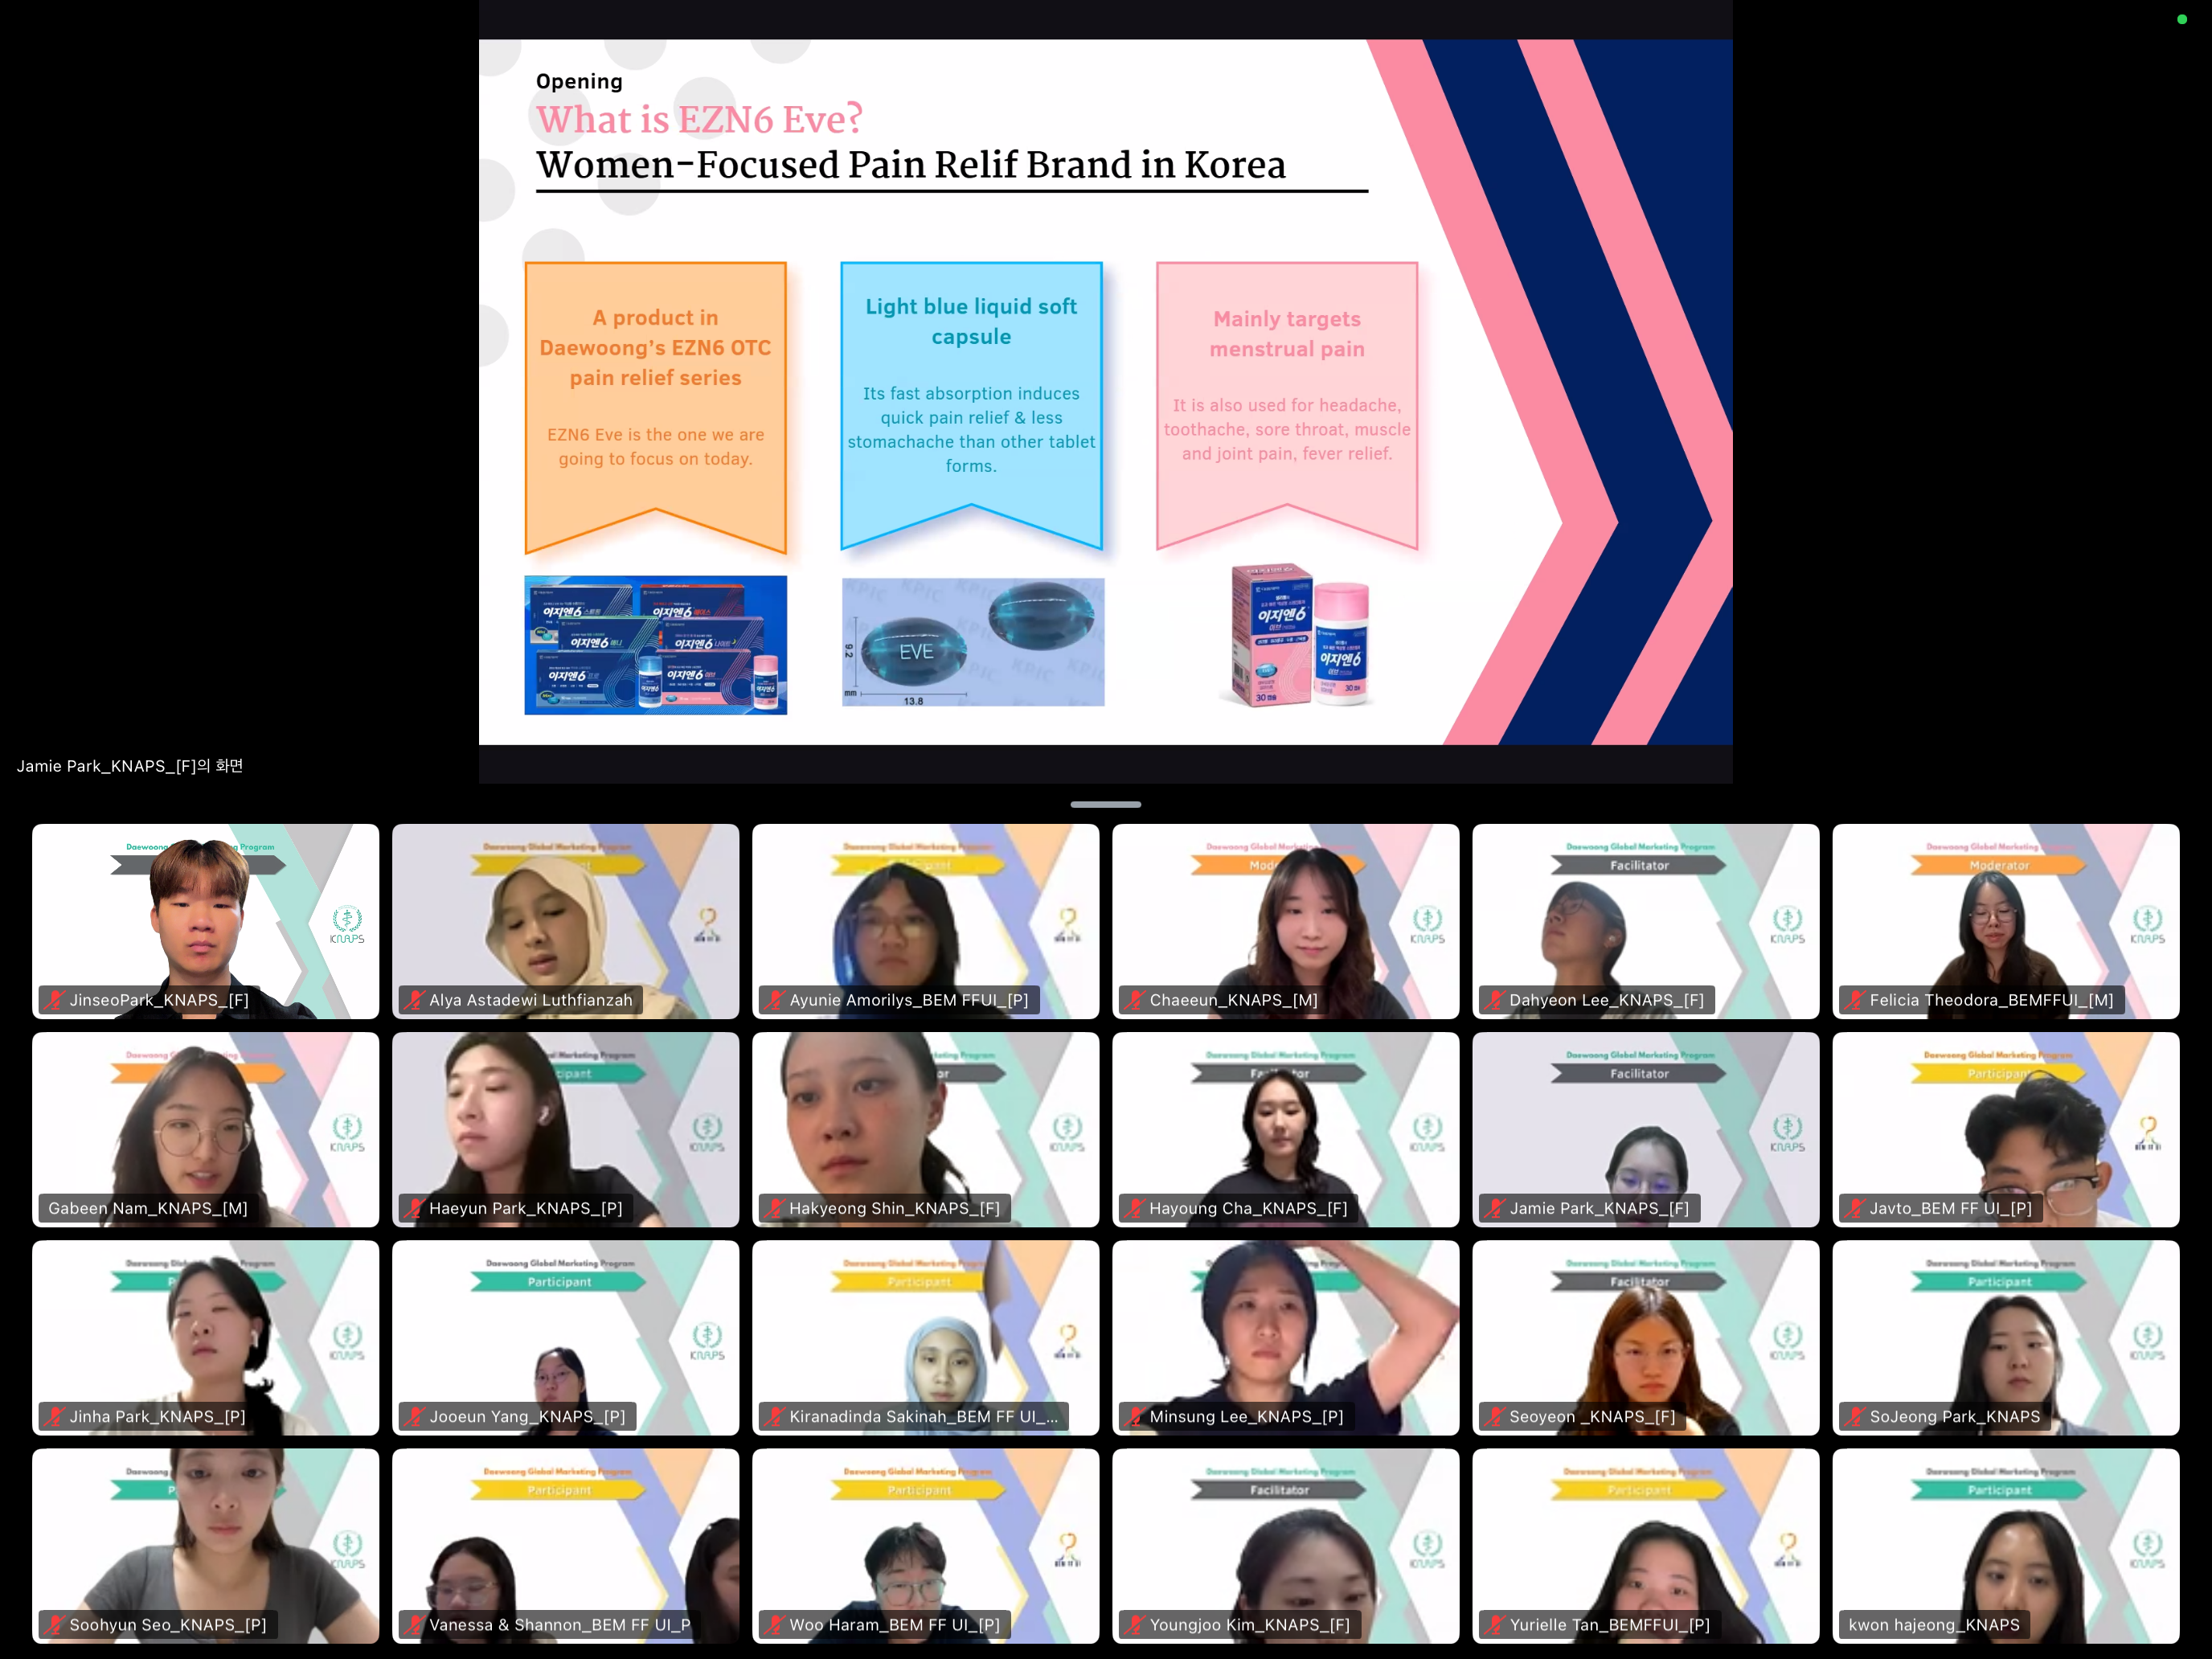 ▲ 한국과 인도네시아 약학대학생들이 온라인 협력 워크숍을 통해 현지 시장 분석 및 ‘이지엔6 이브’ 진출 전략을 논의하고 있다.
Prompts
Click prompts to add them under the company line, click again to take one out, then copy the result into your AI chat. Shared by Asian Century Stocks and Uncovered Thai Stocks. Thank you.
DAEWOONG (ticker 003090), listed in South Korea.
Copied
ETFs Holding DAEWOONG
Exchange-traded funds whose newest published daily portfolio holds one of the company's listings, largest weight first.
| ETF | Weight in ETF | Shares | Market value | As of |
|---|---|---|---|---|
| AVEE | 0.02% | 2,406 | $ 28.555K | Nov 16, 2026 |
| AVES | 0.01% | 8,210 | $ 97.438K | Nov 16, 2026 |
| DFSE | 0.01% | 2,711 | $ 33.377K | Nov 12, 2026 |
| DEXC | 0.01% | 1,143 | $ 14.072K | Nov 12, 2026 |
| DFEM | 0.00% | 34,309 | $ 422.4K | Nov 12, 2026 |
| DFEV | 0.00% | 6,309 | $ 77.674K | Nov 12, 2026 |
| DFAX | 0.00% | 17,983 | $ 221.4K | Nov 12, 2026 |
| DFAE | 0.00% | 6,638 | $ 81.725K | Nov 12, 2026 |
| AVEM | 0.00% | 47,422 | $ 562.814K | Nov 16, 2026 |
| AVSE | 0.00% | 334 | $ 3,963.98 | Nov 16, 2026 |
| AVXC | 0.00% | 648 | $ 7,690.59 | Nov 16, 2026 |