기업가치제고계획(자율공시)
Bull 2
Bear 0
Routine
002790
|
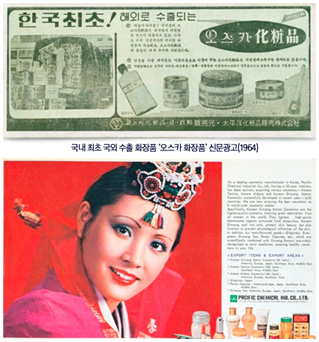
AMOREPACIFIC Holdings is a pure holding company that manages its subsidiaries' businesses through equity ownership, generating revenue from dividends, royalties, service fees, and rental income. Its primary subsidiary, Amorepacific, manufactures and sells cosmetics, household goods, and health functional foods. The group operates a diverse portfolio of beauty brands, including luxury skincare and makeup lines such as Sulwhasoo and Hera, dermocosmetic brands like Etude and Laneige, and haircare brands including Ryo and Mise en Scene. Other key subsidiaries include Innisfree, Etude House, Espoir, Amos Professional, and the green tea brand I-Tea. The company serves domestic and international markets, with sales channels spanning online platforms, department stores, duty-free shops, and overseas subsidiaries. Its global operations cover the Americas, Europe, the Middle East, Africa, and Asia, including China, Japan, and Southeast Asia. The group was founded in 1945 under the predecessor name Pacific Chemical Industry Co., Ltd., and acquired the K-Beauty brand Cosmax in 2024. Summarised from the company's own disclosures, fiscal year ended Mar 2026 |
Industry Packaged Foods | Homepage apgroup.com/int/ko/investors/amorepacific-holdings-corp/stock-information/stock-price-information/stock-price-information.html |
| Sector Consumer Defensive | IR page apgroup.com/int/ko/investors/amorepacific-holdings-corp/stock-information/stock-price-information/stock-price-information.html | |
|
Tags
cosmetics, skincare, makeup, haircare, green tea, health functional foods, household goods, dermocosmetics, luxury beauty, beauty technology, Sulwhasoo, Hera, Etude, Laneige, Cosmax, Ryo, Mise en Scene, Innisfree, Espoir, Amos Professional, I-Tea, Pacific Tech, I-Tea Farm, Ato Barrier 365, XMD Line, Retinol Retjection Serum, Glow Cream Skin, Glaze Craze Tinted Lip Serum, Ceramide Ato, Young Mugwort Cleansing Pack Foam, Vita-Tinol Bouncy Lift Serum, Flora Glow Rose Liquid Mask, M.D Line, Rootzen Anti-Aging Care, Salon 10 Professional, Perfect Original Serum, Vita C Green Tea Enzyme Spot Toning Cream, Green Tea Ceramide Milk Essence, Colorfix Mascara, Cloud Filter Cushion, Espoir Yeonnam, Matcha Noodle Bar, Matcha Station
|
Press page — |
Metrics
| Valuation | |
|---|---|
| Market cap | ₩ 2.478T |
| Market cap (USD) | $ 1.824B |
| P/E | 17.51 |
| PEG | 0.68 |
| P/BV | 0.70 |
| P/S | 0.51 |
| P/OCF | 4.33 |
| P/FCF | 5.05 |
| Dividend yield | — |
| Turnover / mcap | — |
| Returns | |
|---|---|
| ROE | 3.6% |
| ROI | 3.6% |
| ROIC | 7.8% |
| Profit margin | 2.7% |
| Growth | |
|---|---|
| Revenue growing | Yes |
| Profits growing | No |
| Revenue up 3y | No |
| Revenue up 5y | No |
| Earnings growth 3y (net profit CAGR) | 25.8% |
| Quality | |
|---|---|
| Profitable | Yes |
| Margin expanding | Yes |
| Buying back stock | — |
| Diluting (TTM) | No |
| Debt/Equity | — |
| Podcast bulls (TTM) | Sign up |
| Podcast bears (TTM) | Sign up |
| Podcast sentiment (TTM) | Sign up |
| Podcast sentiment % (TTM) | Sign up |
| News sentiment (TTM) | — |
| Quality score | 25.0% |
| Insiders | |
|---|---|
| Buys, 1w | Sign up |
| Buys, 1m | Sign up |
| Buys, 1y | Sign up |
| Sells, 1w | Sign up |
| Sells, 1m | Sign up |
| Sells, 1y | Sign up |
Sign up to see this company's insider trades
| Figure | FY 2025 | FY 2024 | FY 2023 | FY 2022 | FY 2021 | FY 2020 | FY 2019 | FY 2018 | FY 2017 | FY 2016 | FY 2015 | FY 2014 | FY 2013 |
|---|---|---|---|---|---|---|---|---|---|---|---|---|---|
| Revenue | 4.623T | 4.26T | 4.021T | 4.495T | 5.326T | 4.93T | 6.284T | 6.078T | 6.029T | 6.698T | 5.661T | 4.712T | 3.895T |
| Net profit | 124.038B | 252.033B | 119.302B | 62.237B | 179.995B | 10.381B | 133.733B | 142.286B | 202.614B | 332.826B | 241.666B | 218.784B | 157.066B |
| Free cash flow | 552.854B | 297.32B | 201.197B | 63.948B | 663.228B | 471.046B | 556.042B | 293.753B | -256.846B | — | — | — | — |
Filed figures
Lines the statements and their notes report beside the headline figures, read from the filings' XBRL as filed (no restatement applied), with figures computed from one filing's own lines. Cash-flow lines carry their cash direction: an outflow is negative. Each period links to its filing; a figure's period, report date and tag are in its tooltip.
| Figure | Dec 2016 | Dec 2017 | Dec 2018 | Dec 2019 | Dec 2020 | Dec 2021 | Dec 2022 | Dec 2023 | Dec 2024 | Dec 2025 |
|---|---|---|---|---|---|---|---|---|---|---|
| Balance sheet detail | ||||||||||
| Trade receivables (KRW) | 345B | 365B | 309B | 395B | 307B | 312B | 301B | 315B | 411B | 386B |
| ↳ YoY growth | +8.8% | +5.8% | -15.3% | +27.8% | -22.3% | +1.7% | -3.5% | +4.7% | +30.4% | -6.0% |
| ↳ 5y CAGR | +4.9% | +9.7% | -0.6% | -2.0% | -3.8% | +0.4% | +0.8% | +4.7% | ||
| Other receivables (KRW) | — | — | — | — | — | 38.4B | 65.9B | 45.5B | 43.3B | 43.8B |
| Borrowings, current (KRW) | 206B | 178B | 169B | 204B | 257B | 258B | 241B | 277B | 326B | 256B |
| Borrowings, non-current (KRW) | 0.00 | 42.9B | 44.7B | 0.00 | 0.00 | — | — | — | — | — |
| Lease liabilities (KRW) | — | 0.00 | 0.00 | 610B | 337B | 222B | 126B | 97B | 125B | 89.3B |
| Cash and deposits (KRW) | 969B | 1.21T | 1.3T | 1.42T | 1.19T | 871B | 650B | 629B | 564B | 597B |
| Intangible assets (KRW) | 749B | 761B | 774B | 739B | 720B | 703B | 856B | 841B | 2.28T | 2.22T |
| Right-of-use assets (KRW) | — | 0.00 | 0.00 | 571B | 288B | 165B | 116B | 92.8B | 131B | 94.3B |
| Net debt (borrowings + leases - cash) (KRW) | -969B | -987B | -1.08T | -603B | -597B | -391B | -283B | -255B | -113B | -251B |
| Cash flow detail | ||||||||||
| Operating cash flow (KRW) | 877B | 590B | 731B | 830B | 666B | 763B | 183B | 389B | 385B | 630B |
| Purchases of property, plant and equipment (KRW) | -602B | -847B | -437B | -274B | -195B | -99.4B | -120B | -188B | -88.1B | -76.8B |
| Purchases of intangible assets (KRW) | -46B | -46.9B | -55.1B | -38.1B | -33.9B | -31.7B | -40.1B | -43.3B | -29.3B | -30.1B |
| Dividends paid (cash effect) (KRW) | -99.7B | -117B | -92.2B | -101B | -78.3B | -60.9B | -105B | -53.8B | -67.1B | -98B |
| Share buybacks (cash effect) (KRW) | — | 0.00 | 0.00 | -50B | 0.00 | — | — | — | — | — |
| Interest paid (cash effect) (KRW) | -4.45B | -6.19B | -4.79B | -26.5B | -24.6B | -15.4B | -15.9B | -15.7B | -18.6B | -18B |
| Income taxes paid (cash effect) (KRW) | -269B | -318B | -187B | -158B | -125B | -24.9B | -153B | -64.6B | -99.4B | -105B |
| Free cash flow (OCF - PPE - intangibles) (KRW) | 228B | -304B | 239B | 518B | 437B | 632B | 23.3B | 158B | 268B | 523B |
| Income detail | ||||||||||
| Total comprehensive income (KRW) | 792B | 481B | 402B | 287B | 37.2B | 266B | 166B | 96.5B | 617B | 340B |
| Comprehensive income to owners (KRW) | 342B | 202B | 151B | 134B | 16.7B | 165B | 95.5B | 7.68B | 219B | 158B |
| Reported | Apr 1, 2019 | Apr 29, 2020 | Apr 29, 2020 | Apr 29, 2020 | Mar 11, 2021 | Mar 7, 2024 | Mar 7, 2024 | Mar 7, 2024 | Mar 17, 2025 | Mar 18, 2026 |
Sign up to see institutional holdings
Sign UpPodcast Mentions
Sign up to see podcast mentions and sentiment
Sign UpDisclosures filed with DART (material events and exchange disclosures), newest first, headlines as filed in Korean. The link opens the filing on DART. Press releases from the company's own website, newest first.












Prompts
Click prompts to add them under the company line, click again to take one out, then copy the result into your AI chat. Shared by Asian Century Stocks and Uncovered Thai Stocks. Thank you.
AMOREPACIFIC Holdings (ticker 002790), listed in South Korea.
Copied
ETFs Holding AMOREPACIFIC Holdings
Exchange-traded funds whose newest published daily portfolio holds one of the company's listings, largest weight first.