주식등의대량보유상황보고서(일반)
Bull 0
Bear 0
Routine
002350
|
NEXEN TIRE is a tire manufacturer that produces and sells passenger car and SUV tires for the original equipment (OE) and replacement equipment (RE) markets. The company operates production facilities in Yangsan and Changnyeong, South Korea; Qingdao, China; and Zatec, Czechia, serving customers in Europe, North America, Asia, the Middle East, and Oceania. Its business segments include tire manufacturing and sales, tire rental services, and the production of tire molds through its subsidiary Qingdao Nexen Machine Corporation Co., Ltd. The company maintains a global R&D network centered in Magok, with additional centers in the United States, China, and Germany, focusing on electric vehicle tires, low rolling resistance, and noise reduction technologies. NEXEN TIRE supplies tires to automotive manufacturers and distributes products through a global sales network that includes subsidiaries in the United States, China, Germany, Japan, Malaysia, Turkey, Australia, Canada, and Egypt. Summarised from the company's own disclosures, fiscal year ended Mar 2026 |
Industry Auto Parts | Homepage nexentire.com |
| Sector Consumer Cyclical | IR page nexentire.com | |
|
Tags
passenger car tires, suv tires, original equipment, replacement equipment, tire rental, tire molds, electric vehicle tires, low rolling resistance, noise reduction, Qingdao Nexen Machine Corporation Co. Ltd., Shanghai Nexen Tire Sales Co.Ltd., Nexen Tire America. Inc, Nexen Tire Europe GmbH, Nexen Tire Russia LLC, Nexen Tire Japan. Inc, Nexen Tire Europe s.r.o., NEXEN TIRE MALAYSIA SDN.BHD., NEXEN LASTIKLERI ANONIM SIRKETI, NEXEN TIRE AUSTRALIA PTY LTD, Nexen Tire Canada Corporation, NEXEN TIRE EGYPT LLC
|
Press page — |
Metrics
| Valuation | |
|---|---|
| Market cap | ₩ 667.508B |
| Market cap (USD) | $ 491.274M |
| P/E | 4.01 |
| PEG | — |
| P/BV | 0.31 |
| P/S | 0.20 |
| P/OCF | 1.51 |
| P/FCF | 2.81 |
| Dividend yield | — |
| Turnover / mcap | — |
| Returns | |
|---|---|
| ROE | 7.7% |
| ROI | 7.4% |
| ROIC | 6.3% |
| Profit margin | 4.7% |
| Growth | |
|---|---|
| Revenue growing | Yes |
| Profits growing | Yes |
| Revenue up 3y | Yes |
| Revenue up 5y | Yes |
| Earnings growth 3y (net profit CAGR) | — |
| Quality | |
|---|---|
| Profitable | Yes |
| Margin expanding | No |
| Buying back stock | — |
| Diluting (TTM) | No |
| Debt/Equity | — |
| Podcast bulls (TTM) | Sign up |
| Podcast bears (TTM) | Sign up |
| Podcast sentiment (TTM) | Sign up |
| Podcast sentiment % (TTM) | Sign up |
| News sentiment (TTM) | — |
| Quality score | 75.0% |
| Insiders | |
|---|---|
| Buys, 1w | Sign up |
| Buys, 1m | Sign up |
| Buys, 1y | Sign up |
| Sells, 1w | Sign up |
| Sells, 1m | Sign up |
| Sells, 1y | Sign up |
Sign up to see this company's insider trades
| Figure | FY 2025 | FY 2024 | FY 2023 | FY 2022 | FY 2021 | FY 2020 | FY 2019 | FY 2018 | FY 2017 | FY 2016 | FY 2015 | FY 2014 | FY 2013 |
|---|---|---|---|---|---|---|---|---|---|---|---|---|---|
| Revenue | 3.19T | 2.848T | 2.702T | 2.597T | 2.079T | 1.698T | 2.022T | 1.984T | 1.965T | 1.895T | 1.837T | 1.759T | 1.728T |
| Net profit | 150.832B | 126.365B | 102.792B | -27.769B | 4.818B | -16.804B | 118.23B | 103.559B | 124.964B | 175.962B | 127.12B | 129.838B | 123.968B |
| Free cash flow | 128.684B | 54.174B | -81.562B | -371.61B | 149.94B | 61.663B | 69.33B | 151.118B | -28.798B | 278.566B | 159.256B | -15.693B | -53.46B |
Filed figures
Lines the statements and their notes report beside the headline figures, read from the filings' XBRL as filed (no restatement applied), with figures computed from one filing's own lines. Cash-flow lines carry their cash direction: an outflow is negative. Each period links to its filing; a figure's period, report date and tag are in its tooltip.
| Figure | Dec 2016 | Dec 2017 | Dec 2018 | Dec 2019 | Dec 2020 | Dec 2021 | Dec 2022 | Dec 2023 | Dec 2024 | Dec 2025 |
|---|---|---|---|---|---|---|---|---|---|---|
| Balance sheet detail | ||||||||||
| Trade receivables (KRW) | 317B | 339B | 363B | 341B | 346B | 397B | 382B | 430B | 514B | 662B |
| ↳ YoY growth | +0.9% | +7.2% | +6.9% | -5.9% | +1.2% | +15.0% | -3.8% | +12.5% | +19.4% | +28.8% |
| ↳ 5y CAGR | +5.3% | +3.7% | +2.0% | +4.7% | +2.4% | +3.5% | +8.5% | +13.9% | ||
| Other receivables (KRW) | — | — | — | — | — | 40.2B | 22B | 104B | 98B | 70.4B |
| Borrowings, current (KRW) | 228B | 305B | 286B | 249B | 470B | 488B | 1.01T | 895B | 789B | 562B |
| Borrowings, non-current (KRW) | 610B | 558B | 909B | 953B | 907B | 868B | 635B | 855B | 870B | 1.03T |
| Lease liabilities (KRW) | — | — | — | 21B | 21.2B | 23.3B | 19.9B | 20.4B | 22.8B | 19.8B |
| Cash and deposits (KRW) | 126B | 116B | 138B | 147B | 260B | 322B | 258B | 238B | 137B | 160B |
| Intangible assets (KRW) | 12B | 14.4B | 13.7B | 21.3B | 27.2B | 31.4B | 27.7B | 21.7B | 18.4B | 49.5B |
| Right-of-use assets (KRW) | — | — | — | 12.7B | 14B | 16.1B | 13.3B | 11B | 11.4B | 8.74B |
| Net debt (borrowings + leases - cash) (KRW) | 484B | 747B | 1.06T | 1.08T | 1.14T | 1.06T | 1.4T | 1.53T | 1.54T | 1.45T |
| Cash flow detail | ||||||||||
| Operating cash flow (KRW) | 383B | 255B | 157B | 291B | 179B | 265B | -99.4B | 242B | 259B | 351B |
| Purchases of property, plant and equipment (KRW) | -105B | -284B | -5.87B | -222B | -117B | -115B | -272B | -323B | -205B | -223B |
| Purchases of intangible assets (KRW) | -147M | -704M | -577M | -7.9B | -110M | -786M | -155,217 | -19.6M | -48.3M | -197M |
| Dividends paid (cash effect) (KRW) | -8.15B | -10.2B | -10.3B | -10.3B | -10.8B | -10.8B | -10.8B | -10.3B | -11.8B | -13.4B |
| Interest paid (cash effect) (KRW) | -26.2B | -20.6B | -19.4B | -19.5B | -17.2B | -19.6B | -27B | -57.2B | -92.7B | -77.5B |
| Income taxes paid (cash effect) (KRW) | -53.4B | -42.7B | -42.3B | -58.5B | -48B | -13B | -1.13B | -19.9B | -22.8B | -90.1B |
| Free cash flow (OCF - PPE - intangibles) (KRW) | 278B | -29.5B | 151B | 61.4B | 61.6B | 149B | -372B | -81.6B | 54.1B | 128B |
| Income detail | ||||||||||
| Total comprehensive income (KRW) | 177B | 136B | 99.5B | 140B | -981M | 63.2B | 4.02B | 119B | 179B | 201B |
| Comprehensive income to owners (KRW) | 175B | 136B | 99.6B | 140B | -1.19B | 63.4B | 3.75B | 118B | 178B | 201B |
| Reported | Apr 2, 2018 | Apr 2, 2018 | Apr 1, 2019 | Mar 30, 2020 | Mar 18, 2021 | Mar 18, 2024 | Mar 18, 2024 | Mar 18, 2024 | Mar 18, 2025 | Mar 18, 2026 |
Sign up to see institutional holdings
Sign UpPodcast Mentions
Sign up to see podcast mentions and sentiment
Sign UpDisclosures filed with DART (material events and exchange disclosures), newest first, headlines as filed in Korean. The link opens the filing on DART. Press releases from the company's own website, newest first.









 |


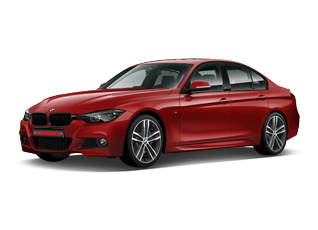
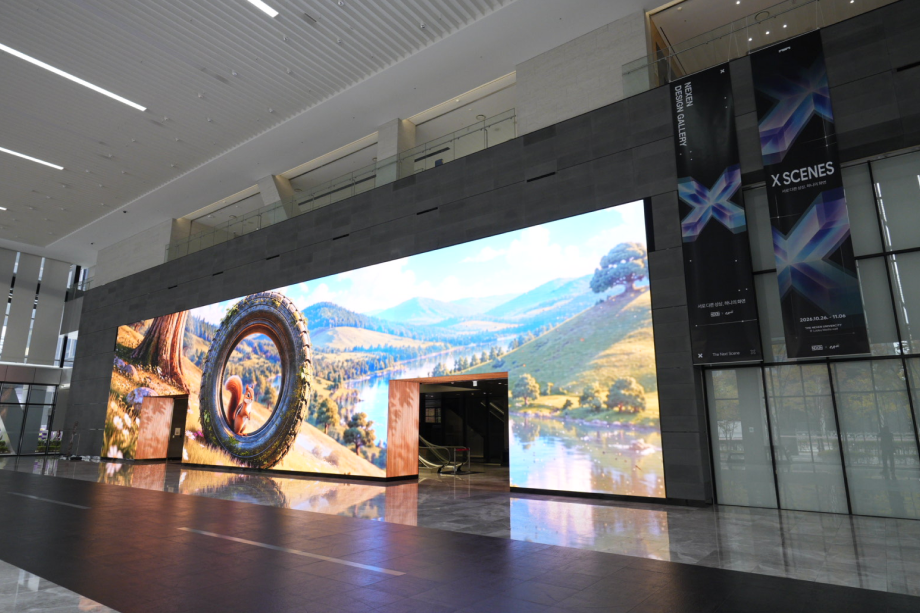 넥센타이어(대표이사 김현석)가 서울 마곡 중앙연구소 '더넥센유니버시티'에 전시공간 '넥센 디자인 갤러리'를 열고 사옥 1층 로비를 복합전시 공간으로 개방한다고 26일 밝혔다.넥센 디자인 갤러리는 오프라인 전시와 디지털 미디어 아트를 함께 선보이는 공간이다. 더넥센유니버시티는 넥센타이어의 연구개발 거점으로, 지난해 국내 자동차 업계 최초로 하이 다이나믹 드라이빙 시뮬레이터를 구축하는 등 타이어 개발의 중심 역할을 하고 있다. 넥센타이어는 이곳 로비를 지역 주민과 방문객이 자유롭게 드나들며 작품을 감상할 수 있는 열린 공간으로 운영하고 있다. 첫 전시는 중앙대학교 학생들의 영상 작품 10편으로 구성한 ‘X SCENES’다. 중앙대 예술공학부와 디자인학부, 글로벌예술학부 학생들이 생성형 AI를 활용해 제작한 작품을 1층 로비 미디어월(가로 30m, 높이 7m)에서 선보인다. 전시는 11월 6일까지 오전 10시부터 오후 6시까지 관람할 수 있다.전시명의 ‘X’는 넥센(NEXEN)의 알파벳에서 출발했다. 넥센의 브랜드 디자인은 고귀함과 열정을 뜻하는 자주색, 균형과 발전 및 타이어의 궤적을 표현한 좌우 대칭의 심볼, 고객과 임직원의 일체감을 나타내는 연결된 타이포그래피를 통해 생명을 존중하는 제품 철학과 높은 완성도를 추구하는 의지를 담고 있다. 이번 전시명은 이 가운데 ‘X’에 주목하고, 숫자 10을 뜻하는 로마숫자 ‘Ⅹ’와 한자 ‘十’의 형태에 착안해 10편의 작품과 다양한 장면이 교차한다는 의미를 더했다. ‘동화 페이퍼아트’, ‘타이어의 여정’, ‘자개산수’ 등 전통 소재를 재해석하거나 일상의 순간을 표현한 작품을 통해 학생들의 다양한 시도를 소개한다.넥센타이어는 포르쉐와 메르세데스-벤츠, BMW, 아우디 등 글로벌 프리미엄 완성차 브랜드에 신차용 타이어(OE)를 공급하며 기술력과 디자인 경쟁력을 쌓아왔다. 넥센 디자인 갤러리는 이러한 경험을 바탕으로 모빌리티와 디자인, 미술 작품을 아우르는 전시 공간으로 운영된다. 넥센타이어는 앞으로 작가와 대학 등 다양한 주체와 협업해 디지털 미디어 아트를 포함한 복합 전시를 주기적으로 선보일 계획이다.넥센타이어 관계자는 "중앙연구소가 주도해 더넥센유니버시티 공간을 지역과 나누고 학생들에게는 작품을 선보일 기회를 제공하고자 넥센 디자인 갤러리를 마련했다"라며 "앞으로도 다양한 전시를 통해 누구나 편하게 찾을 수 있는 문화 공간으로 운영할 예정이니 전시를 희망하는 작가나 기관은 언제든 연락해 주시기 바란다"고 말했다.
 | |

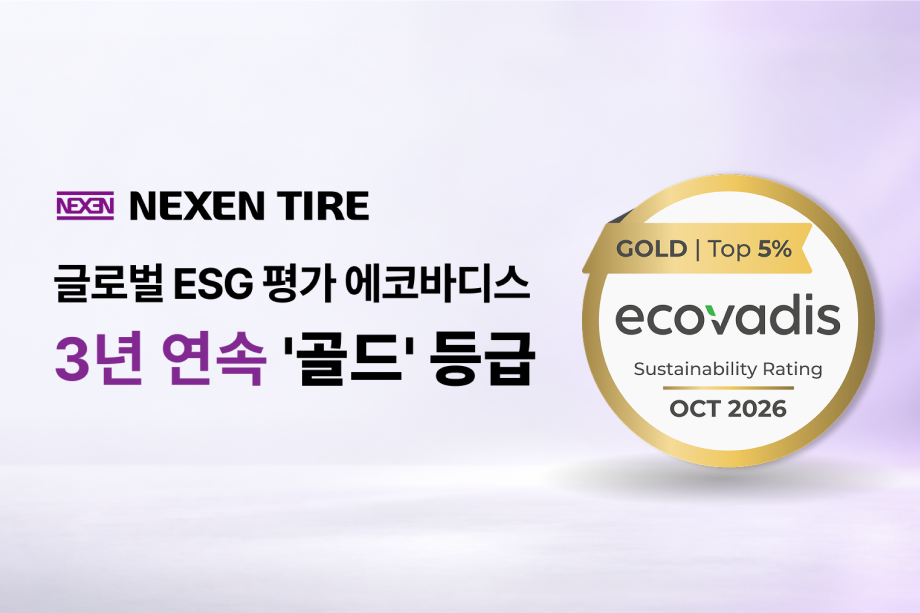 넥센타이어(대표이사 김현석)가 글로벌 지속가능성 평가기관 에코바디스(EcoVadis)의 2026년 ESG 평가에서 전 세계 평가 기업 중 상위 2%에 진입했다고 19일 밝혔다. 골드 등급은 3년 연속이다.이번 평가에서 넥센타이어는 백분위 98%를 기록했다. 지난해 상위 3%에서 한 단계 올라선 성과다. 환경과 노동·인권, 윤리, 지속가능한 조달 등 4개 전 부문에서 고른 성과를 거뒀으며 특히 환경 부문이 가장 높은 평가를 받았다.환경 부문에서는 환경 경영 역량을 인정받았다. 특히 온실가스 배출량 전 범위 공시와 글로벌 사업장 전반에 걸친 환경경영체계의 운영이 긍정적으로 평가됐다. 넥센타이어는 SBTi 승인을 받아 2034년까지 온실가스 배출량(Scope 1·2)을 2023년 대비 58.8% 감축한다는 목표를 공시한 바 있다.노동·인권 부문에서는 글로벌 사업장 전반에 걸친 노동·인권 관리체계의 적용범위 확대가, 지속가능한 조달 부문에서는 협력사 행동규범 개정 및 공급망 ESG 실사 이행, 구매 담당자 ESG 인식 제고 교육 등 지속가능한 공급망 구축을 위한 다양한 활동에서 긍정적인 평가를 받았다. 윤리 부문은 전체 평가영역 중 가장 큰 개선폭을 보였다. 넥센타이어는 부패방지, 이해상충 예방 및 정보보안 등 윤리경영 관련 정책과 실행체계를 지속적으로 운영하고 있으며, 이번 평가에서는 글로벌 사업장에서의 정보보안 활동의 확대에서 개선된 평가를 받았다.에코바디스 평가는 글로벌 완성차 업체들의 협력사 선정 기준으로 활용되고 있다. 유럽을 중심으로 공급망 전반의 ESG 성과를 요구하는 흐름이 강해지는 가운데, 이번 평가 결과는 넥센타이어의 신차용 타이어(OE) 공급 경쟁력 확보로 이어질 것으로 기대된다.에코바디스는 프랑스에 본사를 둔 글로벌 ESG 평가기관으로, 환경과 노동·인권, 윤리, 지속가능한 조달 등 4개 분야를 기준으로 기업의 지속가능경영 수준을 평가한다. 2007년 설립 이후 전 세계 185개국 15만 개 이상 기업을 평가하고 있으며 플래티넘(상위 1%), 골드(상위 5%), 실버(상위 15%), 브론즈(상위 35%) 등급을 부여한다.넥센타이어 관계자는 "지난해에 이어 3년 연속 골드 등급을 유지하고 있는 것은 지속가능경영 체계가 실질적으로 작동하고 있다는 의미"라며 "앞으로도 체계적인 ESG 경영 활동 개선을 통해 지속가능한 모빌리티에 기여하겠다 "고 말했다.
 | |
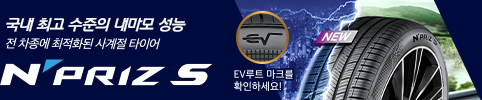
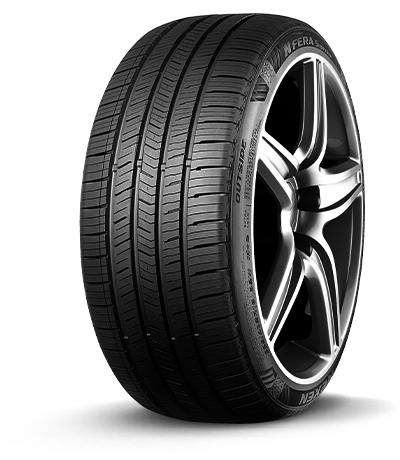
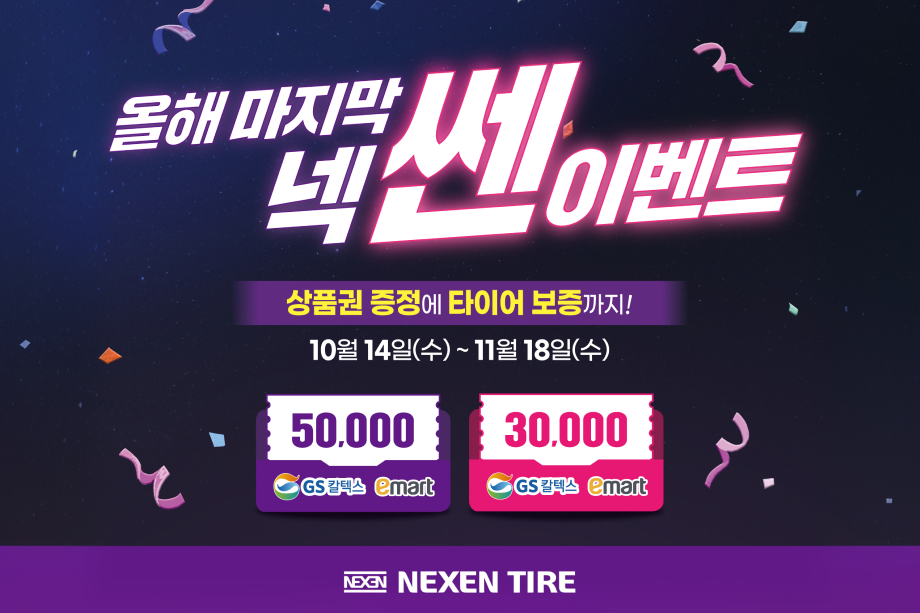 넥센타이어(대표이사 김현석)가 오는 11월 18일까지 타이어 구매 고객을 대상으로 상품권 증정 프로모션을 진행한다고 14일 밝혔다. 계절 변화로 타이어 교체 수요가 늘어나는 시기에 맞춰 사계절 대응 제품을 중심으로 혜택을 마련했다.프로모션 대상은 '엔페라 프리머스 AS T1'과 '엔프리즈 S', '엔블루 포시즌 2' 등 3개 제품이다. 엔페라 프리머스 AS T1 또는 엔블루 포시즌 2를 4본 구매하면 5만원, 엔프리즈 S를 4본 구매하면 3만원 상당의 모바일 상품권을 준다. 구매 고객에게는 구매 후 1년 이내에 사용자 과실로 손상된 타이어도 동일한 신품 타이어로 1회 교환해주는 '엔케어 명품보증제도'도 함께 적용된다.엔페라 프리머스 AS T1과 엔프리즈 S는 한국의 사계절 주행 환경에 맞춰 개발된 올시즌 타이어다. 올해 국내 출시된 엔블루 포시즌 2는 올웨더 타이어로, 유럽 겨울용 타이어 인증인 '3PMSF' 마크를 획득해 여름철 빗길부터 겨울철 눈길까지 폭넓은 노면 환경에 대응한다.
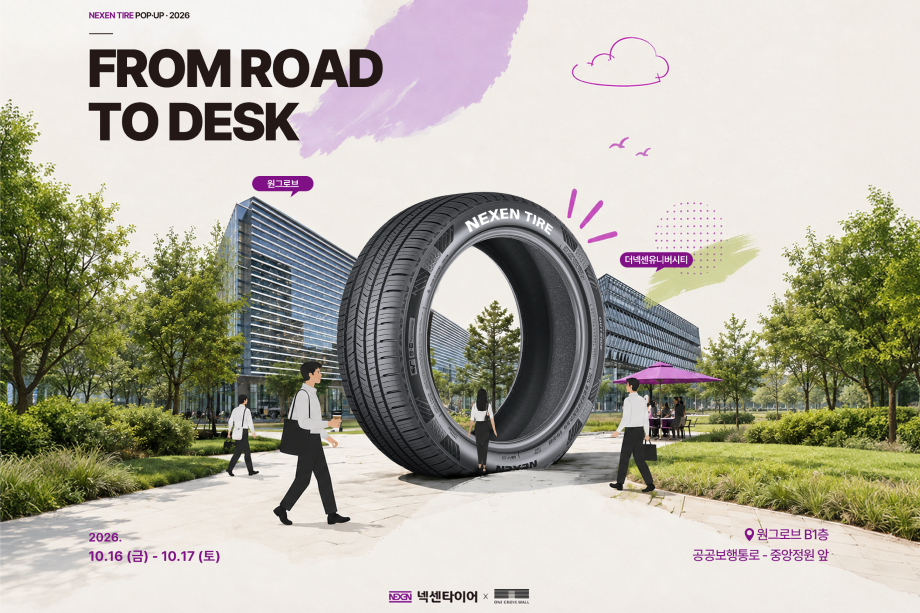 한편 넥센타이어는 오는 16일과 17일 이틀간 서울 강서구 원그로브몰에서 팝업스토어를 운영한다. 넥센타이어 중앙연구소가 자리한 마곡에서 인근 직장인과 원그로브몰 이용객을 직접 만나 브랜드를 알린다는 취지다. 운영 시간은 양일 모두 오전 11시부터 오후 8시까지다.현장에서는 타이어 볼트 잡기 게임을 운영해 조건을 충족한 방문객에게 프리미엄 컴포트 타이어 '엔페라 슈프림' 4본을 증정한다. 선착순 5명 한정이다. 타이어 렌탈 서비스 '넥스트레벨' 커스텀 포토카드를 발급받은 뒤 해당 카드로 서비스를 이용하면 5만원 상당의 온라인 복합 상품권도 받을 수 있다. 커피와 쿠키 등 다과도 나눠준다. 원그로브몰 주차장에서는 타이어 무상 점검과 공기압 주입, 워셔액 보충 서비스를 제공한다.넥센타이어 관계자는 "계절이 바뀌는 시기에 고객이 자신에게 맞는 제품을 부담 없이 선택할 수 있도록 이번 프로모션을 준비했다"라며 "앞으로도 고객이 일상에서 제품을 직접 경험할 수 있는 접점을 넓혀 나가겠다"고 말했다.
 | |
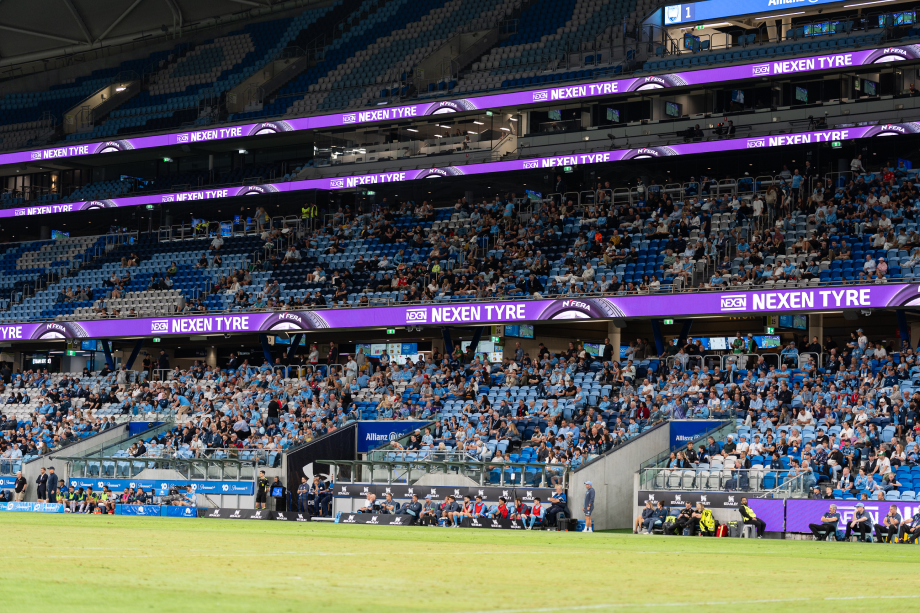 넥센타이어(대표이사 김현석)가 최근 서호주 최대 거점 도시인 퍼스(Perth)에 물류센터를 추가 신설해 물류 인프라를 강화했다고 7일 밝혔다. 안정적으로 성장 중인 호주 시장에서 공급 역량을 대폭 확대하고 현지 브랜드 입지를 더욱 확고히 한다는 전략이다.넥센타이어는 그동안 시드니, 멜버른, 브리즈번 등 동부 주요 도시를 중심으로 물류 거점을 구축해 왔다. 퍼스 물류센터 개소로 공급망을 서부 지역까지 넓히며 전국 단위 유통망 구축에 나섰다. 이번 거점 확장을 통해 넥센타이어는 호주 내 유통상과 소비자들에게 한층 신속하고 안정적인 제품 공급 체계를 제공하게 된다. 현지 재고 관리 효율화를 통해 물류 소요 시간을 크게 단축하고 시장 수요 변화에 즉각 대응하는 수급 유연성을 확보함으로써 현지 영업 경쟁력을 대폭 끌어올릴 방침이다.현지 소비자와의 접점을 넓히기 위한 브랜드 마케팅도 강화하고 있다. 넥센타이어는 파트너 매장에 자사의 브랜드 아이덴티티를 적용하는 ‘샵 브랜딩’을 호주 시장에 공식 도입해 확장해 나갈 예정이다. 매장 간판과 인테리어, 전시물 등을 넥센타이어의 상징색인 보라색을 기반으로 한 통일된 디자인으로 구성해 호주 소비자에게 일관된 브랜드 경험을 제공할 계획이다. 스포츠 마케팅을 통한 브랜드 인지도 제고 활동도 이어간다. 넥센타이어는 2024/25 시즌부터 호주 A리그 프로축구팀 ‘시드니 FC’를 공식 후원하고 있다. 오는 10월 16일 개막하는 2026/27 시즌에도 후원을 지속한다.호주법인의 성장세도 이어지고 있다. 넥센타이어는 호주를 전략 시장으로 삼고 현지 사업을 꾸준히 확대해 왔으며, 올해 상반기 호주법인 매출은 전년 동기 대비 50% 이상 증가했다. 2024년 상반기와 비교하면 2년 만에 2.6배 성장한 수치다.넥센타이어는 이처럼 유통망 확충과 현지 맞춤형 마케팅을 병행하며 호주 시장에서의 사업 기반을 강화하고 있다. 포르쉐, 메르세데스-벤츠, BMW, 아우디 등 글로벌 프리미엄 완성차 브랜드에 신차용 타이어(OE)를 공급하며 축적한 기술력과 품질 경쟁력을 바탕으로 호주 소비자와의 접점을 지속적으로 넓혀 나갈 계획이다.넥센타이어 관계자는 “이번 물류센터 개소를 통해 동부 해안을 넘어 서부 지역까지 제품을 안정적으로 공급할 수 있는 기반을 갖췄다”며 “유통망 확장과 브랜드 마케팅을 함께 강화해 호주 시장에서의 입지를 지속적으로 넓혀 나가겠다”고 말했다.
 | |
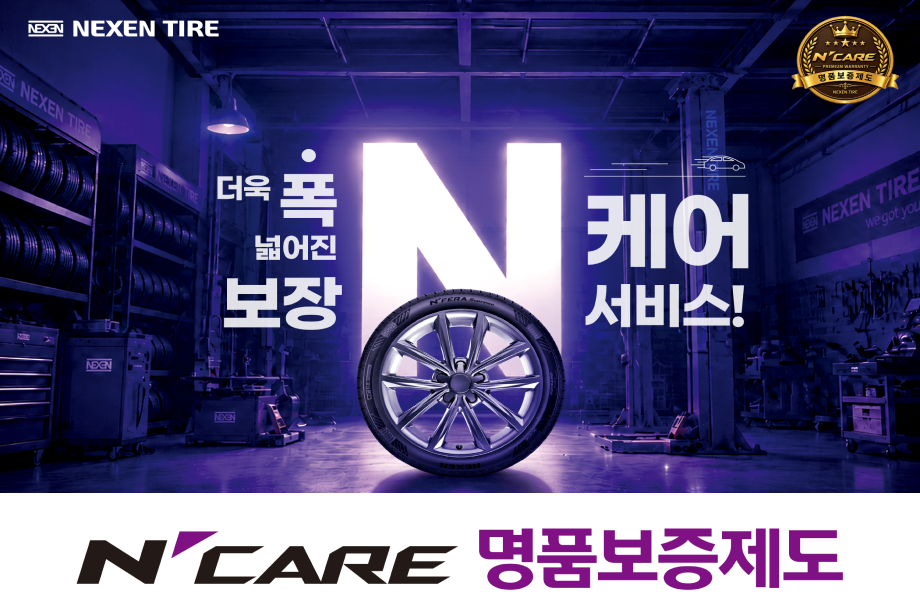 넥센타이어(대표이사 김현석)가 신제품 2종을 보증 대상에 추가한 사후관리 서비스 ‘엔케어(N'CARE) 명품보증제도’를 새롭게 출시했다고 1일 밝혔다.엔케어 명품보증제도는 기존 ‘엔페라 新 명품보증제도’의 대상 제품과 소비자 혜택을 확대·개편한 제도다. 보증 기간인 1년 이내에 사용자 과실 또는 제조상 과실로 타이어가 손상될 경우 동일한 신품 타이어로 1회 교환해준다. 기존 보증 대상인 ‘엔페라 슈프림’, ‘엔페라 슈프림 S’, ‘엔페라 프리머스 AS T1’ 등 5종에 신제품 ‘엔프리즈 S(N'PRIZ S)’와 ‘엔블루 포시즌 2(N'BLUE 4Season 2)’를 추가해 보증 대상 제품을 총 7종으로 확대했다.새롭게 보증 대상에 포함된 두 제품은 전기차와 내연기관차에 모두 장착할 수 있으며, 각 제품의 특성에 맞춘 성능과 안전성을 제공한다. 고효율 사계절용 타이어인 ‘엔프리즈 S’는 이전 모델보다 주행거리가 약 14% 향상돼 경제성과 내구성을 높였다. 올웨더 타이어인 ‘엔블루 포시즌 2’는 여름철 빗길부터 겨울철 눈길까지 다양한 노면 환경에 대응할 수 있다. 유럽 겨울용 타이어 인증인 ‘3PMSF’ 마크도 획득해 겨울철 주행 성능과 안전성을 확보했다.보증 서비스는 동일 차종에 같은 패턴의 타이어 4개를 구매한 뒤, 1개월 이내에 구매 대리점을 통해 서비스 이용에 동의하고 고객 정보를 등록하면 적용된다. 온라인 직영몰인 ‘넥스트레벨’ 홈페이지에서 구매한 고객은 별도의 절차 없이 자동으로 등록된다. 보증 등록 방법과 제품별 세부 조건, 보증 제외 항목은 구매 대리점과 넥센타이어 홈페이지, 고객만족실을 통해 확인할 수 있다.넥센타이어는 이번 제도 개편을 통해 글로벌 시장에서 검증된 품질 경쟁력을 사후관리 서비스 영역으로 확장하고, 고객 만족도를 높이는 서비스 정책을 이어갈 계획이다. 포르쉐, 메르세데스-벤츠, BMW, 아우디 등 프리미엄 완성차 브랜드에 신차용 타이어(OE)를 공급하며 축적한 기술력과 품질 경쟁력을 바탕으로 소비자가 더욱 안심하고 제품을 구매할 수 있는 환경을 조성한다는 방침이다.넥센타이어 관계자는 “신제품 출시에 맞춰 보증 서비스의 적용 범위를 확대함으로써 고객에게 한층 강화된 사후관리 서비스를 제공하고자 했다”며 “앞으로도 고객 신뢰를 최우선 가치로 두고 차별화된 품질과 서비스 정책을 지속적으로 강화해 나가겠다”고 말했다.
 | |
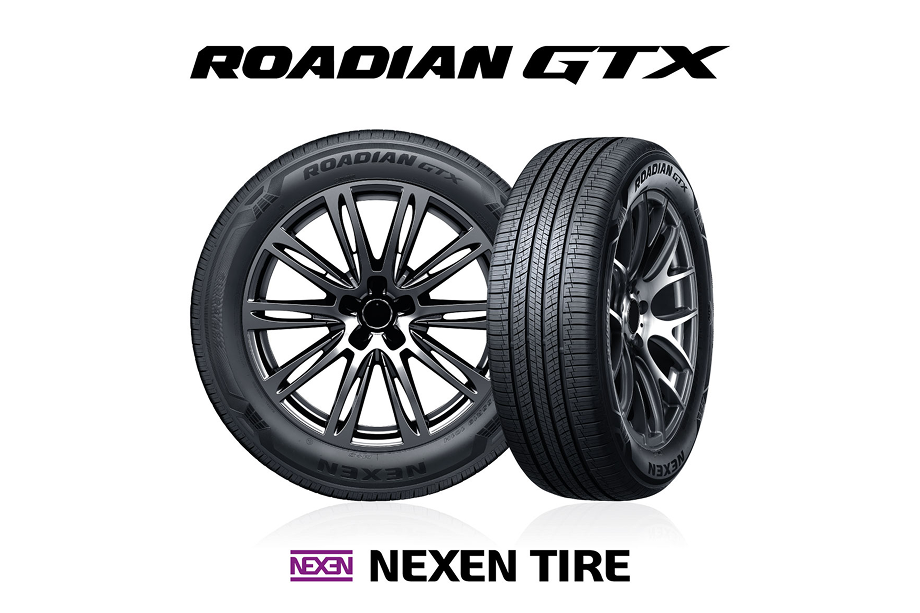 넥센타이어(대표이사 김현석)가 기아의 중형 스포츠유틸리티차(SUV) '쏘렌토' 연식변경 하이브리드 모델에 '로디안 GTX(ROADIAN GTX)'를 신차용 타이어(OE)로 추가 공급한다고 28일 밝혔다.이번 연식변경 모델에는 '로디안 GTX' 20인치가 새롭게 적용됐다. 기존에 공급하던 17인치와 함께 두 가지 규격이 쏘렌토 하이브리드 모델에 장착되며, 17인치는 국내와 북미 시장, 20인치는 국내 시장 판매 차량에 각각 적용된다.공급 제품인 '로디안 GTX'는 SUV 차량 특성에 최적화해 개발된 사계절용 타이어다. 제동 성능과 눈길 주행 성능, 마모 보증 성능이 뛰어나며 정숙성과 승차감까지 균형 있게 확보했다. 특히 다양한 온도 변화 환경에서도 안정적인 성능을 발휘하는 특수 컴파운드가 적용되어 계절과 상관없이 우수한 제동력과 편안한 승차감을 제공한다. 또한 지그재그 타입의 패턴 디자인을 통해 지면 압력을 효과적으로 분산시키고 주행 중 쏠림 현상을 최소화했다.아울러 강화된 마일리지 성능으로 긴 교체 주기를 확보해 하이브리드 SUV에 요구되는 내구성과 효율성을 충족시켰다. 로디안 GTX는 앞서 기아 EV5·EV6, 르노 필랑트, 지프 체로키 등 주요 국산 및 글로벌 브랜드 SUV 모델에 잇따라 신차용 타이어로 공급되며 뛰어난 제품력을 입증받은 바 있다.넥센타이어는 이번 공급 확대를 발판 삼아 내수와 북미 시장을 아우르는 글로벌 완성차 업체와의 파트너십을 더욱 공고히 할 계획이다. 넥센타이어는 포르쉐, 메르세데스-벤츠, BMW, 아우디 등 글로벌 프리미엄 브랜드에 신차용 타이어를 공급하며 검증받은 기술력을 바탕으로 국내외 완성차 OE 공급 영역을 지속 확대해 나가고 있다.넥센타이어 관계자는 "이번 OE 공급 확대는 당사 제품의 뛰어난 기술력과 품질이 글로벌 시장에서 지속적으로 인정받고 있음을 보여주는 결과"라며, "앞으로도 글로벌 완성차 업체와의 협력을 강화해 신차용 타이어 공급을 계속 늘려갈 것"이라고 전했다.
 | |
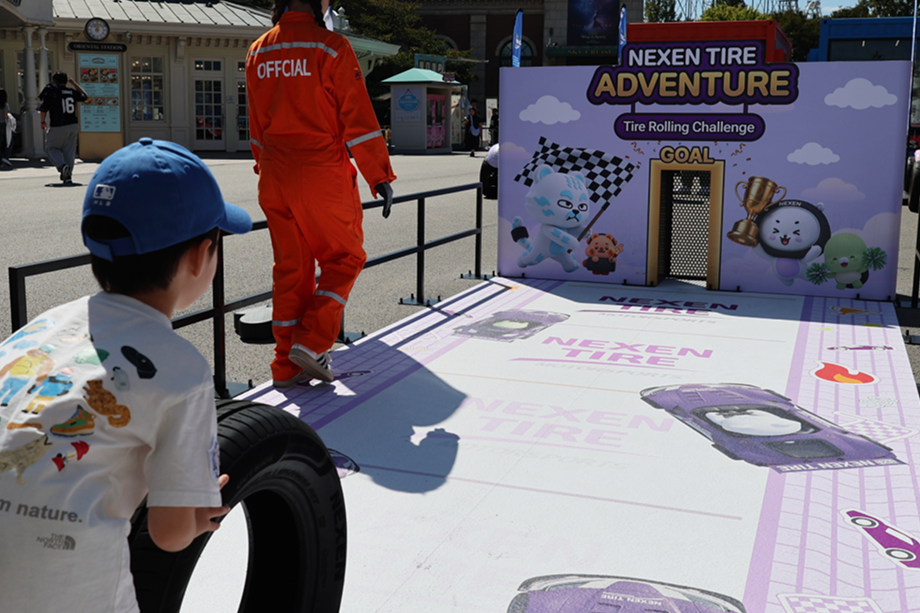 넥센타이어(대표이사 김현석)가 오는 10월 31일까지 에버랜드에서 열리는 모터스포츠 테마의 ‘왓에버 시리즈: 파이널 랩(FINAL LAP)’에 참가해 방문객들을 위한 이색 현장 체험 이벤트를 선보인다고 22일 밝혔다.이번 행사는 넥센타이어와 삼성물산 리조트 부문이 지난 2023년부터 '넥센타이어 스피드웨이 모터 페스티벌'을 함께 주최하며 이어온 파트너십을 바탕으로 기획됐다. 양사는 레이싱 서킷 안에서만 느낄 수 있던 모터스포츠의 역동적인 열기를 테마파크 방문객들이 일상에서 직접 보고 즐길 수 있는 문화·전시 콘텐츠로 확대해 친근한 브랜드 경험을 선사할 계획이다.넥센타이어는 행사 기간 동안 에버랜드 글로벌페어 광장 일대에서 누구나 쉽게 참여할 수 있는 ‘타이어 롤링 챌린지(TIRE ROLLING CHALLENGE)’를 운영한다. 목표 골대를 향해 직접 타이어를 굴려 넣는 미션형 이벤트로, 미션에 성공한 참가자에게는 선착순으로 소정의 기념품을 증정한다.이벤트에는 '엔블루 S(N'blue S)'와 '엔블루 포시즌 2(N'blue 4Season 2)' 두 제품이 사용된다. 엔블루 S는 회전저항을 줄이고 젖은 노면 제동력을 높인 여름용 타이어로, 아우디 A3와 폭스바겐 골프, 비야디(BYD) 돌핀 서프 등 주요 완성차 모델에 신차용 타이어(OE)로 공급되고 있다. 유럽에서 판매되는 제품으로 국내에는 출시되지 않아, 이번 이벤트는 국내 소비자가 직접 접해볼 수 있는 기회이기도 하다.함께 사용되는 엔블루 포시즌 2는 사계절 대응 올웨더 타이어다. 유럽 겨울용 타이어 인증인 '3PMSF' 마크를 획득해 눈길에서도 안정적인 주행이 가능하며, 2025년 독일 아우토빌트 알라드(Auto Bild Allrad)와 2024년 아우토빌트 스포츠카(Auto Bild Sportscars) 타이어 테스트에서 각각 'Good' 등급을 받았다. 두 제품 모두 전기차와 내연기관 차량 구분 없이 최적의 성능을 발휘하도록 하는 넥센타이어의 자체 인증 기술 'EV 루트'가 적용됐다.넥센타이어 관계자는 “에버랜드 스피드웨이와 오랜 기간 쌓아온 모터스포츠 파트너십을 바탕으로 테마파크를 찾은 방문자들에게 유쾌한 즐길거리를 제공하고자 이번 이벤트를 준비했다”며 “앞으로도 계절과 차량 종류에 관계없이 다양한 일상 주행 환경에 대응하는 넥센타이어의 기술력을 고객들이 친근하게 경험할 수 있도록 모터스포츠를 비롯한 다양한 문화 마케팅을 지속적으로 펼쳐나갈 것”이라고 전했다.
 | |
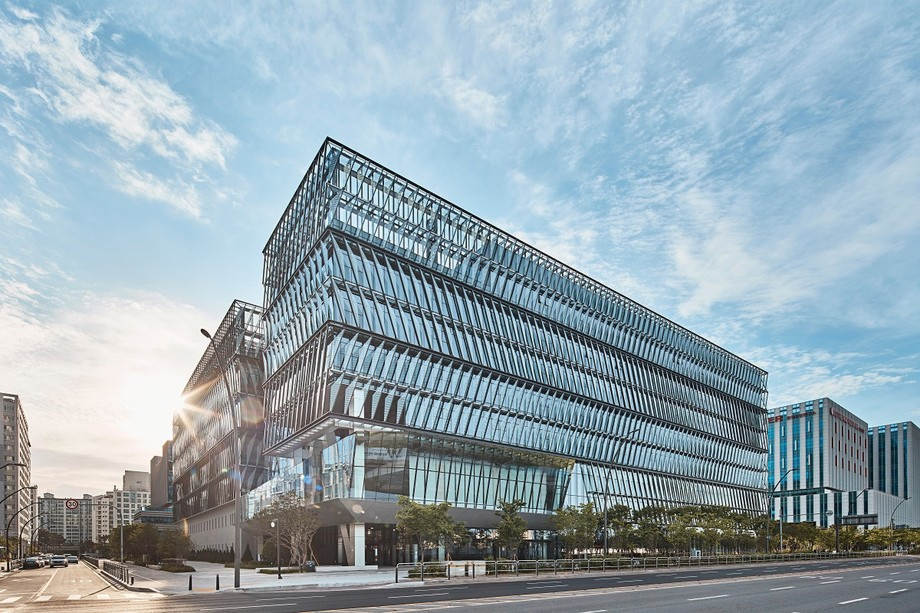 넥센타이어(대표이사 김현석)가 최근 마곡 중앙연구소 '더넥센유니버시티'에서 'R&D AI 스마트워크 경진대회'를 개최했다고 14일 밝혔다. 연구원들이 직접 업무에 AI를 적용한 사례를 발굴하고 실무 적용을 확대하기 위해 마련된 자리다.수상작으로는 'OFFICE SOLUTION 통합포털'과 'AI 레이싱 데이터 분석', 실험실 장비관리 자동화 시스템이 선정됐다. 1위를 차지한 OFFICE SOLUTION 통합포털은 흩어져 있던 평가업무 시스템을 하나로 묶어 메일과 일정, 예산, 시험계획을 AI 에이전트로 조회할 수 있게 한 시스템이다. 평가는 실무 적용 방식과 구체적 성과, 사내 확산 가능성을 기준으로 이뤄졌다.이번 경진대회 수상작은 개발 부서가 아닌 현업 연구원들이 직접 만들었다. 넥센타이어가 지난 5월 '챗GPT 엔터프라이즈(ChatGPT Enterprise)'를 도입하고 국내 관리직·연구직 임직원을 대상으로 AI 활용 교육을 진행하는 등 전사 차원의 기반을 갖춘 데 따른 것이다.넥센타이어는 이처럼 연구개발 과정 전반으로 AI 활용을 넓히고 있다. 특히 마곡 중앙연구소는 AI 에이전트 및 오픈소스 대규모언어모델(LLM)을 활용하여 자체 AI 플랫폼을 개발 중이다. 국내는 물론 미국과 중국, 유럽 연구소의 기술문서까지 연결해 연구원이 필요한 자료를 자연어로 검색할 수 있게 하는 것이 목표다. 넥센타이어는 향후 사내 기술문서에서 찾은 지식과 실제 시험·측정 데이터를 한자리에서 비교할 수 있는 환경을 구축해 재료 연구부터 타이어 개발까지 의사결정을 지원하는 플랫폼으로 발전시킬 계획이다.넥센타이어 관계자는 "전문 개발 인력이 아닌 현업 연구원들이 업무에 필요한 시스템을 직접 만들어 쓰고 있다는 점이 이번 경진대회의 의미"라며 "챗GPT 엔터프라이즈와 자체 업무 플랫폼 등 AI 인프라를 계속 구축해 단절돼 있던 데이터와 업무 영역을 잇고, 더 안전하고 우수한 타이어를 개발하겠다"고 말했다.
 | |
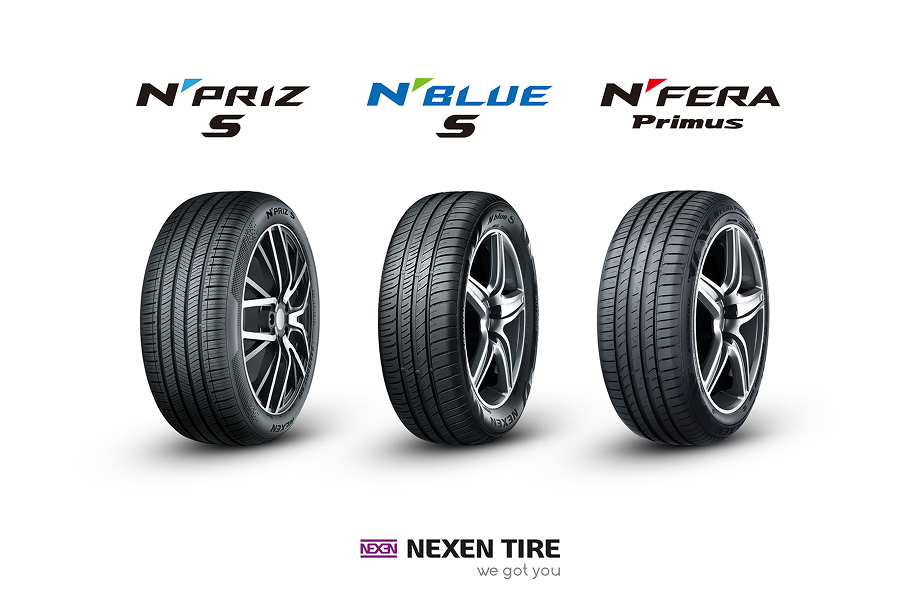 넥센타이어(대표이사 김현석)가 현대자동차의 ‘디 올 뉴 아반떼'에 신차용 타이어(OE)를 공급한다고 7일 밝혔다. 디 올 뉴 아반떼는 이번에 8세대 완전변경을 거쳐 새롭게 출시됐다. 넥센타이어는 이번 공급을 시작으로 아반떼가 판매되는 지역별 기후와 도로 환경에 맞춰 서로 다른 제품을 순차적으로 공급할 계획이다.사계절 기후 변화가 뚜렷한 국내와 북미 시장에는 엔프리즈 S(N'PRIZ S) 16인치와 18인치가 장착된다. 엔프리즈 S는 미세한 홈인 3D 커프(Kerf) 기술을 적용해 눈길에서도 타이어가 노면을 더 촘촘히 움켜쥐도록 설계됐다. 이를 통해 겨울철에도 안정적인 핸들링과 제동 성능을 갖췄다. 또한 가변 피치 블록 설계로 타이어가 굴러갈 때 발생하는 소음을 분산시켜 한층 정숙한 승차감을 구현했다. 연비와 내마모 성능을 함께 높인 특수 컴파운드를 적용한 것도 특징이다.여름용 타이어가 보편화된 유럽 지역에는 엔블루 S(N'BLUE S) 16인치가 적용된다. 엔블루 S는 노면과 맞닿는 홈을 최적화하고 물기를 빠르게 흘려보내는 가느다란 홈인 사이프(Sipe)를 더해 젖은 노면에서도 안정적인 제동력과 핸들링을 갖췄다. 이미 유럽 다수 차종에 신차용으로 장착되며 품질과 제품 경쟁력을 인정받은 제품이다.고온 환경과 장거리 주행이 많은 중동 지역에는 엔블루 S 16인치와 함께 엔페라 프리머스(N'FERA Primus) 17인치가 공급된다. 엔블루 S는 회전저항을 낮춰 연비 효율을 높였으며, 엔페라 프리머스는 강화된 마모 성능으로 뛰어난 내구성을 갖춰 장거리 주행에도 안정적인 성능을 발휘한다.넥센타이어는 포르쉐·메르세데스-벤츠·BMW·아우디 등 글로벌 프리미엄 완성차 브랜드는 물론, 각 지역에서 높은 판매 비중을 차지하는 볼륨 모델까지 폭넓은 신차용 타이어 공급 포트폴리오를 갖추고 있다. 차종과 시장 특성에 맞춘 맞춤형 제품 공급 전략을 통해 글로벌 완성차 업체들과의 협력 관계를 지속적으로 확대해 나간다는 전략이다.넥센타이어 관계자는 “이번 신형 아반떼 공급을 통해 국내외 다양한 시장의 운전자들과 접점을 넓힐 수 있게 됐다”며 “앞으로도 시장별 특성을 고려한 맞춤형 제품 공급으로 글로벌 완성차 업체와의 파트너십을 지속적으로 확대해 나가겠다”고 말했다.
 | |

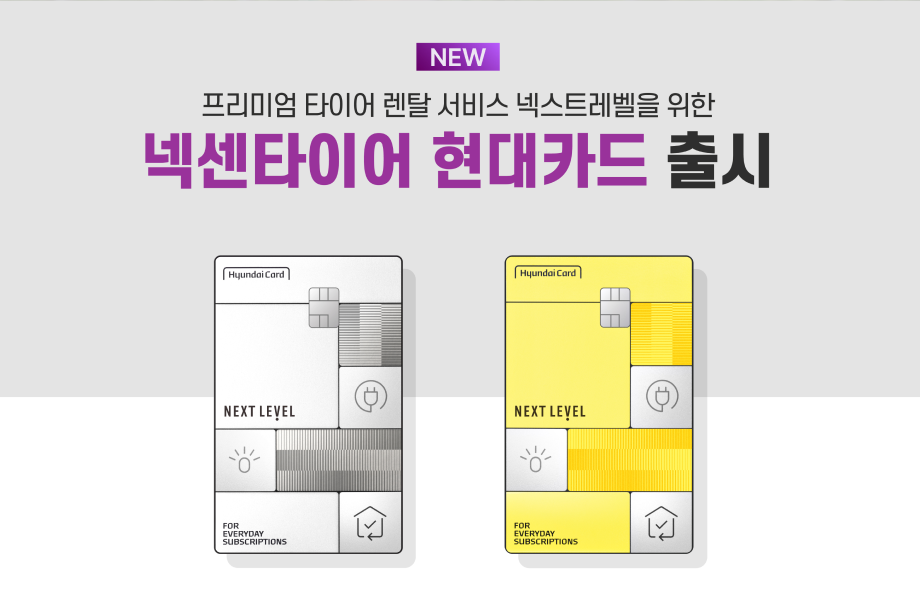 넥센타이어(대표이사 김현석)가 현대카드와 손잡고 타이어 구독형 렌탈 서비스 '넥스트레벨(NEXT LEVEL)' 이용 고객을 위한 제휴카드 '넥센타이어 현대카드'를 출시한다고 01일 밝혔다. 이번 카드는 프리미엄 타이어를 보다 합리적인 가격에 이용할 수 있도록 기획됐다. 넥센타이어의 타이어 렌탈 서비스인 넥스트레벨 이용 시 비용 부담을 획기적으로 낮춘 것이 특징이다. 전월 실적 ▲40만 원 이상 시 8천 원 ▲80만 원 이상 시 1만 2천 원 ▲120만 원 이상 시 1만 6천 원의 할인을 받을 수 있다. 카드 연회비는 2만 원이다.카드 출시를 기념해 렌탈료 부담을 한층 더 줄여주는 특별 프로모션도 진행한다. 최근 6개월간 현대카드 이용 실적이 없는 고객이 '넥센타이어 현대카드'로 렌탈료 자동이체를 신청하면, 전월 실적에 따라 최대 월 1만 5천 원의 추가 할인을 최대 36개월간 제공받는다.이에 따라 기본 할인과 프로모션 추가 할인을 더하면 최대 월 2만 7천원의 혜택을 받을 수 있다. 예를 들어 전월 실적 40만 원 이상을 충족한 고객이 대표 제품인 ‘엔페라 슈프림’ 4본을 렌탈할 경우, 월 이용 금액을 0원까지 낮출 수 있다. 본 프로모션은 ARS 또는 고객센터 카드신청 전용 사이트를 통해 신청한 경우에만 적용된다.이번 제휴카드 출시 배경에는 넥센타이어가 2015년 국내 최초로 선보인 타이어 렌탈 서비스 '넥스트레벨'의 지속적인 성장이 있다. 프리미엄 타이어를 부담 없이 이용하려는 소비자가 늘면서, 2025년 기준 넥스트레벨 렌탈 신규 고객 수는 2020년 대비 2배 이상 증가했다. 누적 렌탈 판매 수량 역시 2021년 100만 개 돌파 이후 2배 이상 성장했다.넥스트레벨은 고객 니즈에 따라 ▲알뜰케어 렌탈과 ▲안심케어 렌탈 두 가지 상품으로 운영된다. '알뜰케어'는 장착·점검·위치교환(1회)을 제공하며, '안심케어'는 여기에 얼라인먼트(1회)와 무상 조기 마모 보증 혜택을 추가했다. 두 상품 모두 계약 기간 중 사용자 과실로 인한 타이어 파손 시에도 무상 교체 서비스를 제공하며, 전국 800여 개 렌탈 제휴 매장에서 이용 가능하다.글로벌 프리미엄 완성차 브랜드에 신차용 타이어(OE)를 공급하며 검증받은 넥센타이어의 프리미엄 기술력을 이번 제휴 혜택을 통해 한층 더 합리적인 구독형 방식으로 경험할 수 있게 됐다.넥센타이어 관계자는 "이번 카드 출시는 프리미엄 타이어를 보다 합리적으로 이용할 수 있는 구체적인 솔루션을 제시했다는 데 의미가 있다"며, "앞으로도 다양한 제휴 혜택과 프로모션을 적극 발굴해 고객의 이용 편의와 만족도를 높여 나갈 것"이라고 전했다.넥센타이어 현대카드 신청 및 프로모션에 대한 자세한 내용은 넥센타이어 렌탈 공식 홈페이지 및 현대카드 앱을 통해 확인할 수 있다.
 | |
 처리목적
 보유기간
 제3자 제공
 처리위탁
 처리항목
 고충처리부서
 제6조(개인정보의 파기)


 제7조(정보주체와 법정대리인의 권리·의무 및 행사방법)
 제8조(개인정보의 안전성 확보조치)
 제9조(개인정보 자동 수집 장치의 설치 · 운영 및 거부에 관한 사항)

 제11조(권익침해 구제방법)
 제12조(개인정보 처리방침의 변경)





Prompts
Click prompts to add them under the company line, click again to take one out, then copy the result into your AI chat. Shared by Asian Century Stocks and Uncovered Thai Stocks. Thank you.
NEXEN TIRE (ticker 002350), listed in South Korea.
Copied
ETFs Holding NEXEN TIRE
Exchange-traded funds whose newest published daily portfolio holds one of the company's listings, largest weight first.
| ETF | Weight in ETF | Shares | Market value | As of |
|---|---|---|---|---|
| DFEM | 0.00% | 42,675 | $ 187.642K | Nov 12, 2026 |
| DFEV | 0.00% | 8,631 | $ 37.951K | Nov 12, 2026 |
| DFAE | 0.00% | 23,158 | $ 101.826K | Nov 12, 2026 |
| DFAX | 0.00% | 17,983 | $ 79.071K | Nov 12, 2026 |
| DEXC | 0.00% | 168 | $ 738.70 | Nov 12, 2026 |
| AVEM | 0.00% | 36,014 | $ 160.75K | Nov 16, 2026 |
| AVES | 0.00% | 10,178 | $ 45.43K | Nov 16, 2026 |
| AVSE | 0.00% | 499 | $ 2,227.30 | Nov 16, 2026 |
| AVEE | 0.00% | 1,272 | $ 5,677.62 | Nov 16, 2026 |
| AVXC | 0.00% | 132 | $ 589.19 | Nov 16, 2026 |