연결재무제표기준영업(잠정)실적(공정공시)
Bull 0
Bear 5
Results
001740
|
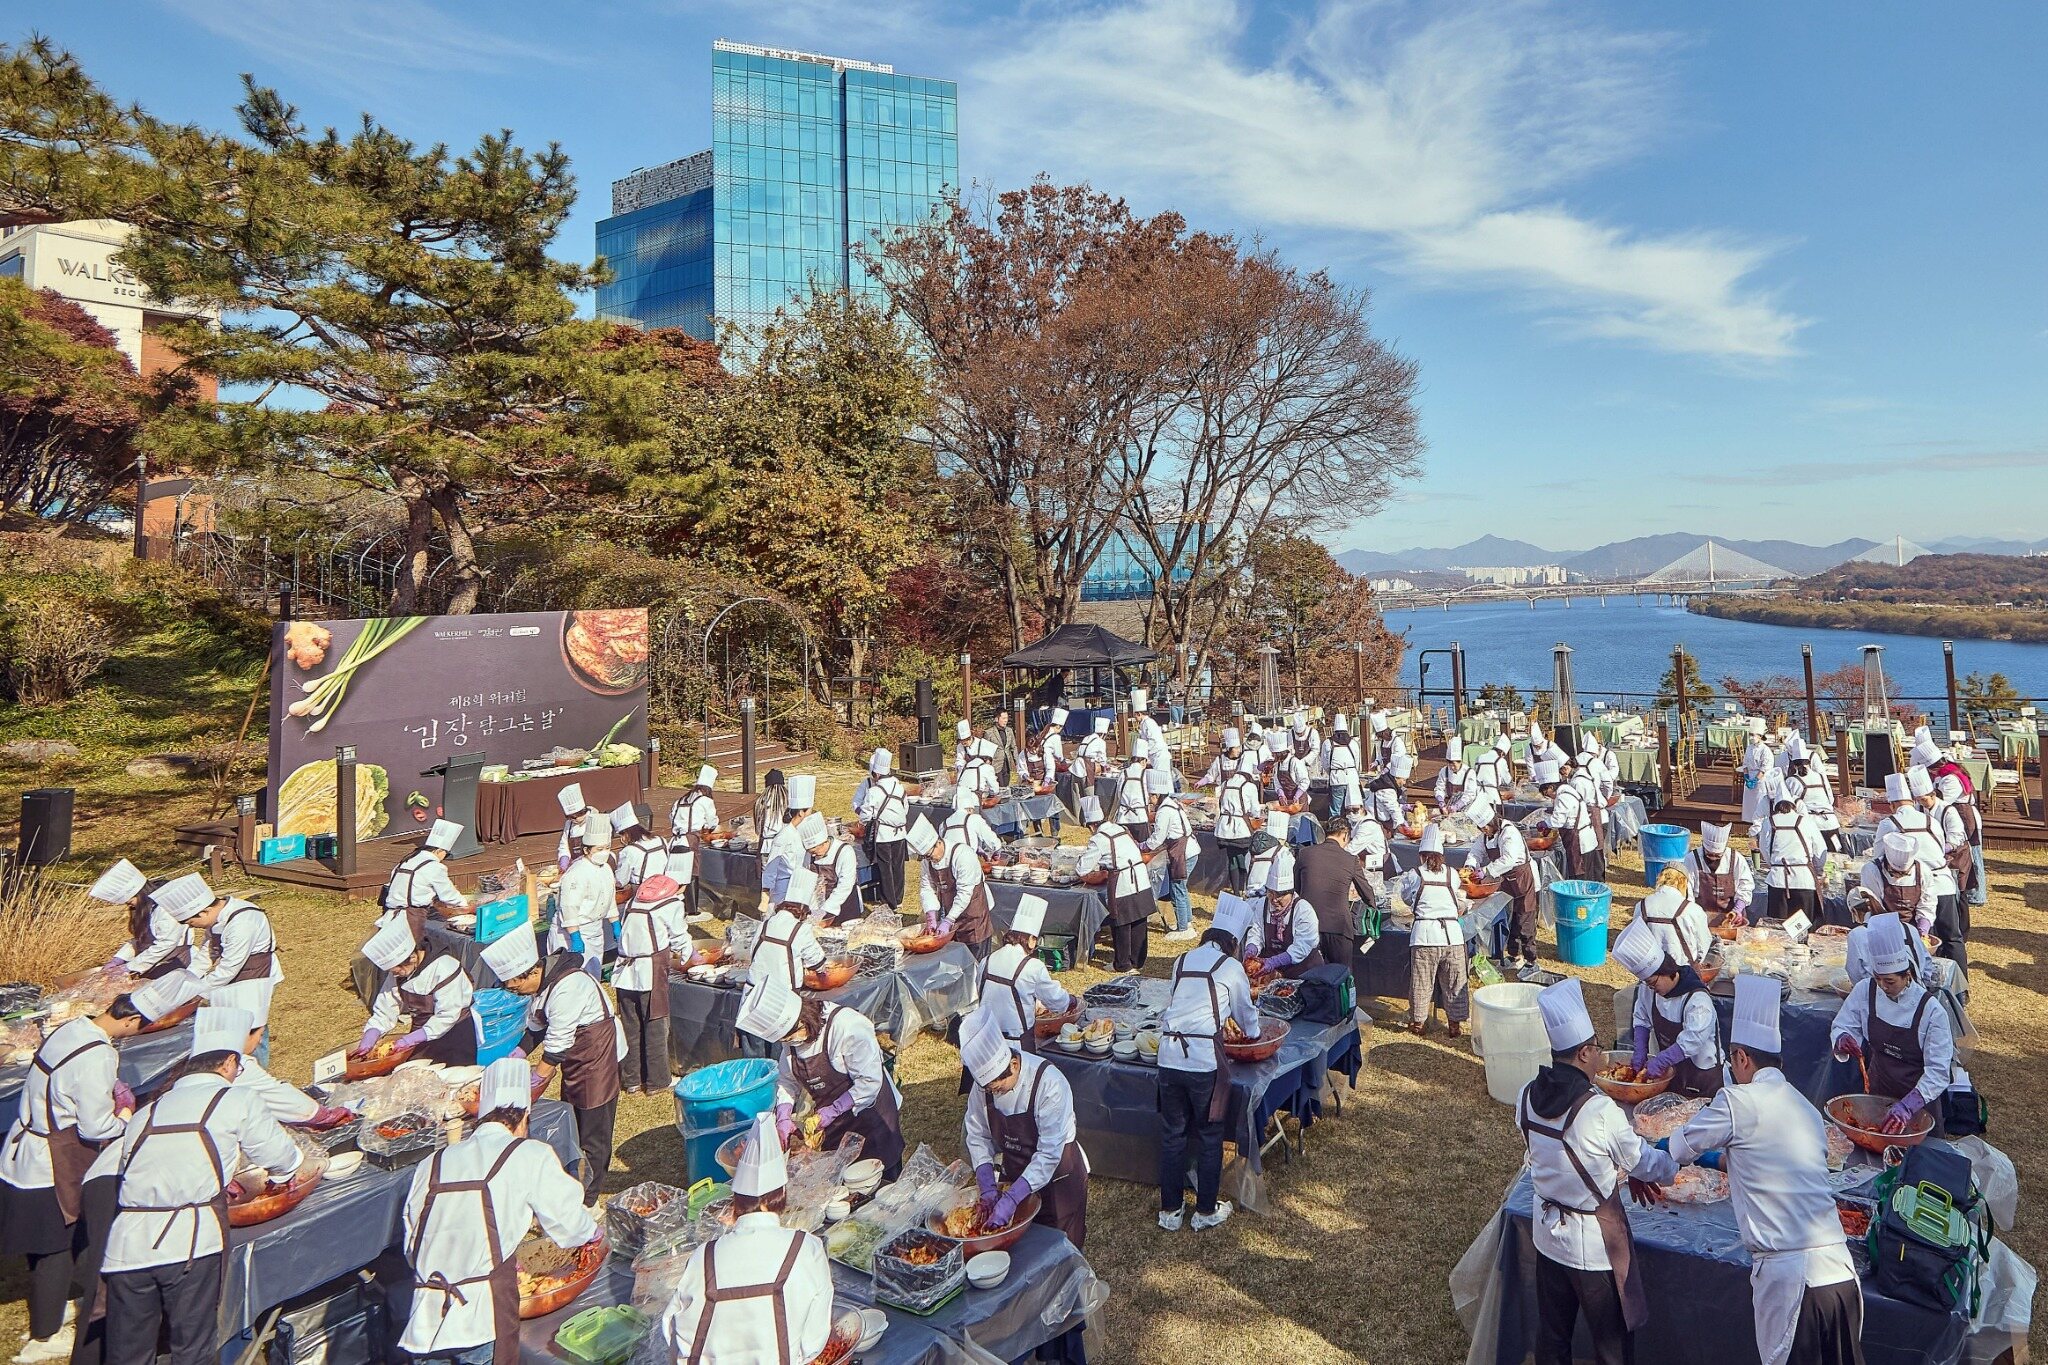
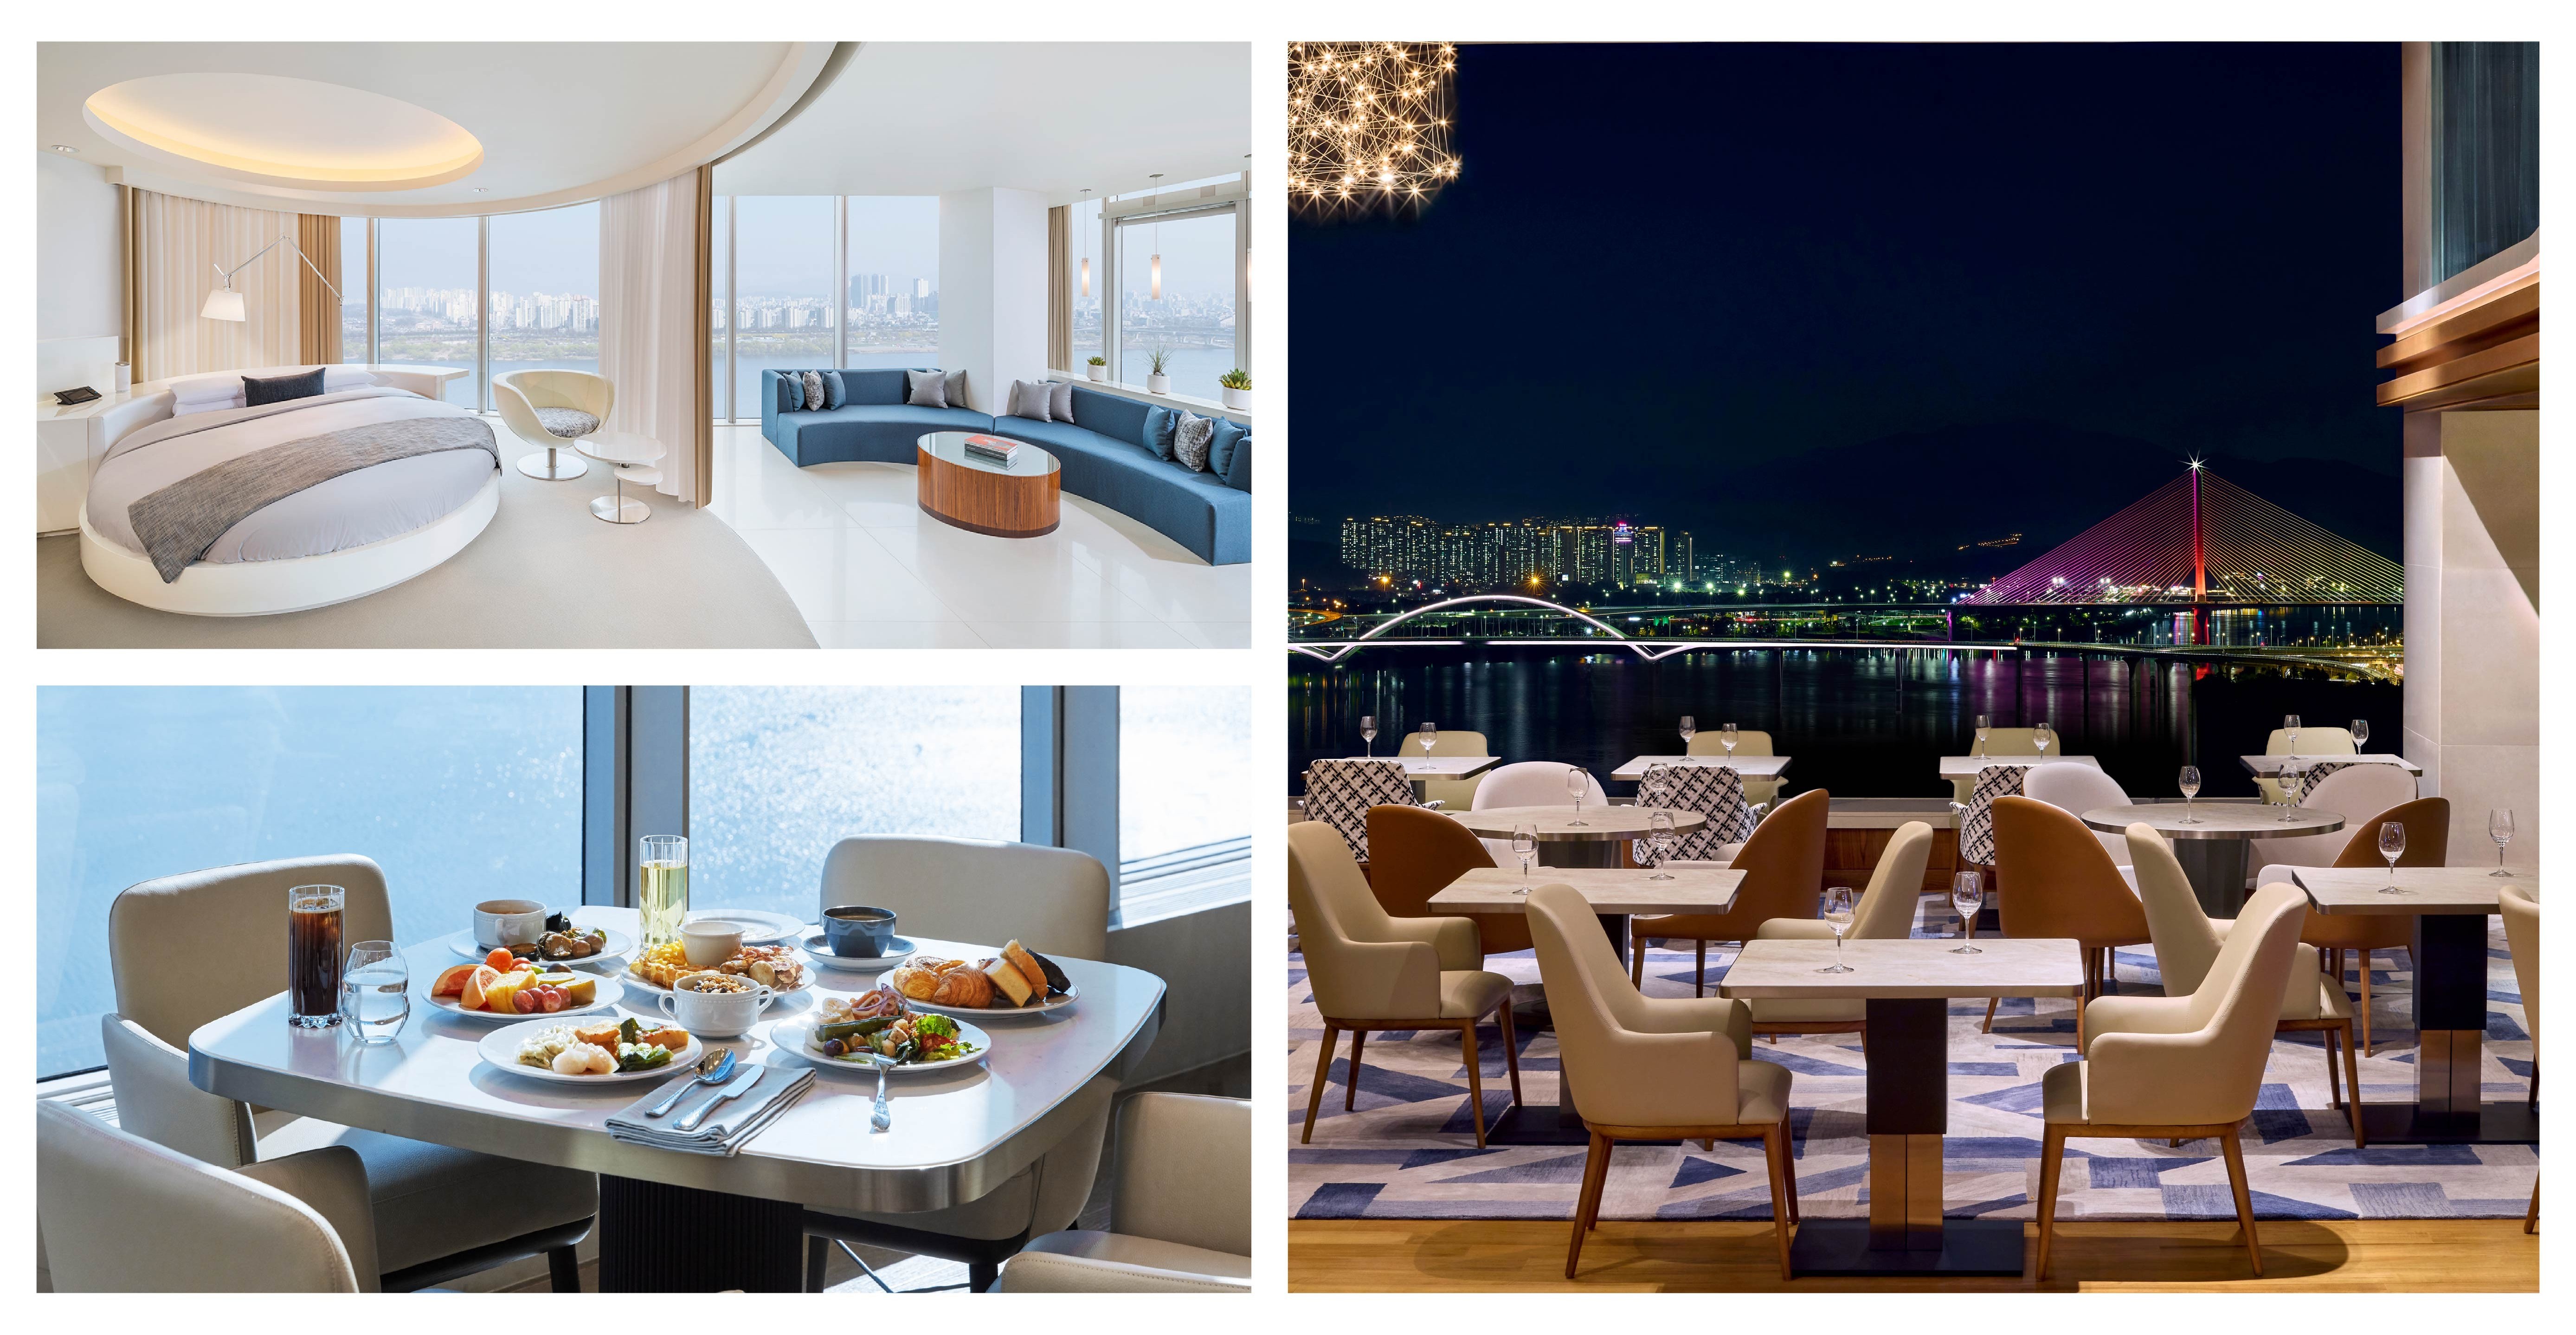
SKNetworksCo., Ltd is a diversified South Korean conglomerate founded in 1953 as a textile company, which has since evolved into a business group focused on ICT distribution, global trading, automotive services, environmental home appliances, and hospitality. Its ICT division operates as a major mobile phone distributor in South Korea, handling handset wholesale, logistics, and the Minpat brand for used phone recycling and trading. The group's automotive segment, led by SK Speedmate, provides vehicle maintenance, tire and battery services, parts distribution, and emergency roadside assistance. In the environmental appliance sector, SK Intelix (formerly SK Magic) offers rental services for water purifiers, air purifiers, and bidets, and has launched the Namux brand for wellness robotics. The hospitality division operates the Walkerhill hotel and resort complex in Seoul, including Grand Walkerhill Seoul and Vista Walkerhill Seoul. Additionally, the group engages in global trading of chemicals and materials through Glowide, and provides data management and AI-ready data platform solutions through Enco. SKNetworks also holds stakes in digital marketing and creator economy platforms, integrating AI technologies across its various business units to serve both consumer and corporate markets in South Korea and internationally. Summarised from the company's own disclosures, fiscal year ended Mar 2026 |
Industry Conglomerates | Homepage sknetworks.co.kr |
| Sector Industrials | IR page sknetworks.co.kr/ir | |
|
Tags
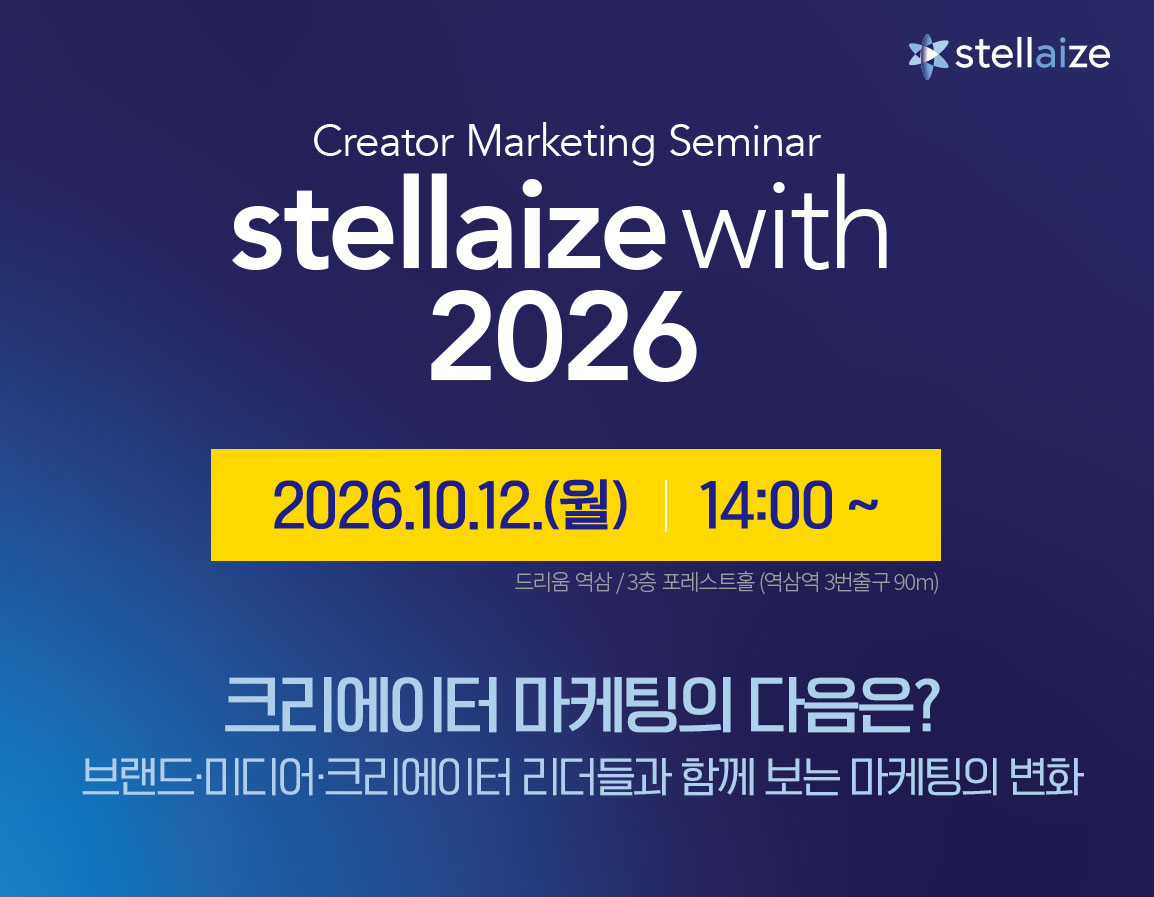
ict device distribution, mobile phone wholesale, used phone recycling, automotive maintenance, auto parts distribution, emergency roadside service, environmental appliance rental, water purifiers, air purifiers, wellness robotics, hotel and resort, global trading chemicals, SKNetworksService, Minpat, SKSpeedmate, HuckleberryPro, Walkerhill, GrandWalkerhillSeoul, VistaWalkerhillSeoul, DouglasHouse, Darakhyu, Glowide, SKIntelix, Namux, WellnessRobotA1, Enco, Dataware, Inkross, StellaisWith
|
Press page — |
Metrics
| Valuation | |
|---|---|
| Market cap | ₩ 1.339T |
| Market cap (USD) | $ 985.123M |
| P/E | 10.83 |
| PEG | — |
| P/BV | 0.63 |
| P/S | 0.20 |
| P/OCF | -47.18 |
| P/FCF | -12.90 |
| Dividend yield | — |
| Turnover / mcap | — |
| Returns | |
|---|---|
| ROE | 2.4% |
| ROI | 2.5% |
| ROIC | 4.1% |
| Profit margin | 0.74% |
| Growth | |
|---|---|
| Revenue growing | No |
| Profits growing | Yes |
| Revenue up 3y | No |
| Revenue up 5y | No |
| Earnings growth 3y (net profit CAGR) | -16.8% |
| Quality | |
|---|---|
| Profitable | Yes |
| Margin expanding | No |
| Buying back stock | — |
| Diluting (TTM) | No |
| Debt/Equity | — |
| Podcast bulls (TTM) | Sign up |
| Podcast bears (TTM) | Sign up |
| Podcast sentiment (TTM) | Sign up |
| Podcast sentiment % (TTM) | Sign up |
| News sentiment (TTM) | — |
| Quality score | -12.5% |
| Insiders | |
|---|---|
| Buys, 1w | Sign up |
| Buys, 1m | Sign up |
| Buys, 1y | Sign up |
| Sells, 1w | Sign up |
| Sells, 1m | Sign up |
| Sells, 1y | Sign up |
Sign up to see this company's insider trades
| Figure | FY 2025 | FY 2024 | FY 2023 | FY 2022 | FY 2021 | FY 2020 | FY 2019 | FY 2018 | FY 2017 | FY 2016 | FY 2015 | FY 2014 | FY 2013 |
|---|---|---|---|---|---|---|---|---|---|---|---|---|---|
| Revenue | 6.745T | 7.657T | 9.134T | 7.811T | 10.746T | 10.626T | 13.054T | 13.986T | 15.202T | 18.457T | 20.356T | 21.578T | 25.975T |
| Net profit | 49.821B | 47.835B | -711M | 86.44B | 98.672B | 34.495B | -131.538B | 7.252B | 33.412B | -81.572B | 73.039B | 31.618B | -591.815B |
| Free cash flow | 144.153B | 147.135B | 25.209B | -455.382B | 232.69B | -360.904B | 247.956B | -326.108B | -791.383B | -89.631B | -5.189B | -389.347B | 287.72B |
Filed figures
Lines the statements and their notes report beside the headline figures, read from the filings' XBRL as filed (no restatement applied), with figures computed from one filing's own lines. Cash-flow lines carry their cash direction: an outflow is negative. Each period links to its filing; a figure's period, report date and tag are in its tooltip.
| Figure | Dec 2016 | Dec 2017 | Dec 2018 | Dec 2019 | Dec 2020 | Dec 2021 | Dec 2022 | Dec 2023 | Dec 2024 | Dec 2025 |
|---|---|---|---|---|---|---|---|---|---|---|
| Balance sheet detail | ||||||||||
| Trade receivables (KRW) | 1.44T | 1.15T | 1.14T | 912B | 756B | 779B | 636B | 552B | 506B | 512B |
| ↳ YoY growth | +16.1% | -20.2% | -0.1% | -20.3% | -17.1% | +3.0% | -18.3% | -13.3% | -8.3% | +1.3% |
| ↳ 5y CAGR | -5.2% | -9.0% | -9.4% | -11.5% | -11.1% | -13.6% | -11.1% | -7.5% | ||
| Borrowings, current (KRW) | 1.01M | 417B | 849B | 935B | 951B | — | 925B | 1.47T | 555B | 560B |
| Borrowings, non-current (KRW) | 1.56T | — | — | — | — | 1.94T | 2.48T | 2.25T | 881B | 969B |
| Lease liabilities (KRW) | — | — | — | 959B | 866B | 1.37T | 585B | 693B | 167B | 171B |
| Cash and deposits (KRW) | 696B | 263B | 484B | 497B | 861B | 1.37T | 356B | 337B | 444B | 448B |
| Intangible assets (KRW) | 560B | — | — | — | — | 780B | 825B | 870B | 625B | 640B |
| Right-of-use assets (KRW) | — | — | — | 1.45T | 1.36T | 1.31T | 997B | 691B | 117B | 133B |
| Net debt (borrowings + leases - cash) (KRW) | 866B | 154B | 364B | 1.4T | 956B | 1.93T | 1.15T | 2.61T | 1.16T | 1.25T |
| Cash flow detail | ||||||||||
| Operating cash flow (KRW) | 14.6B | -635B | -199B | 466B | -150B | 461B | -317B | 127B | 276B | 222B |
| Purchases of property, plant and equipment (KRW) | -104B | -157B | -127B | -218B | -211B | -229B | -138B | -102B | -129B | -78.1B |
| Purchases of intangible assets (KRW) | -6.93B | -4.7B | -3.33B | -4.3B | -16.2B | -9.31B | -14.9B | -30.1B | -3.66B | -2.1B |
| Dividends paid (cash effect) (KRW) | -24.8B | -24.8B | — | — | — | -26.2B | -26.2B | -27.9B | -59.9B | -48.5B |
| Share buybacks (cash effect) (KRW) | — | -54.5B | — | — | — | — | 0.00 | -100B | -42.6B | -5M |
| Interest paid (cash effect) (KRW) | -86.8B | -80.8B | -80.7B | -154B | -123B | -115B | -131B | -185B | -154B | -67.1B |
| Income taxes paid (cash effect) (KRW) | -17.7B | 40M | — | — | — | -60.7B | -43B | -16.1B | -550M | -27.2B |
| Free cash flow (OCF - PPE - intangibles) (KRW) | -96.6B | -796B | -329B | 244B | -377B | 223B | -470B | -4.88B | 143B | 142B |
| Income detail | ||||||||||
| Total comprehensive income (KRW) | -75.2B | 22.3B | -2.15B | -127B | 63.8B | 179B | 85.2B | -35.5B | 8.76B | 28B |
| Comprehensive income to owners (KRW) | -74.7B | 21.6B | -2.22B | -136B | 56.9B | 173B | 79.4B | -41.6B | 10.4B | 27.7B |
| Reported | Apr 2, 2018 | Apr 2, 2018 | Apr 1, 2019 | Mar 30, 2020 | Mar 19, 2021 | Mar 19, 2024 | Mar 19, 2024 | Nov 14, 2024 | Mar 18, 2025 | Mar 18, 2026 |
Sign up to see institutional holdings
Sign UpPodcast Mentions
Sign up to see podcast mentions and sentiment
Sign UpDisclosures filed with DART (material events and exchange disclosures), newest first, headlines as filed in Korean. The link opens the filing on DART. Press releases from the company's own website, newest first.
“생성형 AI에 월평균 3만 6천 원 쓴다”… 인크로스, 2026 ‘아이엠 리포트’ 발표
Bull 0
Bear 0
Routine
- 2026-10-30
인쇄 공유
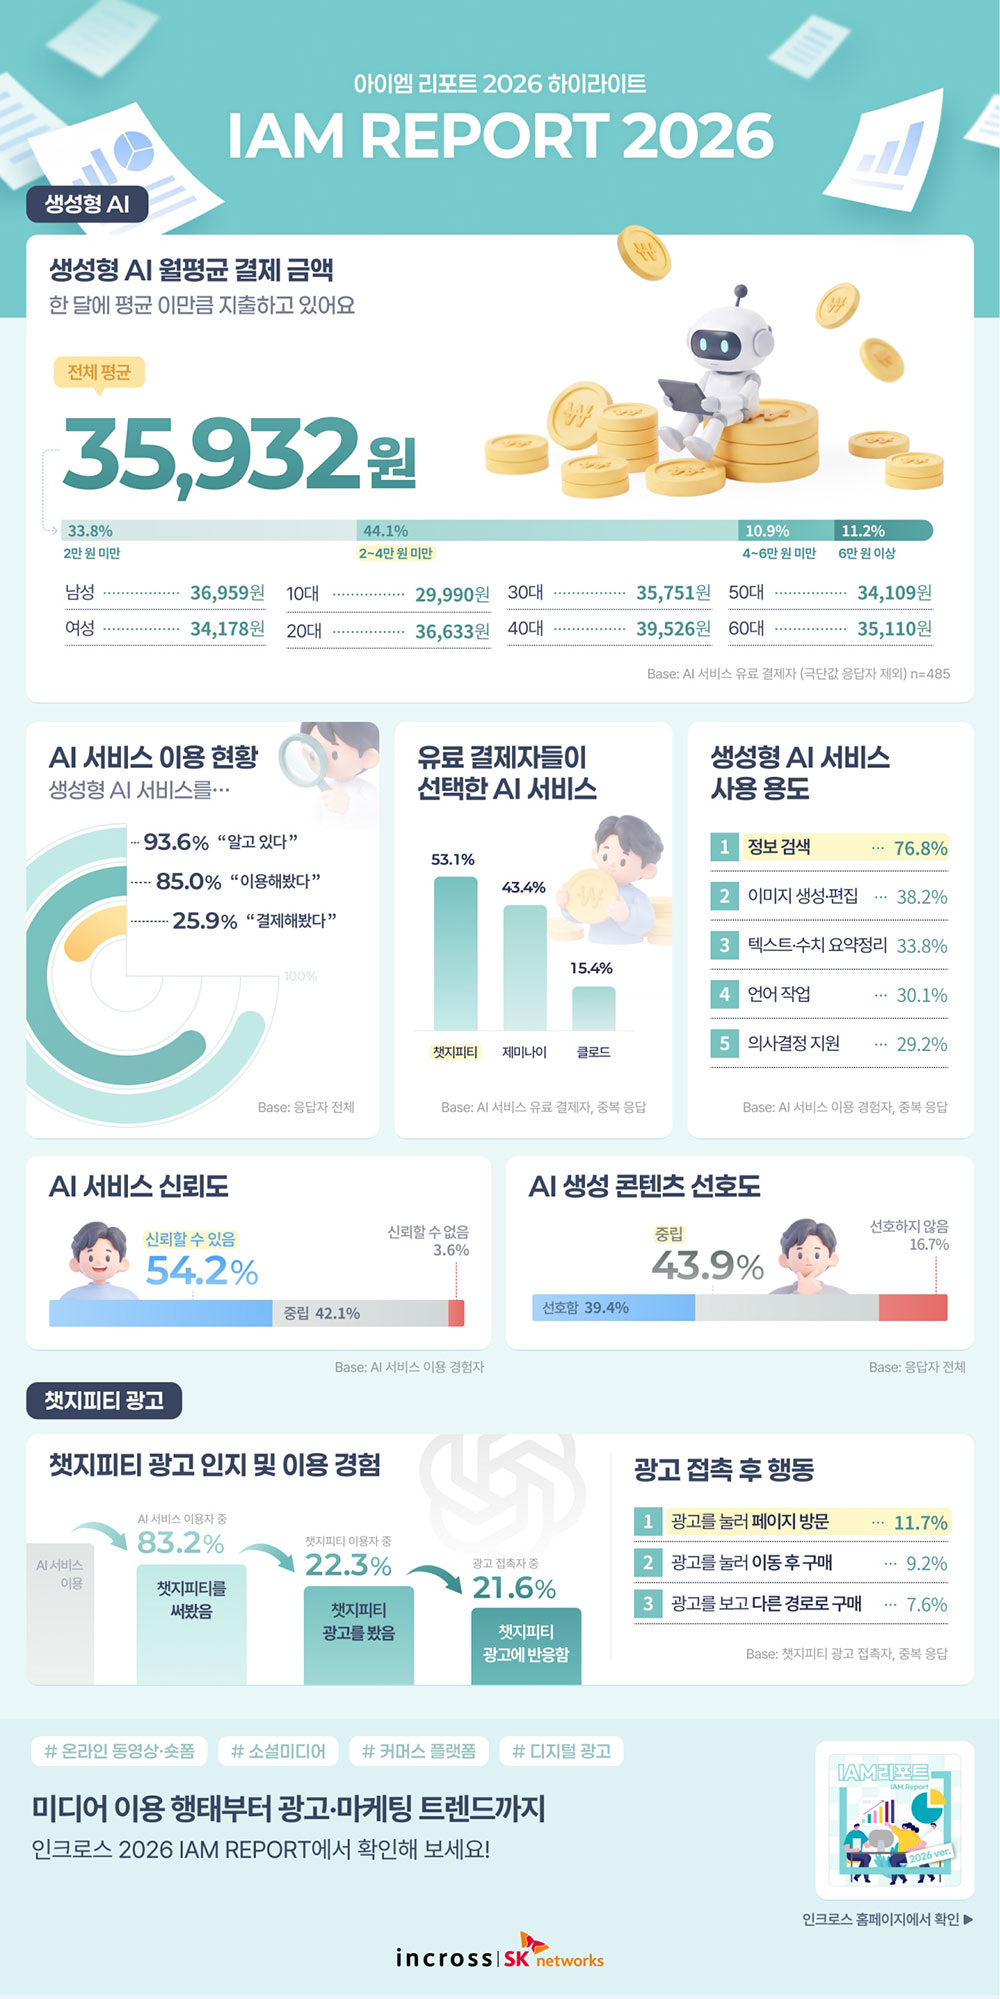
○ 생성형 AI 유료 결제자 월평균 3만 5,932원 지출… 40대 3만 9,526원으로 가장 높아
○ AI****이용률 85.0%, 유료 결제율 25.9%... AI 서비스 이용 및 유료 소비 확대
○ ‘AI****서비스 신뢰한다’ 54.2%, ‘AI 생성 콘텐츠 선호한다’ 39.4%... 소비자 인식에도 주목
통합 마케팅 전문 기업 인크로스(대표 손윤정)는 전국 만 15~69세 남녀 2,000명을 대상으로 실시한 디지털 미디어 이용 행태 조사를 바탕으로 ‘2026 아이엠 리포트(IAM Report)’를 발표했다고 30일 밝혔다.
이번 조사에 따르면 생성형 인공지능(AI) 서비스 유료 결제자의 월평균 결제금액은 3만 5,932원으로 나타났다. AI 서비스 이용 경험이 확대되고 유료 결제 이용자도 증가하는 가운데, 소비자들이 AI 서비스에 실제로 지출하는 금액과 AI 기술 및 콘텐츠에 대한 인식도 함께 확인됐다.
결제금액 구간별로는 월 2만 원4만 원이 44.1%로 가장 높은 비중을 차지했으며, 2만 원 미만은 33.8%, 4만 원 6만 원은 10.9%, 6만 원 이상은 11.2%로 조사됐다. 연령별로는 40대의 월평균 결제금액이 3만 9,526원으로 가장 높았으며, 10대는 2만 9,990원으로 가장 낮았다.
생성형 AI 서비스 이용률도 높은 수준을 기록했다. 전체 응답자 중 ‘이용 경험이 있다’고 응답한 비율은 85.0%로 전년(73.4%) 대비 11.6%p 상승했다. 또한 ‘AI 서비스를 유료 결제 중’이라는 응답은 25.9%로 전년(21.3%)보다 4.6%p 증가했다. 유료 결제 서비스로는 챗GPT가 53.1%로 가장 높은 비중을 차지했으며, 구글 제미나이(Gemini)가 43.4%, 클로드(Claude)가 15.4%로 뒤를 이었다.
AI 서비스 이용 목적도 다양해지고 있다. 생성형 AI 이용자들이 가장 많이 꼽은 활용 목적은 ‘정보 검색(76.8%)’이었으며 ‘이미지 생성 및 편집(38.2%)’, ‘텍스트·수치 요약정리(33.8%)’, ‘언어 작업(30.1%)’, ‘의사결정 지원(29.2%)’ 순으로 나타났다. 이는 생성형 AI가 정보 탐색뿐 아니라 콘텐츠 제작과 문서 작업, 의사결정 지원 등 일상과 업무의 다양한 영역에서 활용되고 있음을 보여준다.
AI 서비스 이용이 보편화되는 가운데 소비자들의 신뢰도 역시 긍정적인 수준으로 나타났다. AI 서비스 이용자를 대상으로 신뢰도를 조사한 결과, ‘신뢰할 수 있다’는 긍정 응답이 54.2%로 과반을 차지했다. ‘신뢰할 수 없다’는 부정 응답은 3.6%에 그쳤으며, 중립 응답은 42.1%로 조사됐다. 연령별로는 50대의 긍정 응답률이 62.6%로 가장 높았으며, 60대 역시 59.6%로 비교적 높은 신뢰도를 보였다.
반면 AI가 생성한 콘텐츠에 대한 선호도에서는 다른 양상이 나타났다. AI가 생성한 콘텐츠를 ‘선호한다’는 응답은 39.4%, ‘선호하지 않는다’는 응답은 16.7%였으며, ‘중립’ 응답이 43.9%로 가장 높은 비율을 차지했다. 이는 AI의 활용이 일상화되는 가운데서도 소비자들이 AI 생성 콘텐츠에 대해서는 상대적으로 신중한 태도를 보이고 있음을 시사한다.
생성형 AI 서비스 내 광고에 대한 소비자 인식도 확인됐다. 챗GPT 이용자 중 22.3%는 챗GPT에서 ‘광고를 접한 적이 있다’고 응답했으며, 광고 접촉자의 11.7%는 광고의 버튼이나 링크를 눌러 제품·서비스 페이지에 방문한 경험이 있으며, ‘광고 버튼이나 링크를 통해 제품/서비스를 구매한 적 있다’는 응답도 9.2%로 나타났다. 이는 생성형 AI 서비스가 새로운 광고 접점으로 주목받는 가운데 이용자들의 실제 광고 접촉 및 반응을 살펴볼 수 있는 결과다.
이밖에도 이번 리포트에는 온라인 동영상 및 숏폼 서비스 이용 현황, 소셜미디어 이용 행태, 커머스 플랫폼 이용 경험, 디지털 광고 접촉과 구매 행동 등 다양한 조사 결과가 수록됐다. 보고서 전문은 인크로스 홈페이지에서 확인할 수 있다.
이전글 SK매직, 정수기 위생 관리요령 소개···상시 관리에 전문가 정기 점검 더해야 다음글 엔코아 IT·AI 교육기관 플레이데이터, 오프라인 교육 수강생 3,500명 돌파
기업설명회(IR)개최(안내공시)
Bull 0
Bear 0
Routine








Prompts
Click prompts to add them under the company line, click again to take one out, then copy the result into your AI chat. Shared by Asian Century Stocks and Uncovered Thai Stocks. Thank you.
SKNetworksCo., Ltd (ticker 001740), listed in South Korea.
Copied
ETFs Holding SKNetworksCo., Ltd
Exchange-traded funds whose newest published daily portfolio holds one of the company's listings, largest weight first.
| ETF | Weight in ETF | Shares | Market value | As of |
|---|---|---|---|---|
| EYLD | 0.81% | 1,347,856 | $ 6.92M | Jul 31, 2026 |
| AVES | 0.08% | 288,525 | $ 1.134M | Nov 16, 2026 |
| AVEE | 0.04% | 13,330 | $ 52.378K | Nov 16, 2026 |
| DEXC | 0.02% | 11,544 | $ 49.371K | Nov 12, 2026 |
| DFEV | 0.01% | 74,021 | $ 316.569K | Nov 12, 2026 |
| AVEM | 0.01% | 789,755 | $ 3.103M | Nov 16, 2026 |
| AVSE | 0.01% | 4,678 | $ 18.381K | Nov 16, 2026 |
| AVXC | 0.01% | 7,957 | $ 31.266K | Nov 16, 2026 |
| DFEM | 0.01% | 156,753 | $ 670.393K | Nov 12, 2026 |
| DFAE | 0.00% | 83,674 | $ 357.853K | Nov 12, 2026 |
| DFSE | 0.00% | 4,654 | $ 19.904K | Nov 12, 2026 |
| DFAX | 0.00% | 82,255 | $ 351.784K | Nov 12, 2026 |