단일판매ㆍ공급계약체결
Bull 5
Bear 0
Order/contract
001440
|
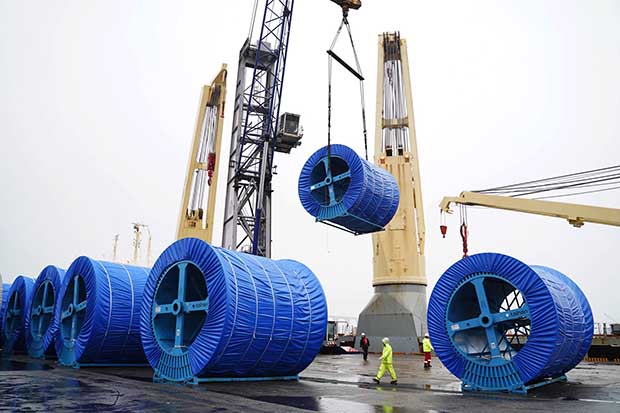
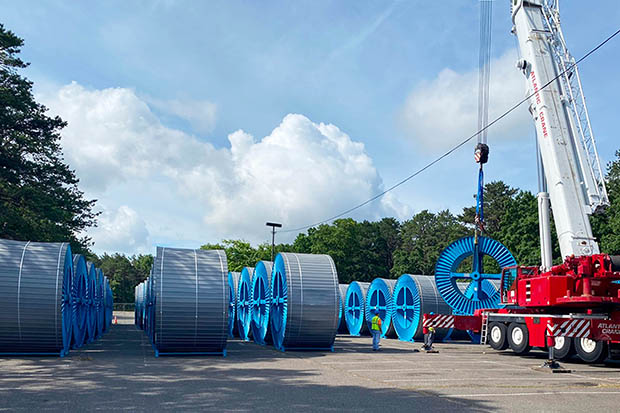
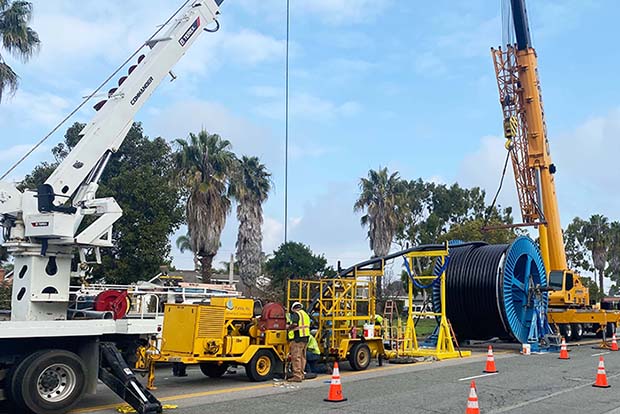
Taihan Cable & Solution is a South Korean manufacturer of power, communication, and submarine cables, operating as a single business segment. The company produces ultra-high voltage (UHV) cables, high-voltage direct current (HVDC) cables, submarine cables, communication cables, and cable materials such as copper rods. It provides comprehensive turnkey solutions including design, manufacturing, installation, and maintenance for power infrastructure projects. Key subsidiaries include Taihan VINA, Taihan Kuwait, Saudi Taihan, M-TEC, and Taihan Ocean Works. The company serves customers in the Americas, Europe, the Middle East, and Asia, with major clients including Korea Electric Power Corporation. Founded in 1941 as Chosun Wire & Cable, it was incorporated in 1955 and joined the Hoban Group in 2021. Production facilities are located in South Korea, Vietnam, South Africa, and Saudi Arabia. Summarised from the company's own disclosures, fiscal year ended Mar 2026 |
Industry Electrical Equipment & Parts | Homepage taihan.com |
| Sector Industrials | IR page taihan.com/news/ir | |
|
Tags
power cables, submarine cables, hvdc cables, communication cables, cable materials, turnkey solutions, renewable energy infrastructure, grid infrastructure, Taihan VINA, Taihan Kuwait, Saudi Taihan, M-TEC, Taihan Ocean Works, Taihan USA, Taihan Netherlands, Taihan Global Holdings, Optomagic, Taihan Techren, Taihan ST
|
Press page — |
Metrics
| Valuation | |
|---|---|
| Market cap | ₩ 4.471T |
| Market cap (USD) | $ 3.29B |
| P/E | -333.03 |
| PEG | — |
| P/BV | 2.38 |
| P/S | 1.08 |
| P/OCF | -10.61 |
| P/FCF | -7.50 |
| Dividend yield | — |
| Turnover / mcap | — |
| Returns | |
|---|---|
| ROE | 5.5% |
| ROI | 5.3% |
| ROIC | 8.0% |
| Profit margin | 2.3% |
| Growth | |
|---|---|
| Revenue growing | Yes |
| Profits growing | Yes |
| Revenue up 3y | Yes |
| Revenue up 5y | Yes |
| Earnings growth 3y (net profit CAGR) | 59.9% |
| Quality | |
|---|---|
| Profitable | Yes |
| Margin expanding | Yes |
| Buying back stock | — |
| Diluting (TTM) | No |
| Debt/Equity | — |
| Podcast bulls (TTM) | Sign up |
| Podcast bears (TTM) | Sign up |
| Podcast sentiment (TTM) | Sign up |
| Podcast sentiment % (TTM) | Sign up |
| News sentiment (TTM) | — |
| Quality score | 18.8% |
| Insiders | |
|---|---|
| Buys, 1w | Sign up |
| Buys, 1m | Sign up |
| Buys, 1y | Sign up |
| Sells, 1w | Sign up |
| Sells, 1m | Sign up |
| Sells, 1y | Sign up |
Sign up to see this company's insider trades
| Figure | FY 2025 | FY 2024 | FY 2023 | FY 2022 | FY 2021 | FY 2020 | FY 2019 | FY 2018 | FY 2017 | FY 2016 | FY 2015 | FY 2014 | FY 2013 |
|---|---|---|---|---|---|---|---|---|---|---|---|---|---|
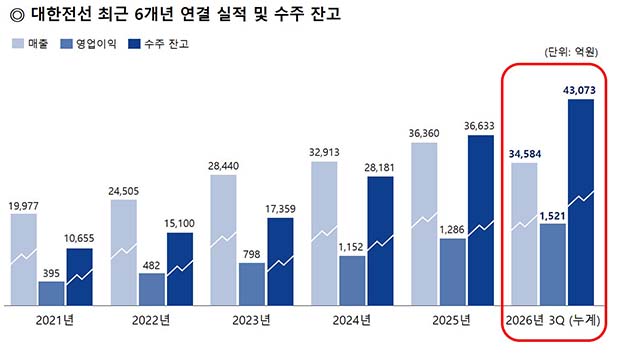
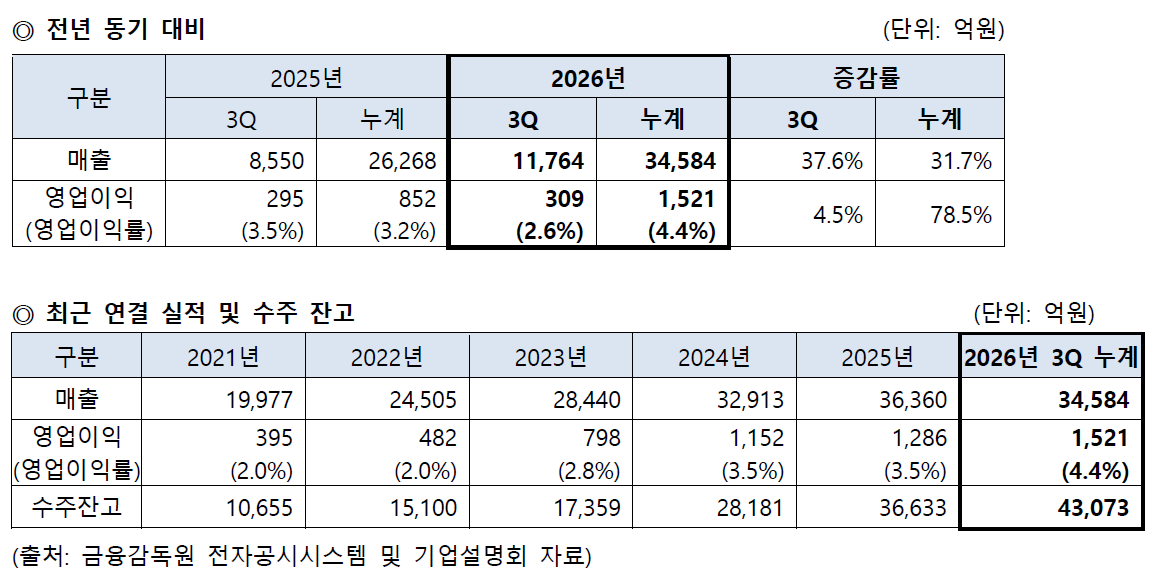
| Revenue | 3.636T | 3.291T | 2.844T | 2.451T | 1.998T | 1.597T | 1.555T | 1.649T | 1.588T | 1.374T | 1.689T | 2.118T | 2.513T |
| Net profit | 84.221B | 70.445B | 70.616B | 20.583B | 27.93B | 2.957B | -11.999B | -2.953B | -43.386B | -17.978B | -44.684B | -217.059B | -582.526B |
| Free cash flow | -326.446B | -122.209B | -95.3B | -59.94B | -26.688B | 10.033B | 72.802B | 3.68B | 10.504B | -17.295B | -128.931B | -118.813B | 9.537B |
Filed figures
Lines the statements and their notes report beside the headline figures, read from the filings' XBRL as filed (no restatement applied), with figures computed from one filing's own lines. Cash-flow lines carry their cash direction: an outflow is negative. Each period links to its filing; a figure's period, report date and tag are in its tooltip.
| Figure | Dec 2016 | Dec 2017 | Dec 2018 | Dec 2019 | Dec 2020 | Dec 2021 | Dec 2022 | Dec 2023 | Dec 2024 | Dec 2025 |
|---|---|---|---|---|---|---|---|---|---|---|
| Balance sheet detail | ||||||||||
| Trade receivables (KRW) | 264B | 295B | 269B | 271B | 267B | 320B | 326B | 396B | 441B | 614B |
| ↳ YoY growth | +8.5% | +11.9% | -8.9% | +0.8% | -1.8% | +20.0% | +2.0% | +21.3% | +11.5% | +39.1% |
| ↳ 5y CAGR | -3.5% | -0.9% | +1.8% | +3.9% | +2.0% | +8.0% | +10.2% | +18.2% | ||
| Borrowings, current (KRW) | 45.1B | 147B | 138B | 163B | 119B | 351B | 82.1B | 165B | 89.7B | 292B |
| Borrowings, non-current (KRW) | 421B | 496B | 451B | 0.00 | 0.00 | 230B | 210B | 225B | 210B | 155B |
| Bonds payable (KRW) | — | — | — | — | — | — | 0.00 | 0.00 | 69.7B | 81.5B |
| Cash and deposits (KRW) | 156B | 109B | 113B | 199B | 131B | 148B | 217B | 289B | 333B | 439B |
| Intangible assets (KRW) | 17.1B | 14.2B | 11.5B | 11.8B | 10.3B | 8.78B | 8.51B | 11.4B | 12.4B | 21.8B |
| Net debt (borrowings + leases - cash) (KRW) | 310B | 534B | 476B | -35.8B | -11.5B | 433B | 74.9B | 101B | -33.8B | 7.21B |
| Cash flow detail | ||||||||||
| Operating cash flow (KRW) | -5.64B | 31.9B | 14.4B | 79.2B | 16.7B | -19.3B | -46.6B | 30.7B | 6.75B | -171B |
| Purchases of property, plant and equipment (KRW) | -11.7B | -21.4B | -10.7B | -6.38B | -6.63B | -7.37B | -13.3B | -126B | -129B | -155B |
| Purchases of intangible assets (KRW) | -567M | 0.00 | 0.00 | -1.52B | -891M | -981M | -1.88B | -4.15B | -1.29B | -5.53B |
| Share buybacks (cash effect) (KRW) | -80M | 0.00 | 0.00 | — | — | 0.00 | 0.00 | -1.55B | 0.00 | 0.00 |
| Interest paid (cash effect) (KRW) | -29.9B | -26.1B | -20.4B | -19B | -17B | -19B | -19.8B | -26.4B | -31.6B | -28.5B |
| Income taxes paid (cash effect) (KRW) | -1.4B | -2.57B | -1.25B | -2.26B | -5.53B | -2.83B | -3.46B | -4.42B | 7.94B | 12.4B |
| Free cash flow (OCF - PPE - intangibles) (KRW) | -17.9B | 10.5B | 3.68B | 71.3B | 9.14B | -27.7B | -61.8B | -99.5B | -124B | -332B |
| Income detail | ||||||||||
| Total comprehensive income (KRW) | -12.1B | -49.5B | -20.2B | -8.84B | 48.3B | 30.7B | 9.07B | 71.8B | 83.2B | 137B |
| Comprehensive income to owners (KRW) | -13.4B | -46.1B | -15.6B | -9.1B | 50B | 29.6B | 7.74B | 71.7B | 77.1B | 129B |
| Reported | Nov 14, 2017 | Mar 29, 2019 | Mar 29, 2019 | Mar 27, 2020 | Mar 18, 2021 | Mar 21, 2024 | Mar 25, 2025 | Mar 25, 2025 | Mar 25, 2025 | Mar 18, 2026 |
Sign up to see institutional holdings
Sign UpPodcast Mentions
Sign up to see podcast mentions and sentiment
Sign UpDisclosures filed with DART (material events and exchange disclosures), newest first, headlines as filed in Korean. The link opens the filing on DART. Press releases from the company's own website, newest first.
연결재무제표기준영업(잠정)실적(공정공시)
Bull 0
Bear 4
Results
공고·공시 - IR
Bull 0
Bear 0
Routine
검색어지우기 검색
추천검색어
IR
2026.10.29
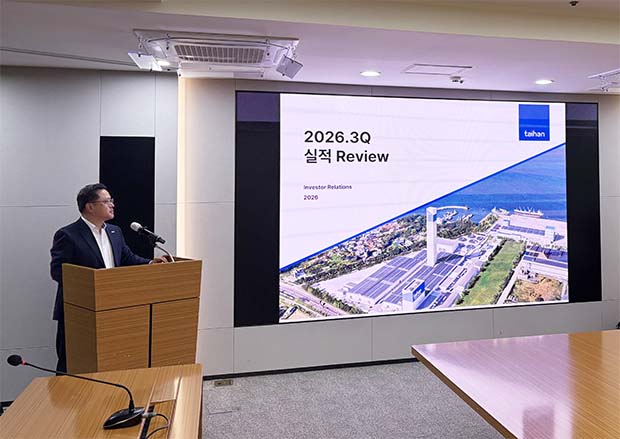
기업 설명회(IR) 자료
일정 : 2026년 10월 29일(목) 15시
장소 : 여의도 하나증권
대상 : 기관투자자 및 애널리스트
주요내용 : 3분기 실적 발표 및 질의응답
첨부 : 기업설명회 IR 자료
첨부파일
26.3Q IR자료 국문.pdf
팝업닫기
대한전선
[서울 사옥] 서울특별시 서초구 양재대로2길 18 호반파크 2관 [안양 본점] 경기도 안양시 동안구 시민대로 317 대한스마트타워 대표번호 : 02-316-9114
COPYRIGHT ⓒ 2022 Taihan Cable & Solution Co., Ltd. ALL RIGHT RESERVED




Prompts
Click prompts to add them under the company line, click again to take one out, then copy the result into your AI chat. Shared by Asian Century Stocks and Uncovered Thai Stocks. Thank you.
Taihan Cable & Solution (ticker 001440), listed in South Korea.
Copied
ETFs Holding Taihan Cable & Solution
Exchange-traded funds whose newest published daily portfolio holds one of the company's listings, largest weight first.
| ETF | Weight in ETF | Shares | Market value | As of |
|---|---|---|---|---|
| DFEV | 0.02% | 30,780 | $ 428.229K | Nov 12, 2026 |
| DFEM | 0.01% | 63,157 | $ 878.677K | Nov 12, 2026 |
| DFSE | 0.01% | 3,629 | $ 50.489K | Nov 12, 2026 |
| DFAE | 0.01% | 44,254 | $ 615.688K | Nov 12, 2026 |
| DEXC | 0.01% | 1,109 | $ 15.429K | Nov 12, 2026 |
| DFAX | 0.00% | 38,042 | $ 529.263K | Nov 12, 2026 |
| AVEM | 0.00% | 12,528 | $ 164.893K | Nov 16, 2026 |
| AVSE | 0.00% | 304 | $ 4,001.23 | Nov 16, 2026 |
| AVXC | 0.00% | 949 | $ 12.491K | Nov 16, 2026 |