분기보고서 (2026.09)
Bull 0
Bear 0
Routine
001230
|
DONGKUK HOLDINGS is a holding company that coordinates the management of its group companies and generates revenue through dividends, management consulting, and trademark licensing. The group operates across four main business segments. The steel segment, led by Dongkuk Steel and Dongkuk Steel Mexico, manufactures and processes hot-rolled, cold-rolled, and coated steel products, including rebar, structural steel, and plates, serving construction, shipbuilding, and automotive customers in South Korea, Mexico, and the United States. The transportation segment, operated by Inter吉斯, provides port handling, land and sea freight, and forwarding services, with a focus on steel scrap logistics and container terminal operations. The trading segment, comprising Dongkuk International Inc. and Dongkuk Corporation, engages in the intermediary trade of steel products and raw materials, primarily in the US and Japanese markets. The other segment includes Dongkuk Systems, which provides IT hardware, software, and ERP solutions, and Ferrum Infra, which manages real estate assets, operates a golf course, and provides MRO procurement services. The group serves customers in South Korea, North America, Japan, and Southeast Asia. Summarised from the company's own disclosures, fiscal year ended Mar 2026 |
Industry Steel | Homepage m.dongkuk.com |
| Sector Basic Materials | IR page — | |
|
Tags
steel manufacturing, steel trading, port logistics, freight forwarding, it services, erp solutions, real estate management, golf course operations, mro procurement, cold-rolled steel, structural steel, steel scrap logistics, Dongkuk Steel, Dongkuk Steel Mexico S.A. de C.V., Dongkuk International Inc., Dongkuk Corporation, Dongkuk Systems, Ferrum Infra, Dongkuk CM, LUXTEEL, DK LP-plate, DK-Deck, Ferrum Club
|
Press page — |
Metrics
| Valuation | |
|---|---|
| Market cap | ₩ 1.163T |
| Market cap (USD) | $ 855.979M |
| P/E | 6.46 |
| PEG | — |
| P/BV | 0.61 |
| P/S | 0.51 |
| P/OCF | -20.82 |
| P/FCF | -11.05 |
| Dividend yield | — |
| Turnover / mcap | — |
| Returns | |
|---|---|
| ROE | 0.94% |
| ROI | 0.90% |
| ROIC | 2.2% |
| Profit margin | 0.81% |
| Growth | |
|---|---|
| Revenue growing | No |
| Profits growing | No |
| Revenue up 3y | No |
| Revenue up 5y | No |
| Earnings growth 3y (net profit CAGR) | -66.1% |
| Quality | |
|---|---|
| Profitable | Yes |
| Margin expanding | No |
| Buying back stock | No |
| Diluting (TTM) | — |
| Debt/Equity | — |
| Podcast bulls (TTM) | Sign up |
| Podcast bears (TTM) | Sign up |
| Podcast sentiment (TTM) | Sign up |
| Podcast sentiment % (TTM) | Sign up |
| News sentiment (TTM) | — |
| Quality score | -25.0% |
| Insiders | |
|---|---|
| Buys, 1w | Sign up |
| Buys, 1m | Sign up |
| Buys, 1y | Sign up |
| Sells, 1w | Sign up |
| Sells, 1m | Sign up |
| Sells, 1y | Sign up |
Sign up to see this company's insider trades
| Figure | FY 2025 | FY 2024 | FY 2023 | FY 2022 | FY 2021 | FY 2020 | FY 2019 | FY 2018 | FY 2017 | FY 2016 | FY 2015 | FY 2014 | FY 2013 |
|---|---|---|---|---|---|---|---|---|---|---|---|---|---|
| Revenue | 1.985T | 1.999T | 1.841T | 2.099T | 1.755T | 5.206T | 5.658T | 5.965T | 6.049T | 5.007T | 5.72T | 6.069T | 6.691T |
| Net profit | 16.075B | 11.744B | 224.999B | 413.042B | 550.532B | 65.095B | -68.509B | -297.855B | 4.53B | 61.289B | -224.393B | -274.305B | -118.409B |
| Free cash flow | 12.75B | 51.014B | 360.181B | 531.93B | -26.675B | 546.728B | 164.67B | 167.545B | 30.558B | — | — | — | — |
Filed figures
Lines the statements and their notes report beside the headline figures, read from the filings' XBRL as filed (no restatement applied), with figures computed from one filing's own lines. Cash-flow lines carry their cash direction: an outflow is negative. Each period links to its filing; a figure's period, report date and tag are in its tooltip.
| Figure | Dec 2016 | Dec 2017 | Dec 2018 | Dec 2019 | Dec 2020 | Dec 2021 | Dec 2022 | Dec 2023 | Dec 2024 | Dec 2025 |
|---|---|---|---|---|---|---|---|---|---|---|
| Balance sheet detail | ||||||||||
| Trade receivables (KRW) | 734B | 806B | 803B | 668B | 631B | 817B | 791B | 316B | 392B | 368B |
| ↳ YoY growth | -37.6% | +9.9% | -0.5% | -16.8% | -5.5% | +29.4% | -3.1% | -60.0% | +24.1% | -6.2% |
| ↳ 5y CAGR | -11.7% | +2.2% | -0.4% | -17.0% | -10.1% | -10.2% | ||||
| Other receivables (KRW) | — | — | — | — | — | 7B | 78.9B | 7.42B | 11.4B | 48.3B |
| Borrowings, current (KRW) | 2.25T | 2.27T | 2.32T | 2.1T | 1.98T | 2.01T | 1.82T | 196B | 190B | 219B |
| Borrowings, non-current (KRW) | 833B | 589B | 371B | 522B | 256B | 180B | 99.5B | 11.5B | 24.1B | 27.2B |
| Lease liabilities (KRW) | — | — | — | 60.9B | 52B | 42.2B | 41.1B | 33.7B | 27.3B | 44.8B |
| Cash and deposits (KRW) | 493B | 379B | 343B | 392B | 269B | 405B | 665B | 259B | 228B | 157B |
| Intangible assets (KRW) | 97.2B | 95.1B | 76B | 52.3B | 52.6B | 49.5B | 49.6B | 16.8B | 13.8B | 13.6B |
| Right-of-use assets (KRW) | — | — | — | 61.8B | 51.5B | 41.7B | 35.9B | 22.7B | 21.6B | 42.3B |
| Net debt (borrowings + leases - cash) (KRW) | 340B | 2.48T | 2.34T | 2.29T | 2.02T | 1.83T | 1.3T | -17.6B | 13.4B | 134B |
| Cash flow detail | ||||||||||
| Operating cash flow (KRW) | 888B | 90.2B | 229B | 213B | 632B | 126B | 693B | 461B | 85.2B | 54.7B |
| Purchases of property, plant and equipment (KRW) | -112B | -59.6B | -61.9B | -48.8B | -84.8B | -152B | -161B | -100B | -34.2B | -41.9B |
| Purchases of intangible assets (KRW) | -598M | -1.3B | -71.8M | -29.4M | -112M | -233M | -752M | -1.41B | -15M | -60.6M |
| Dividends paid (cash effect) (KRW) | -5.17B | -15.8B | -11B | -213M | -202M | -19.3B | -39.4B | -48.2B | -23.9B | -17.3B |
| Share buybacks (cash effect) (KRW) | -1.17B | — | — | — | -7.18B | 0.00 | -34.3B | -543M | 0.00 | 0.00 |
| Interest paid (cash effect) (KRW) | -114B | -109B | -121B | -113B | -95.6B | -67.3B | -75.6B | -54.1B | -10.6B | -9.3B |
| Income taxes paid (cash effect) (KRW) | -10.2B | -37.6B | -4.96B | -5.95B | -11.7B | -27.9B | -161B | -44.6B | -9.1B | -7.52B |
| Free cash flow (OCF - PPE - intangibles) (KRW) | 775B | 29.3B | 167B | 165B | 547B | -26.9B | 531B | 359B | 51B | 12.7B |
| Income detail | ||||||||||
| Total comprehensive income (KRW) | 130B | 98.6B | -338B | -89.1B | 190B | 665B | 554B | 398B | 27.3B | 193B |
| Comprehensive income to owners (KRW) | 122B | 88.5B | -330B | -76B | 183B | 655B | 532B | 392B | 20.4B | 181B |
| Reported | Apr 2, 2018 | Apr 2, 2018 | Apr 1, 2019 | Jun 19, 2020 | Mar 26, 2021 | Mar 29, 2024 | Mar 29, 2024 | Mar 29, 2024 | Mar 18, 2026 | Mar 18, 2026 |
Sign up to see institutional holdings
Sign UpPodcast Mentions
Sign up to see podcast mentions and sentiment
Sign UpDisclosures filed with DART (material events and exchange disclosures), newest first, headlines as filed in Korean. The link opens the filing on DART. Press releases from the company's own website, newest first.


 ](javascript:scrollTo(0,0); $('header').removeClass('noneBG');)


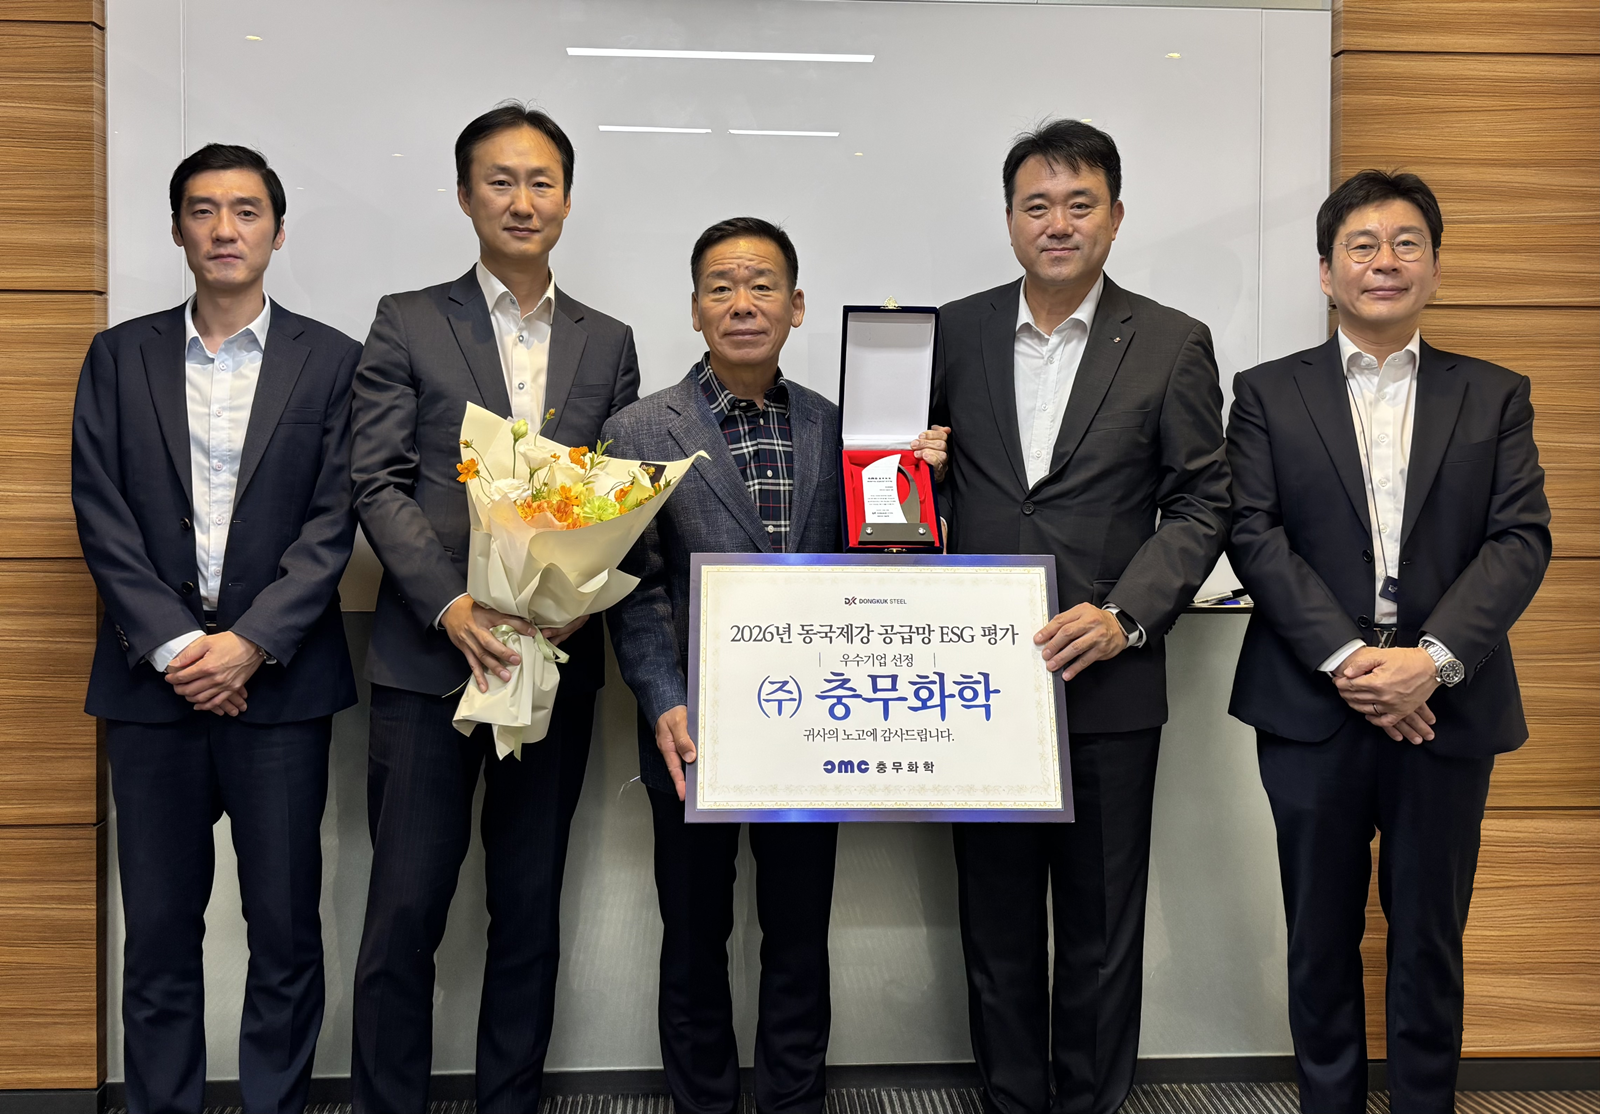
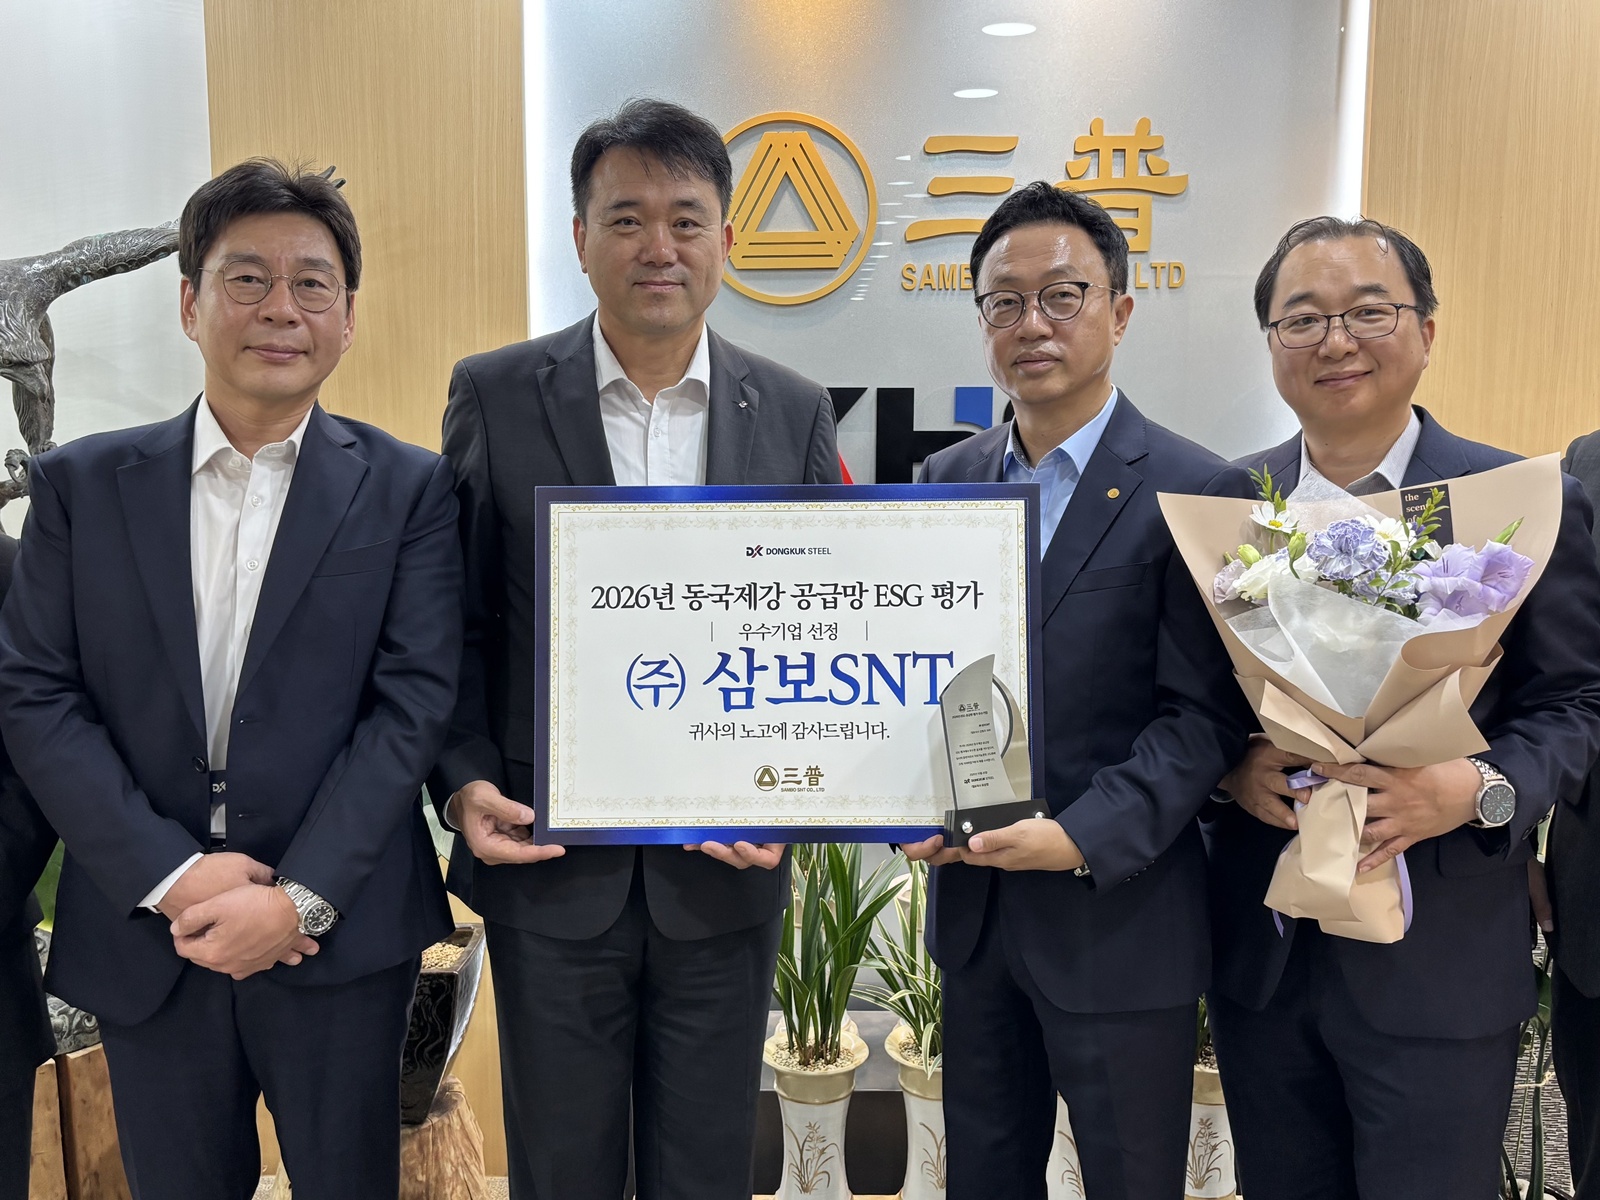


 구매포털(열연)
 고객포털(열연)
 파트너포털(열연)
 검사증명서(열연)
 내방객 시스템


Prompts
Click prompts to add them under the company line, click again to take one out, then copy the result into your AI chat. Shared by Asian Century Stocks and Uncovered Thai Stocks. Thank you.
DONGKUK HOLDINGS (ticker 001230), listed in South Korea.
Copied