기업설명회(IR)개최(안내공시)
Bull 0
Bear 0
Routine
000270
|
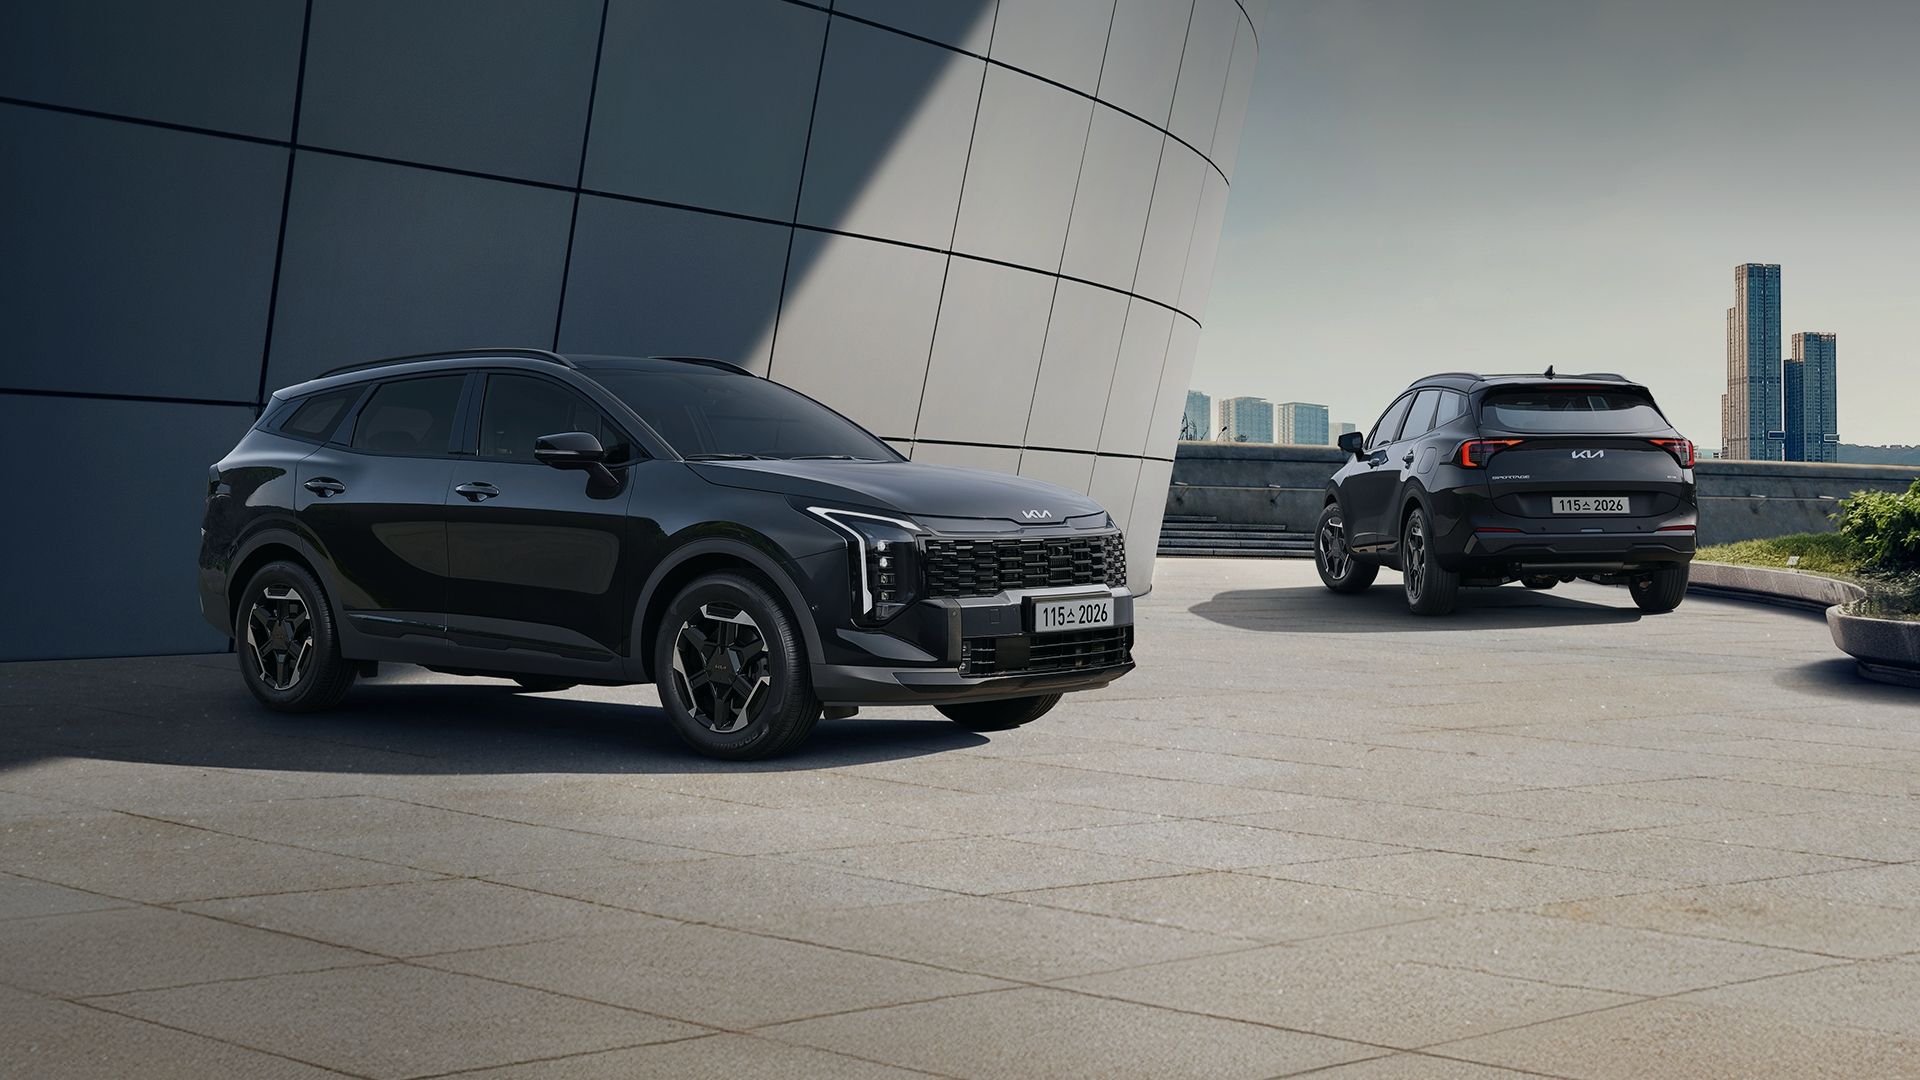
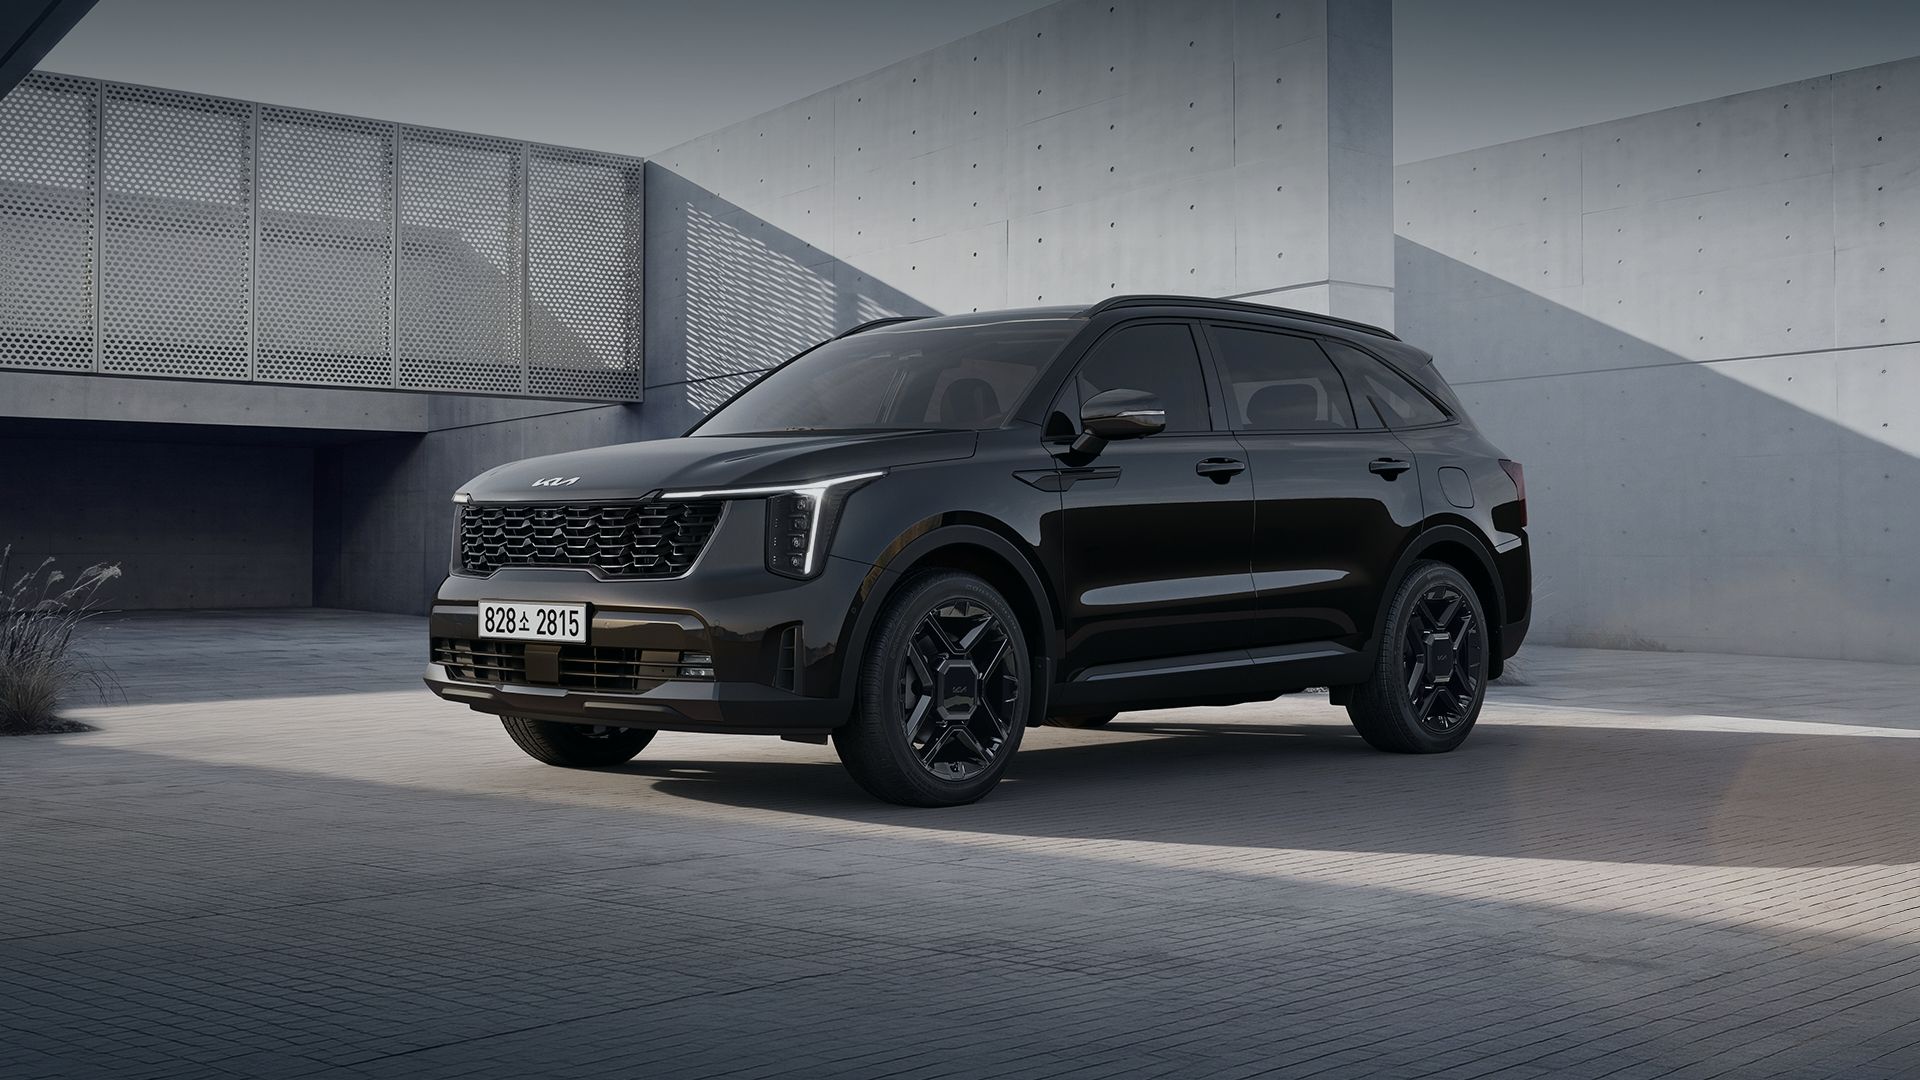
KIA CORP. is an automotive manufacturer that produces and sells complete vehicles and parts, and offers rental and maintenance services. The company's product portfolio includes passenger cars, recreational vehicles (RVs), and commercial vehicles. Key passenger models include the Morning, Ray, K5, K8, K9, and EV4. The RV lineup features the Niro, Seltos, Sportage, Sorento, Carnival, Tasman, EV3, EV5, EV6, EV9, and PV5 Passenger. Commercial offerings include the Bongo truck, large buses, and PV5 Cargo. The company operates production facilities in South Korea, the United States, Slovakia, Mexico, India, and China. It serves domestic and global markets, including North America, Europe, Asia, and Latin America, through local sales subsidiaries and dealerships. KIA CORP. is part of the Hyundai Motor Group and collaborates with affiliates such as Hyundai Motor, Hyundai Mobis, Hyundai Steel, and Hyundai Glovis. The company also operates the Kia PBV Solutions platform, providing software and service solutions for commercial vehicle management, and offers the Kia Members loyalty program. Summarised from the company's own disclosures, fiscal year ended Mar 2026 |
Industry Auto Manufacturers | Homepage kia.co.kr |
| Sector Consumer Cyclical | IR page worldwide.kia.com/kr/company/ir | |
|
Tags
passenger cars, recreational vehicles, commercial vehicles, electric vehicles, hybrid vehicles, purpose-built vehicles, vehicle rental, vehicle maintenance, connected car services, fleet management solutions, Morning, Ray, K5, K8, K9, EV4, Niro, Seltos, Sportage, Sorento, Carnival, Tasman, EV3, EV5, EV6, EV9, PV5 Passenger, Bongo truck, PV5 Cargo, Kia PBV Solutions, Kia Members, Kia App, Kia Connect, Kia Shop, Auto Q, HMG Global LLC, HYUNDAI MOTOR MANUFACTURING RUS, E-FOREST, Hwasung EVO Plant, Kia Connect 2.0, Digital Key 2, The Membership K9
|
Press page kia.com/kr/discover-kia/news |
Metrics
| Valuation | |
|---|---|
| Market cap | ₩ 62.388T |
| Market cap (USD) | $ 45.916B |
| P/E | 8.78 |
| PEG | 0.74 |
| P/BV | 0.96 |
| P/S | 0.52 |
| P/OCF | 5.74 |
| P/FCF | 9.28 |
| Dividend yield | — |
| Turnover / mcap | — |
| Returns | |
|---|---|
| ROE | 12.9% |
| ROI | 12.4% |
| ROIC | 10.9% |
| Profit margin | 6.6% |
| Growth | |
|---|---|
| Revenue growing | Yes |
| Profits growing | No |
| Revenue up 3y | Yes |
| Revenue up 5y | Yes |
| Earnings growth 3y (net profit CAGR) | 11.8% |
| Quality | |
|---|---|
| Profitable | Yes |
| Margin expanding | No |
| Buying back stock | Yes |
| Diluting (TTM) | No |
| Debt/Equity | — |
| Podcast bulls (TTM) | Sign up |
| Podcast bears (TTM) | Sign up |
| Podcast sentiment (TTM) | Sign up |
| Podcast sentiment % (TTM) | Sign up |
| News sentiment (TTM) | — |
| Quality score | 50.0% |
| Insiders | |
|---|---|
| Buys, 1w | Sign up |
| Buys, 1m | Sign up |
| Buys, 1y | Sign up |
| Sells, 1w | Sign up |
| Sells, 1m | Sign up |
| Sells, 1y | Sign up |
Sign up to see this company's insider trades
| Figure | FY 2025 | FY 2024 | FY 2023 | FY 2022 | FY 2021 | FY 2020 | FY 2019 | FY 2018 | FY 2017 | FY 2016 | FY 2015 | FY 2014 | FY 2013 |
|---|---|---|---|---|---|---|---|---|---|---|---|---|---|
| Revenue | 114.141T | 107.449T | 99.808T | 86.559T | 69.862T | 59.168T | 58.146T | 54.17T | 53.536T | 52.713T | 49.521T | 47.097T | 47.598T |
| Net profit | 7.561T | 9.773T | 8.777T | 5.409T | 4.76T | 1.488T | 1.827T | 1.156T | 968.018B | 2.755T | 2.631T | 2.994T | 3.817T |
| Free cash flow | 5.29T | 9.079T | 8.961T | 7.839T | 6.04T | — | — | — | — | — | — | — | — |
Filed figures
Lines the statements and their notes report beside the headline figures, read from the filings' XBRL as filed (no restatement applied), with figures computed from one filing's own lines. Cash-flow lines carry their cash direction: an outflow is negative. Each period links to its filing; a figure's period, report date and tag are in its tooltip.
| Figure | Dec 2016 | Dec 2017 | Dec 2018 | Dec 2019 | Dec 2020 | Dec 2021 | Dec 2022 | Dec 2023 | Dec 2024 | Dec 2025 |
|---|---|---|---|---|---|---|---|---|---|---|
| Balance sheet detail | ||||||||||
| Trade receivables (KRW) | 2.4T | 2.09T | 2.05T | 2.15T | 1.82T | 1.79T | 2.24T | 2.48T | 3.56T | 3.55T |
| ↳ YoY growth | +0.6% | -12.9% | -2.1% | +5.1% | -15.6% | -1.7% | +25.2% | +10.6% | +43.9% | -0.3% |
| ↳ 5y CAGR | -0.2% | -2.3% | -5.3% | -5.7% | +1.3% | +3.8% | +10.6% | +14.3% | ||
| Other receivables (KRW) | 762B | 951B | 1.42T | 1.5T | 1.93T | — | 2.53T | — | 3.16T | — |
| Borrowings, current (KRW) | 4.13T | 3.86T | 2.27T | 2.49T | 5.27T | 4.42T | 3.43T | 1.1T | 1.06T | 1.36T |
| Borrowings, non-current (KRW) | 2.27T | 1.87T | 1.31T | 1.31T | 2.18T | 4.93T | 945B | 2.7T | 2.18T | 979B |
| Bonds payable (KRW) | — | — | — | — | — | 3.3T | 3.1T | 2.5T | 2.18T | 2.13T |
| Cash and deposits (KRW) | 3.06T | 1.56T | 2.29T | 4.27T | 10.2T | 11.5T | 11.6T | 14.4T | 13.6T | 14T |
| Intangible assets (KRW) | 2.3T | 2.47T | 2.51T | 2.55T | 2.67T | 2.83T | 2.91T | 3.31T | 4.09T | 4.81T |
| Right-of-use assets (KRW) | — | — | — | — | — | — | — | 297B | 351B | 370B |
| Net debt (borrowings + leases - cash) (KRW) | 3.34T | 4.17T | 1.29T | -471B | -2.72T | -2.19T | -7.18T | -10.6T | -10.3T | -11.7T |
| Cash flow detail | ||||||||||
| Operating cash flow (KRW) | 3.28T | 2.59T | 4.47T | 3.61T | 5.42T | 7.36T | 9.33T | 11.3T | 12.6T | 9.05T |
| Purchases of property, plant and equipment (KRW) | — | — | — | — | — | -1.32T | -1.49T | -2.34T | -3.49T | -3.76T |
| Purchases of intangible assets (KRW) | — | — | — | — | — | -583B | -602B | -795B | -1.2T | -1.23T |
| Dividends paid (cash effect) (KRW) | — | — | — | — | — | -401B | -1.2T | -1.4T | -2.19T | -2.56T |
| Share buybacks (cash effect) (KRW) | — | — | — | — | — | -38.1B | -110B | -500B | -500B | -700B |
| Interest paid (cash effect) (KRW) | -152B | -196B | -153B | -154B | -224B | -169B | -227B | -197B | -168B | -138B |
| Income taxes paid (cash effect) (KRW) | -754B | -543B | -557B | -177B | -283B | -914B | -2.73T | -2.92T | -3.54T | -3.54T |
| Free cash flow (OCF - PPE - intangibles) (KRW) | — | — | — | — | — | 5.46T | 7.24T | 8.17T | 7.88T | 4.06T |
| Income detail | ||||||||||
| Total comprehensive income (KRW) | 2.82T | 723B | 703B | 2.1T | 1.37T | 5.42T | 5.64T | 8.97T | 11.8T | 8.39T |
| Comprehensive income to owners (KRW) | 2.82T | 723B | 703B | 2.1T | 1.37T | 5.42T | 5.64T | 8.97T | 11.8T | 8.4T |
| Reported | Dec 10, 2021 | Dec 10, 2021 | Dec 10, 2021 | Dec 10, 2021 | Dec 10, 2021 | Mar 12, 2024 | Mar 12, 2024 | Mar 12, 2026 | May 15, 2025 | Mar 12, 2026 |
Sign up to see institutional holdings
Sign UpPodcast Mentions
Sign up to see podcast mentions and sentiment
Sign UpDisclosures filed with DART (material events and exchange disclosures), newest first, headlines as filed in Korean. The link opens the filing on DART. Press releases from the company's own website, newest first.















 25년 국가고객만족도(NCSI)
 26년 한국 산업의 서비스 품질지수
 24년 한국산업의 서비스 품질지수
 25년 대한민국 국가브랜드 대상
 24년 한국서비스품질지수(KS-SQI)
 웹 접근성 품질인증










Prompts
Click prompts to add them under the company line, click again to take one out, then copy the result into your AI chat. Shared by Asian Century Stocks and Uncovered Thai Stocks. Thank you.
KIA CORP. (ticker 000270), listed in South Korea.
Copied
ETFs Holding KIA CORP.
Exchange-traded funds whose newest published daily portfolio holds one of the company's listings, largest weight first.
| ETF | Weight in ETF | Shares | Market value | As of |
|---|---|---|---|---|
| MOTO | 2.91% | 3,168 | $ 282.65K | Jun 30, 2026 |
| RFEM | 2.64% | 22,457 | $ 2.078M | Jul 31, 2026 |
| GEME | 2.25% | 92,454 | $ 8.235M | Jun 30, 2026 |
| EMOP | 1.61% | 382,570 | $ 34.076M | Jun 30, 2026 |
| DSTX | 1.33% | 7,055 | $ 628.406K | Jun 30, 2026 |
| MKOR | 1.21% | 20,296 | $ 1.808M | Jun 30, 2026 |
| PEMX | 1.18% | 3,990 | $ 369.139K | Jul 31, 2026 |
| EYLD | 0.95% | 88,343 | $ 8.173M | Jul 31, 2026 |
| EMKT | 0.85% | 17,353 | $ 1.546M | Jun 30, 2026 |
| ADVE | 0.82% | 841 | $ 74.91K | Jun 30, 2026 |
| TDI | 0.72% | 29,003 | $ 2.583M | Jun 30, 2026 |
| AVES | 0.68% | 140,544 | $ 9.833M | Nov 16, 2026 |
| SEEM | 0.36% | 24,257 | $ 2.161M | Jun 30, 2026 |
| AVXC | 0.31% | 18,468 | $ 1.292M | Nov 16, 2026 |
| AVSE | 0.29% | 8,666 | $ 606.307K | Nov 16, 2026 |
| AVEM | 0.26% | 996,553 | $ 69.723M | Nov 16, 2026 |
| NTSE | 0.21% | 1,374 | $ 122.386K | Jun 30, 2026 |
| REMG | 0.17% | 2,078 | $ 185.093K | Jun 30, 2026 |
| TIER | 0.15% | 594 | $ 53.555K | Jul 31, 2026 |
| IQSZ | 0.08% | 1,495 | $ 134.79K | Jul 31, 2026 |