Google Maps (Google’s mapping service application) is currently unavailable in China.
Thank you for your understanding.
-
Company
All
Doosan Corporation
Doosan Corporation Electro-Materials BG
Doosan Corporation Digital Innovation BU
Doosan Enerbility
Doosan Corporation Retail BU
Doosan Bobcat
Doosan Mottrol
Doosan Fuel Cell
HyAxiom
Doosan Tesna
Doosan Robotics
Doosan Mobility Innovation
Doosan H2 Innovation
Doosan Investments
Oricom
Hancomm
Doosan Magazines
Doosan Bears
Doosan Cuvex
Doosan Yonkang Foundation
Doosan Art Center
DBRI(Doosan Business Research Institute)
-
Category
All
Headquarters
Production
Sales
R&D
-
region
All
Asia
Europe
South America
North America
Oceania
Africa
Country
All
Korea
Vietnam
Saudi Arabia
Singapore
UAE
India
Indonesia
Japan
China
Cambodia
Kuwait
Thailand
Turkey
Philippine
Nederlands
Norway
Germany
Russia
Romania
Luxembourg
Belgium
Ireland
United Kingdom
Italy
Czech Republic
Poland
France
Switzerland
Brazil
Chile
Colombia
Mexico
United States
Canada
Australia
South Africa
Egypt
Hungary
-


-
Doosan Corporation
Korea Headquarters
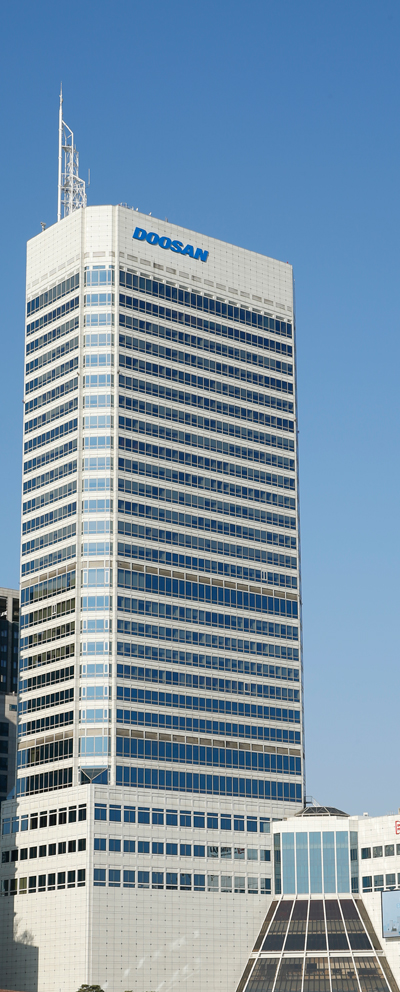
Address Doosan Tower, 275, Jangchungdan-ro, Jung-gu, Seoul, Korea
Tel. 82-2-3398-0114

Google Maps (Google’s mapping service application) is currently unavailable in China.
Thank you for your understanding.
-
Doosan Corporation Electro-Materials BG Office (Headquarters)
Korea Headquarters
Address Doosan Tower, 275, Jangchundan-ro, Jung-gu, Seoul, Republic of Korea
Tel. 82-2-3398-1519
Google Maps (Google’s mapping service application) is currently unavailable in China.
Thank you for your understanding.
-
Doosan Corporation Electro-Materials BG R&D Center
Korea R&D
Address 10, Suji-ro 112beon-gil, Suji-gu, Yongin-si, Gyeonggi-do, Republic of Korea
Tel. 82-31-260-6127
Google Maps (Google’s mapping service application) is currently unavailable in China.
Thank you for your understanding.
-
Doosan Corporation Electro-Materials BG Europe Branch
Germany Sales
Address Oskar-Schlemmer-Str.11, 80807, Munich, Germany
Tel. 49-176-7652-5702
Google Maps (Google’s mapping service application) is currently unavailable in China.
Thank you for your understanding.
-
Doosan Corporation Electro-Materials BG Hongkong Entity
China Sales
Address UNITS 04-05 26/F Railway Plaza 39 Chatham Road South Tsim Sha Tsui, Hongkong
Tel.
Google Maps (Google’s mapping service application) is currently unavailable in China.
Thank you for your understanding.
-
Doosan Corporation Electro-Materials BG Japan Branch
Japan Sales
Address 4F Sanno Park Tower 2-11-1 Nagatacho, Chiyoda-ku, Tokyo 100-6104, Japan
Tel. 81-3-6205-4848
Google Maps (Google’s mapping service application) is currently unavailable in China.
Thank you for your understanding.
-
Doosan Corporation Electro-Materials BG Shanghai Entity
China Sales
Address Room 2403 Nison Plaza, 205 Suzhou Avenue West Suzhou Industrial Park, Suzhou 215021, Jiangsu Province, China
Tel. 86-0512-8789-7923
Google Maps (Google’s mapping service application) is currently unavailable in China.
Thank you for your understanding.
-
Doosan Corporation Electro-Materials BG Shenzhen Entity
China Sales
Address 4B 209-210 International, Commerce & Exhibition Center No.1001 Hong Hua Road, Fu Tien Trade Zone, Shenzhen, China
Tel. 86-755-8278-8231
Google Maps (Google’s mapping service application) is currently unavailable in China.
Thank you for your understanding.
-
Doosan Corporation Electro-Materials BG Singapore Entity
Singapore Sales
Address 8 Jurong Town Hall Road, #30-02 The JTC Summit, Singapore 609434
Tel. 65-6397-5263
Google Maps (Google’s mapping service application) is currently unavailable in China.
Thank you for your understanding.
-
Doosan Corporation Electro-Materials BG Taiwan Branch
China Sales
Address 9F., No. 1086, Zhongzheng Rd., Taoyuan Dist., Taoyuan City 330, Taiwan
Tel. 886-2-2658-0018
Google Maps (Google’s mapping service application) is currently unavailable in China.
Thank you for your understanding.
-
Doosan Corporation Electro-Materials BG US Entity
United States Sales
Address 1735 Technology Drive, Suite 250 San Jose, CA, 95110
Tel. 1-408-642-5562
Google Maps (Google’s mapping service application) is currently unavailable in China.
Thank you for your understanding.
-
Doosan Corporation Electro-Materials BG Vietnam Branch
Vietnam Sales
Address Keangnam Hanoi Landmark Tower No.1415, 14F, Plot E6, Cau Giay Urban Area, Me Tri Commune, Tu Liem District, Hanoi
Tel. 84-4-3837-8491
Google Maps (Google’s mapping service application) is currently unavailable in China.
Thank you for your understanding.
-
Doosan Corporation Electro-Materials BG Changshu Plant
China Production
Address No 168 Hualian Road, Tonggang Industrial Park, Changshu Economic Development Zone, Changshu City, Jiangsu Province, China
Tel. 86-512-8235-9980
Google Maps (Google’s mapping service application) is currently unavailable in China.
Thank you for your understanding.
-
Doosan Corporation Electro-Materials BG Gimcheon Plant
Korea Production
Address 83-16 Gongdan 1-gil, Gimcheon-si, Gyeongsangbuk-do, Republic of Korea
Tel. 82-54-420-7971
Google Maps (Google’s mapping service application) is currently unavailable in China.
Thank you for your understanding.
-
Doosan Corporation Electro-Materials BG Gimje Plant
Korea Production
Address 66, Jipyeongseonsandan 4-gil, Baeksan-myeon, Gimje-si, Jeonbuk, Korea
Tel. 82-63-770-3200
Google Maps (Google’s mapping service application) is currently unavailable in China.
Thank you for your understanding.
-
Doosan Corporation Electro-Materials BG Hai Duong Plant
Vietnam Production
Address Workshop No.3 and workshop No.4, Lot NQ, Dai An, industrial zone, km 51, Highway 5, Tu Minh Ward, Hai Duong City, Hai Duong Province, Vietnam.
Tel. 84-220-383-3656
Google Maps (Google’s mapping service application) is currently unavailable in China.
Thank you for your understanding.
-
Doosan Corporation Electro-Materials BG Iksan Plant
Korea Production
Address 627, Seodong-ro ,Iksan-si, Jeollabuk-do, Republic of Korea
Tel. 82-63-830-8333
Google Maps (Google’s mapping service application) is currently unavailable in China.
Thank you for your understanding.
-
Doosan Corporation Electro-Materials BG Jeungpyeong Plant
Korea Production
Address Doosan-ro 40, Jeungpyeong-eup ,Jeungpyeong-gun, Chungcheongbuk-do, Republic of Korea
Tel. 82-43-820-8220
Google Maps (Google’s mapping service application) is currently unavailable in China.
Thank you for your understanding.
-
Doosan Corporation Digital Innovation BU
Korea Headquarters
Address 275(Doosan Tower Building), Jangchungdan-ro, Jung-gu, Seoul, Korea
Tel.
Google Maps (Google’s mapping service application) is currently unavailable in China.
Thank you for your understanding.
-
Doosan Corporation Digital Innovation BU
Korea
Address 155, Jeongjail-ro, Bundang-gu, Seongnam-si, Gyeonggi-do, South Korea
Tel.
Google Maps (Google’s mapping service application) is currently unavailable in China.
Thank you for your understanding.
-
Doosan Corporation Digital Innovation BU - America HQ
United States
Address 400 Perimeter Center Terrace Suite 750 Atlanta GA 30346 USA
Tel. 1-770-353-3800
Google Maps (Google’s mapping service application) is currently unavailable in China.
Thank you for your understanding.
-
Doosan Corporation Digital Innovation BU - China HQ
China
Address Doosan Digital Innovation China Co., Ltd. 19th fl., Tower B, Gateway No.18 Xiaguangli, North Road East Third Ring, Chaoyang District Beijing China, 100027
Tel. 86-10-5829-1722
Google Maps (Google’s mapping service application) is currently unavailable in China.
Thank you for your understanding.
-
Doosan Corporation Retail BU-Doota Mall
Korea Headquarters
Address B2~5 Floor, Doosan Tower, 275, Jangchungdan-ro, Jung-gu, Seoul, Korea
Tel. 82-2-3398-3333
Google Maps (Google’s mapping service application) is currently unavailable in China.
Thank you for your understanding.
-
Doosan Enerbility
Korea Headquarters
Address 22, Doosan volvo-ro, Seongsan-gu, Changwon-si, Gyeongsangnam-do, Korea
Tel. 82-55-278-6114
Google Maps (Google’s mapping service application) is currently unavailable in China.
Thank you for your understanding.
-
Doosan Enerbility - Major Subsidiaries Doosan GridTech
United States Headquarters
Address 71 Columbia Street, Suite 300, Seattle, WA 98104, U.S.A
Tel. 1-888-452-7715
Google Maps (Google’s mapping service application) is currently unavailable in China.
Thank you for your understanding.
-
Doosan Enerbility - Major Subsidiaries Doosan HF Controls
United States Headquarters
Address 1624 West Crosby Road, Suite 124 Carrollton, Texas 75006, U.S.A.
Tel. 1-469-568-6526
Google Maps (Google’s mapping service application) is currently unavailable in China.
Thank you for your understanding.
-
Doosan Enerbility - Major Subsidiaries Doosan Lentjes
Germany Headquarters
Address Daniel-Goldbach-Str.19, 40880, Ratingen, Germany
Tel. 49-(0)-2102-166-0
Google Maps (Google’s mapping service application) is currently unavailable in China.
Thank you for your understanding.
-
Doosan Enerbility - Major Subsidiaries Doosan Power Services America
United States Headquarters
Address 1050 Crown Point Parkway, Suite 1200, Atlanta, GA 30338, USA
Tel. 1-770-551-5764
Google Maps (Google’s mapping service application) is currently unavailable in China.
Thank you for your understanding.
-
Doosan Enerbility - Major Subsidiaries Doosan Power Systems
United Kingdom Headquarters
Address Doosan House Crawley Business Quarter Manor Royal, Crawley, West Sussex, RH10 9AD, United Kingdom
Tel. 44-129-358-4665
Google Maps (Google’s mapping service application) is currently unavailable in China.
Thank you for your understanding.
-
Doosan Enerbility - Major Subsidiaries Doosan Power Systems Arabia
Saudi Arabia Headquarters
Address P.O. Box 7937, 8th Floor, Al Olaya Tower, Prince Sultan Road, Al Mohammadiah, Jeddah 23617 Kingdom of Saudi Arabia
Tel. 966-012-615-5550
Google Maps (Google’s mapping service application) is currently unavailable in China.
Thank you for your understanding.
-
Doosan Enerbility - Major Subsidiaries Doosan Power Systems India
India Headquarters
Address 16th Floor, DLF Square, Jacaranda Marg, Near NH-8, DLF Phase-II, Gurgaon, Haryana-122 002, India
Tel. 91-124-439-8200
Google Maps (Google’s mapping service application) is currently unavailable in China.
Thank you for your understanding.
-
Doosan Enerbility - Major Subsidiaries Doosan Škoda Power
Czech Republic Headquarters
Address Tylova 1/57, 301 28, Plzen,Czech Republic
Tel. 420-378-185-961
Google Maps (Google’s mapping service application) is currently unavailable in China.
Thank you for your understanding.
-
Doosan Enerbility - Major Subsidiaries Doosan Turbomachinery Services
United States Headquarters
Address 12000 N. P Street La Porte, Texas 77571
Tel. 1-713-364-7500
Google Maps (Google’s mapping service application) is currently unavailable in China.
Thank you for your understanding.
-
Doosan Enerbility Doosan Heavy Industries Japan Corp.
Japan Headquarters
Address Room 410,Sanno Park Tower, 2-11-1, Nagatacho, Chiyoda-ku, Tokyo100-6104, Japan
Tel. 81-3-5510-5460
Google Maps (Google’s mapping service application) is currently unavailable in China.
Thank you for your understanding.
-
Doosan Enerbility Doosan ATS America
United States R&D
Address 11360 N. Jog Road Palm Beach Garden, Florida 33418, U.S.A
Tel. 1-561-572-9031
Google Maps (Google’s mapping service application) is currently unavailable in China.
Thank you for your understanding.
-
Doosan Enerbility Abu Dhabi Office
UAE Sales
Address P.O. BOX 27767, Al Ghaith Tower, Suite 508 Hamdan Street, Abu Dhabi, U.A.E.
Tel. 971-2-627-6273
Google Maps (Google’s mapping service application) is currently unavailable in China.
Thank you for your understanding.
-
Doosan Enerbility Manila Office
Philippine Sales
Address Unit 1802, One World Place, 32nd street, Bonifacio Global City, Taguig City 1634, Philippines
Tel. 63-2-801-4619
Google Maps (Google’s mapping service application) is currently unavailable in China.
Thank you for your understanding.
-
Doosan Enerbility Mumbai office
India Sales
Address 501, 5th Floor, CNB Square Bldg, Sangam Complex, Andheri-Kurla Road, Andheri(E), Mumbai - 400 059
Tel. 91-22-6177-0501
Google Maps (Google’s mapping service application) is currently unavailable in China.
Thank you for your understanding.
-
Doosan Enerbility
Korea
Address 155, Jeongjail-ro, Bundang-gu, Seongnam-si, Gyeonggi-do, South Korea
Tel.
Google Maps (Google’s mapping service application) is currently unavailable in China.
Thank you for your understanding.
-
Doosan Enerbility - Corvallis Office
United States
Address 1100 NE Circle Blvd., Suite200 Corvallis, OR97330
Tel. 1-541-452-7998
Google Maps (Google’s mapping service application) is currently unavailable in China.
Thank you for your understanding.
-
Doosan Enerbility - Doosan ATS Europe
Switzerland
Address Bruggerstrasse 69, 5400 Baden, Switzerland
Tel. 41-56-203-1890
Google Maps (Google’s mapping service application) is currently unavailable in China.
Thank you for your understanding.
-
Doosan Enerbility - Major Subsidiaries Doosan Heavy Industries America
United States
Address 400 Kelby Street, Parker Plaza 10th Floor, Fort Lee, NJ 07024, U.S.A.
Tel. 1-201-944-4554(31)
Google Maps (Google’s mapping service application) is currently unavailable in China.
Thank you for your understanding.
-
Doosan Enerbility Bangkok Office
Thailand
Address M-Thai Tower, 10th Floor, All Seasons Place, 87 Wireless Road Phatumwan, Bangkok 10330, Thailand
Tel. 66-2-654-0690~91
Google Maps (Google’s mapping service application) is currently unavailable in China.
Thank you for your understanding.
-
Doosan Enerbility Beijing Office
China
Address Gateway Plaza. Tower B, 19th Floor, No.18 Xiaguangli North Road, East Third Ring, Chaoyang District Beijing, 100027, China
Tel. 86-10-8454-7135
Google Maps (Google’s mapping service application) is currently unavailable in China.
Thank you for your understanding.
-
Doosan Enerbility Cairo Office
Egypt
Address 2nd Floor, Land Mark Building, 67 El Teseen St., 5th Settlement, New Cairo, Egypt
Tel. 202-2537-1040
Google Maps (Google’s mapping service application) is currently unavailable in China.
Thank you for your understanding.
-
Doosan Enerbility Dubai Office
UAE
Address Office Suite 2204, U-Bora Tower, Al Abraj Street, Business Bay PO Box 11859, Dubai, United Arab Emirates
Tel. 971-4-327-5545
Google Maps (Google’s mapping service application) is currently unavailable in China.
Thank you for your understanding.
-
Doosan Enerbility Frankfurt Office
Germany
Address 7th Floor, Arabella Center Lyoner Strasse 44-48 60528 Frankfurt am Main, Germany
Tel. 49-69-69-5004-11
Google Maps (Google’s mapping service application) is currently unavailable in China.
Thank you for your understanding.
-
Doosan Enerbility Hanoi Office
Vietnam
Address Daeha Business Center, #1101, 360 Kim Ma Street, Ba Dinh District, Hanoi, Vietnam
Tel. 84-24-6273-0545
Google Maps (Google’s mapping service application) is currently unavailable in China.
Thank you for your understanding.
-
Doosan Enerbility Jakarta Office
Indonesia
Address Menara Sentraya 17th Floor, Unit B2, Jalan Iskandarsyah Raya No. 1A, Kebayoran Baru, Jakarta Indonesia
Tel. 62-21-2788-1802
Google Maps (Google’s mapping service application) is currently unavailable in China.
Thank you for your understanding.
-
Doosan Enerbility Kuwait Office
Kuwait
Address 18th Floor, Capital Tower, Tunisia St, Block 4 Hawally, Kuwait (P.O. Box 2031)
Tel. 965-2208-9085
Google Maps (Google’s mapping service application) is currently unavailable in China.
Thank you for your understanding.
-
Doosan Enerbility Middle East Operation Center
UAE
Address Office No. 2202 & 2203, 22nd Floor, Ubora Tower, Al Abraj Street, Business Bay Dubai, P.O.Box 11859, United Arab Emirates
Tel. 971-4-327-5545
Google Maps (Google’s mapping service application) is currently unavailable in China.
Thank you for your understanding.
-
Doosan Enerbility New Delhi office
India
Address 16th Floor, DLF Square, Jacaranda Marg, Near N H- 8, DLF Phase- II, Gurgaon- 122002 (Haryana)
Tel. 91-124-388-1702
Google Maps (Google’s mapping service application) is currently unavailable in China.
Thank you for your understanding.
-
Doosan Enerbility Newington Office
United States
Address 178 Shattuck Way, Newington, NH 03801, USA
Tel. 1-603-433-5507
Google Maps (Google’s mapping service application) is currently unavailable in China.
Thank you for your understanding.
-
Doosan Enerbility Pittsburgh Office
United States
Address 1000 Westinghouse Drive, Building 1, 256A, Cranberry Township, PA, U.S.A
Tel. 1-412-374-6071
Google Maps (Google’s mapping service application) is currently unavailable in China.
Thank you for your understanding.
-
Doosan Enerbility Riyadh Office
Saudi Arabia
Address Office No. 206, The Plaza Building (Akariya No. 4), Olaya Street, P.O.Box 9656, Riyadh 11423, Kingdom of Saudi Arabia
Tel. 966-011-419-1696
Google Maps (Google’s mapping service application) is currently unavailable in China.
Thank you for your understanding.
-
Doosan Enerbility Santiago Office
Chile
Address Av. Nueva Tajamar 481, Torre Sur, Piso 11, Oficina 1103, Las Condes, Santiago, Chile
Tel. 56-2-2657-3340
Google Maps (Google’s mapping service application) is currently unavailable in China.
Thank you for your understanding.
-
Doosan Enerbility Shanghai Office
China
Address Rm 2903A, Gubei International Fortune Center, No. 1438, Hong Qiao Road, Chang Ning District, Shanghai 201103, China
Tel. 86-21-5877-8696
Google Maps (Google’s mapping service application) is currently unavailable in China.
Thank you for your understanding.
-
Doosan Enerbility Taipei Office
China
Address 8F-7, No.495, Gunagfu South Road, Xinyi Dist., Taipei, Taiwan, R.O.C
Tel. 886-2-2720-2050
Google Maps (Google’s mapping service application) is currently unavailable in China.
Thank you for your understanding.
-
Doosan Bobcat - HQ Doosan Bobcat Inc.
Korea Headquarters
Address 155, Jeongjail-ro, Bundang-gu, Seongnam-si, Gyeonggi-do, Republic of Korea
Tel. 82-31-5179-3300
Google Maps (Google’s mapping service application) is currently unavailable in China.
Thank you for your understanding.
-
Doosan Bobcat - Regional HQ(ALAO) Doosan Bobcat Korea Co., Ltd.
Korea Headquarters
Address 155, Jeongjail-ro, Bundang-gu, Seongnam-si, Gyeonggi-do, Republic of Korea
Tel. 031-5179-3300
Google Maps (Google’s mapping service application) is currently unavailable in China.
Thank you for your understanding.
-
Doosan Bobcat -Regional HQ(EMEA) Doosan Bobcat EMEA s.r.o
Czech Republic Headquarters
Address U Kodetky 1810, Dobris 263 12, Czech Republic
Tel.
Google Maps (Google’s mapping service application) is currently unavailable in China.
Thank you for your understanding.
-
Doosan Bobcat -Regional HQ(NA) Doosan Bobcat North America, Inc.
United States Headquarters
Address 250 E. Beaton Dr. West Fargo, ND 58078, USA
Tel. 1-701-241-8700
Google Maps (Google’s mapping service application) is currently unavailable in China.
Thank you for your understanding.
-
Doosan Bobcat - Doosan Bobcat Korea Co., Ltd.
Korea R&D
Address 468, Injung-ro, Dong-gu, Incheon, Korea
Tel.
Google Maps (Google’s mapping service application) is currently unavailable in China.
Thank you for your understanding.
-
Doosan Bobcat -Doosan Bobcat China Co., Ltd.
China R&D
Address NO.68, Suhong East Road, SIP, Jiangsu, China 215026
Tel. 86-512-8777-7777
Google Maps (Google’s mapping service application) is currently unavailable in China.
Thank you for your understanding.
-
Doosan Bobcat -Doosan Bobcat China Yantai Co., Ltd.
China R&D
Address No.30 Fuzhou Road Eco&Tech Development Area, Yantai, Shandong, China
Tel.
Google Maps (Google’s mapping service application) is currently unavailable in China.
Thank you for your understanding.
-
Doosan Bobcat -Doosan Bobcat EMEA s.r.o
Czech Republic R&D
Address U Kodetky 1810, Dobris 263 12, Czech Republic
Tel. 420-318-532-444
Google Maps (Google’s mapping service application) is currently unavailable in China.
Thank you for your understanding.
-
Doosan Bobcat -Doosan Bobcat France S.A.S.
France R&D
Address Route de Nantes, BP71, 44160 Pontchateau, France
Tel. 33-2-40-00-73-50
Google Maps (Google’s mapping service application) is currently unavailable in China.
Thank you for your understanding.
-
Doosan Bobcat -Doosan Bobcat India Private Ltd. (Bangalore)
India R&D
Address Polyhose Industrial Park, Gummidipundi, Chinna Obulapuram, Village, Chennai, Tamil Nadu 601201, India
Tel.
Google Maps (Google’s mapping service application) is currently unavailable in China.
Thank you for your understanding.
-
Doosan Bobcat -Doosan Bobcat India Private Ltd. (Chennai)
India R&D
Address Industrial Estate, Varadanahalli, Karnataka 561203, India
Tel.
Google Maps (Google’s mapping service application) is currently unavailable in China.
Thank you for your understanding.
-
Doosan Bobcat -Doosan Bobcat North America, Inc. (Bismarck)
United States R&D
Address 3901 Morrison Ave., Bismarck, ND 58504-6875, USA
Tel. 1-701-222-5000
Google Maps (Google’s mapping service application) is currently unavailable in China.
Thank you for your understanding.
-
Doosan Bobcat -Doosan Bobcat North America, Inc. (Gwinner)
United States R&D
Address 201 1st Ave. NE, Gwinner, ND 58040-6000, USA
Tel. 1-701-678-6363
Google Maps (Google’s mapping service application) is currently unavailable in China.
Thank you for your understanding.
-
Doosan Bobcat -Doosan Bobcat North America, Inc. (Johnson Creek)
United States R&D
Address 1 Bobcat Ln, Johnson Creek, WI 53038, USA
Tel.
Google Maps (Google’s mapping service application) is currently unavailable in China.
Thank you for your understanding.
-
Doosan Bobcat -Doosan Bobcat North America, Inc. (Litchfield)
United States R&D
Address 520 Polydome Dr Litchfield, MN 55355, USA
Tel. 1-320-693-4967
Google Maps (Google’s mapping service application) is currently unavailable in China.
Thank you for your understanding.
-
Doosan Bobcat -Doosan Bobcat North America, Inc. (Statesville)
United States R&D
Address 1293 Glenway Drive Statesville, NC 28625, USA
Tel. 1-704-833-3500
Google Maps (Google’s mapping service application) is currently unavailable in China.
Thank you for your understanding.
-
Doosan Bobcat -Doosan Bobcat North America, Inc. (Wahpeton)
United States R&D
Address 2101 11th St N Wahpeton, ND 58075, USA
Tel. 1-701-451-7003
Google Maps (Google’s mapping service application) is currently unavailable in China.
Thank you for your understanding.
-
Doosan Bobcat -Geith International Ltd.
Ireland R&D
Address Block B, Balheary Road, Swords Business Campus, Swords, Co. Dublin, Ireland
Tel. 353-1-6502100
Google Maps (Google’s mapping service application) is currently unavailable in China.
Thank you for your understanding.
-
Doosan Bobcat -Global Collaboration Center
United States R&D
Address Fifth Street Towers, 150 S 5th St, Minneapolis, MN 55402, USA
Tel. 1-320-693-4967
Google Maps (Google’s mapping service application) is currently unavailable in China.
Thank you for your understanding.
-
Doosan Bobcat -Sahuarita R&D Center
United States R&D
Address Sahuarita, Arizona, USA
Tel.
Google Maps (Google’s mapping service application) is currently unavailable in China.
Thank you for your understanding.
-
Doosan Bobcat -Sales Office (Bobcat Corp.)
Japan Sales
Address 3-7-15, Shin-Yokohama, Yokohama-shi, Kanagawa, Japan 222-0033
Tel. 81-45-548-4445
Google Maps (Google’s mapping service application) is currently unavailable in China.
Thank you for your understanding.
-
Doosan Bobcat -Sales Office (Buena Park)
United States Sales
Address Buena Park, California, USA
Tel.
Google Maps (Google’s mapping service application) is currently unavailable in China.
Thank you for your understanding.
-
Doosan Bobcat -Sales Office (Buford)
United States Sales
Address 2475 Mill Center Parkway, Suite 400, Buford, Georgia, USA
Tel. 1-770-831-2200
Google Maps (Google’s mapping service application) is currently unavailable in China.
Thank you for your understanding.
-
Doosan Bobcat -Sales Office (Chile)
Chile Sales
Address Americo Vespucio 1151 -B01- Quilicura-Santiago- Chile
Tel. 56-2-2964-3050
Google Maps (Google’s mapping service application) is currently unavailable in China.
Thank you for your understanding.
-
Doosan Bobcat -Sales Office (Cuxhaven)
Germany Sales
Address Cuxhaven, Niedersachsen, Germany
Tel.
Google Maps (Google’s mapping service application) is currently unavailable in China.
Thank you for your understanding.
-
Doosan Bobcat -Sales Office (Doosan Bobcat Bensheim GmbH)
Germany Sales
Address Berliner Ring 169, 64625, Bensheim, Germany
Tel. 49-6251-8482-314
Google Maps (Google’s mapping service application) is currently unavailable in China.
Thank you for your understanding.
-
Doosan Bobcat -Sales Office (Doosan Bobcat Canada Ltd.)
Canada Sales
Address 675 Cochrane Drive, 6th Floor, Markham, Ontario L3R 0B8 Canada
Tel. 1-905-206-0022
Google Maps (Google’s mapping service application) is currently unavailable in China.
Thank you for your understanding.
-
Doosan Bobcat -Sales Office (Doosan Bobcat China Co., Ltd.)
China Sales
Address NO.68, Suhong East Road, SIP, Jiangsu, China 215026
Tel.
Google Maps (Google’s mapping service application) is currently unavailable in China.
Thank you for your understanding.
-
Doosan Bobcat -Sales Office (Doosan Bobcat de Mexico S.A. de C.V.)
Mexico Sales
Address Claveria 29, PH 5, Colonia Claveria, Delegacion Azcapotzalco, Mexico DF, 02080
Tel.
Google Maps (Google’s mapping service application) is currently unavailable in China.
Thank you for your understanding.
-
Doosan Bobcat -Sales Office (Doosan Bobcat India Private Ltd.)
India Sales
Address 6th Floor, HTC TOWERS No. 41, GST Road, Guindy Chennai, 600032
Tel.
Google Maps (Google’s mapping service application) is currently unavailable in China.
Thank you for your understanding.
-
Doosan Bobcat -Sales Office (Doosan Bobcat UK Ltd.)
United Kingdom Sales
Address Unit 20 Meadowcroft Way, Leigh Commerce Park. Leigh, Lancashire WN7 3XZ, United Kingdom
Tel.
Google Maps (Google’s mapping service application) is currently unavailable in China.
Thank you for your understanding.
-
Doosan Bobcat -Sales Office (Doosan Bobcat UK Northampton Ltd.)
United Kingdom Sales
Address Unit 12 Kilvey Road, Brackmills Industrial Estate, Northampton, Northamptonshire, NN4 7BQ, United Kingdom
Tel. 44-1604-825600
Google Maps (Google’s mapping service application) is currently unavailable in China.
Thank you for your understanding.
-
Doosan Bobcat -Sales Office (Doosan International South Africa (Pty) Ltd.)
South Africa Sales
Address Unit 1 Dakota Business Park, 15 Dakota Crescent, Airport Park, Germiston, 1401
Tel.
Google Maps (Google’s mapping service application) is currently unavailable in China.
Thank you for your understanding.
-
Doosan Bobcat -Sales Office (Dubai)
UAE Sales
Address Jebel Ali Free Zone, Dubai, UAE
Tel.
Google Maps (Google’s mapping service application) is currently unavailable in China.
Thank you for your understanding.
-
Doosan Bobcat -Sales Office (Geith International Ltd)
Ireland Sales
Address Block B, Balheary Road, Swords Business Campus, Swords, Co. Dublin, Ireland
Tel.
Google Maps (Google’s mapping service application) is currently unavailable in China.
Thank you for your understanding.
-
Doosan Bobcat -Sales Office (JSC Doosan International Russia)
Russia Sales
Address 5 Naryshkinskaya Alley, bldg. 1, 2 floor, premises 1, room 18, Moscow, 125167
Tel. 7-495-7488008
Google Maps (Google’s mapping service application) is currently unavailable in China.
Thank you for your understanding.
-
Doosan Bobcat -Sales Office (Sint-Niklaas)
Belgium Sales
Address Europark Noord 36A, 9100 Sint-Niklaas, Belgium
Tel.
Google Maps (Google’s mapping service application) is currently unavailable in China.
Thank you for your understanding.
-
Doosan Bobcat -Sales Office (Stade)
Germany Sales
Address Stade, Niedersachsen, Germany
Tel.
Google Maps (Google’s mapping service application) is currently unavailable in China.
Thank you for your understanding.
-
Doosan Bobcat - Doosan Bobcat Korea Co., Ltd.
Korea Production
Address 468, Injung-ro, Dong-gu, Incheon, Korea
Tel.
Google Maps (Google’s mapping service application) is currently unavailable in China.
Thank you for your understanding.
-
Doosan Bobcat -Doosan Bobcat China Co., Ltd.
China Production
Address No.68, Suhong East Road, SIP, Jiangsu, China 215026
Tel.
Google Maps (Google’s mapping service application) is currently unavailable in China.
Thank you for your understanding.
-
Doosan Bobcat -Doosan Bobcat China Yantai Co., Ltd.
China Production
Address Wuzhishan Road 28, Eco&Tech, Development Area, Yantai Shandong, China
Tel.
Google Maps (Google’s mapping service application) is currently unavailable in China.
Thank you for your understanding.
-
Doosan Bobcat -Doosan Bobcat EMEA s.r.o
Czech Republic Production
Address U Kodetky 1810, Dobris 263 12, Czech Republic
Tel. 420-318-532-444
Google Maps (Google’s mapping service application) is currently unavailable in China.
Thank you for your understanding.
-
Doosan Bobcat -Doosan Bobcat France S.A.S.
France Production
Address Route de Nantes, BP71, 44160 Pontchateau, France
Tel. 33-2-40-00-73-50
Google Maps (Google’s mapping service application) is currently unavailable in China.
Thank you for your understanding.
-
Doosan Bobcat -Doosan Bobcat Germany GmbH
Germany Production
Address Am Stieg 17, OT Freiwalde, D-15910 Bersteland, Germany
Tel. 49-35-474-2080
Google Maps (Google’s mapping service application) is currently unavailable in China.
Thank you for your understanding.
-
Doosan Bobcat -Doosan Bobcat India Private Ltd. (Bangalore)
India Production
Address Industrial Estate, Varadanahalli, Karnataka 561203, India
Tel.
Google Maps (Google’s mapping service application) is currently unavailable in China.
Thank you for your understanding.
-
Doosan Bobcat -Doosan Bobcat India Private Ltd. (Chennai)
India Production
Address Polyhose Industrial Park, Gummidipundi, Chinna Obulapuram, Village, Chennai, Tamil Nadu 601201, India
Tel.
Google Maps (Google’s mapping service application) is currently unavailable in China.
Thank you for your understanding.
-
Doosan Bobcat -Doosan Bobcat North America, Inc. (Bismarck)
United States Production
Address 3901 Morrison Ave., Bismarck, ND 58504, USA
Tel. 1-701-222-5000
Google Maps (Google’s mapping service application) is currently unavailable in China.
Thank you for your understanding.
-
Doosan Bobcat -Doosan Bobcat North America, Inc. (Gwinner)
United States Production
Address 201 1st Ave. NE, Gwinner, ND 58040, USA
Tel. 1-701-678-6363
Google Maps (Google’s mapping service application) is currently unavailable in China.
Thank you for your understanding.
-
Doosan Bobcat -Doosan Bobcat North America, Inc. (Johnson Creek)
United States Production
Address 1 Bobcat Ln, Johnson Creek, WI 53038, USA
Tel.
Google Maps (Google’s mapping service application) is currently unavailable in China.
Thank you for your understanding.
-
Doosan Bobcat -Doosan Bobcat North America, Inc. (Litchfield)
United States Production
Address 520 Polydome Dr Litchfield, MN 55355, USA
Tel. 1-320-693-4967
Google Maps (Google’s mapping service application) is currently unavailable in China.
Thank you for your understanding.
-
Doosan Bobcat -Doosan Bobcat North America, Inc. (Rogers)
United States Production
Address 19850 S Diamond Lake Rd, Rogers, MN 55374, USA
Tel.
Google Maps (Google’s mapping service application) is currently unavailable in China.
Thank you for your understanding.
-
Doosan Bobcat -Doosan Bobcat North America, Inc. (Statesville)
United States Production
Address 1293 Glenway Drive Statesville, NC 28625, USA
Tel. 1-704-833-3500
Google Maps (Google’s mapping service application) is currently unavailable in China.
Thank you for your understanding.
-
Doosan Bobcat -Doosan Bobcat North America, Inc. (Wahpeton)
United States Production
Address 2101 11th St N Wahpeton, ND 58075, USA
Tel. 1-701-451-7003
Google Maps (Google’s mapping service application) is currently unavailable in China.
Thank you for your understanding.
-
Doosan Bobcat - Parts Distribution Center (Atlanta)
United States
Address 1850 Oak Lawn Ave, Atlanta, GA 30336, USA
Tel.
Google Maps (Google’s mapping service application) is currently unavailable in China.
Thank you for your understanding.
-
Doosan Bobcat - Parts Distribution Center (Buford)
United States
Address 30518 Buford, Georgia, USA
Tel.
Google Maps (Google’s mapping service application) is currently unavailable in China.
Thank you for your understanding.
-
Doosan Bobcat - Parts Distribution Center (Chicago)
United States
Address 2649 Internationale Pkwy, Woodridge, IL 60517, USA
Tel. 1-630-783-0200
Google Maps (Google’s mapping service application) is currently unavailable in China.
Thank you for your understanding.
-
Doosan Bobcat - Parts Distribution Center (Dubai)
UAE
Address Jebel Ali Free Zone, Dubai, UAE
Tel.
Google Maps (Google’s mapping service application) is currently unavailable in China.
Thank you for your understanding.
-
Doosan Bobcat - Parts Distribution Center (Halle)
Germany
Address Polarisstraße 4, 06116 Halle (Saale), Germany
Tel.
Google Maps (Google’s mapping service application) is currently unavailable in China.
Thank you for your understanding.
-
Doosan Bobcat - Parts Distribution Center (Hwaseong)
Korea
Address 45, Barangongdan-ro, Hyangnam-eup, Hwaseong-si, Gyeonggi-do, Korea
Tel.
Google Maps (Google’s mapping service application) is currently unavailable in China.
Thank you for your understanding.
-
Doosan Bobcat - Parts Distribution Center (Incheon)
Korea
Address 468, Injung-ro, Dong-gu, Incheon, Korea
Tel.
Google Maps (Google’s mapping service application) is currently unavailable in China.
Thank you for your understanding.
-
Doosan Bobcat - Parts Distribution Center (Northampton)
United Kingdom
Address Unit 12 Kilvey Road, Brackmills Industrial Estate, Northampton, Northamptonshire, NN4 7BQ, UK
Tel.
Google Maps (Google’s mapping service application) is currently unavailable in China.
Thank you for your understanding.
-
Doosan Bobcat - Parts Distribution Center (Reno)
United States
Address 9477 N. Virginia Street in Reno, Nevada, USA
Tel.
Google Maps (Google’s mapping service application) is currently unavailable in China.
Thank you for your understanding.
-
Doosan Bobcat - Parts Distribution Center (Suzhou)
China
Address No.68, Suhong East Road, SIP, Jiangsu, China 215026
Tel.
Google Maps (Google’s mapping service application) is currently unavailable in China.
Thank you for your understanding.
-
Doosan Bobcat - Training Center (Aurora)
United States
Address 7801 E 40th Ave, Aurora, CO 80011, USA
Tel.
Google Maps (Google’s mapping service application) is currently unavailable in China.
Thank you for your understanding.
-
Doosan Bobcat - Training Center (Chennai)
India
Address Polyhose Industrial Park, Gummidipundi, Chinna Obulapuram, Village, Chennai, Tamil Nadu 601201, India
Tel.
Google Maps (Google’s mapping service application) is currently unavailable in China.
Thank you for your understanding.
-
Doosan Bobcat - Training Center (Dobris)
Czech Republic
Address U Kodetky 1810, Dobris 263 12, Czech Republic
Tel. 420-318-532-444
Google Maps (Google’s mapping service application) is currently unavailable in China.
Thank you for your understanding.
-
Doosan Bobcat - Training Center (Incheon)
Korea
Address 468, Injung-ro, Dong-gu, Incheon, Korea
Tel.
Google Maps (Google’s mapping service application) is currently unavailable in China.
Thank you for your understanding.
-
Doosan Bobcat - Training Center (Suzhou)
China
Address No.68, Suhong East Road, SIP, Jiangsu, China 215026
Tel.
Google Maps (Google’s mapping service application) is currently unavailable in China.
Thank you for your understanding.
-
Doosan Bobcat -Digital Innovation Center (West Fargo)
United States
Address 250 East Beaton Drive, Fargo, North Dakota 58078, USA
Tel. 1-701-241-8700
Google Maps (Google’s mapping service application) is currently unavailable in China.
Thank you for your understanding.
-
Doosan Bobcat -Global Collaboration Center
United States
Address 150 South Fifth Street, Suite 500, Minneapolis, Minnesota 55402 USA
Tel. 1-320-693-4967
Google Maps (Google’s mapping service application) is currently unavailable in China.
Thank you for your understanding.
-
Doosan Mottrol Inc.
Korea Headquarters
Address #171 Wanam-ro, Sungsan-gu, Changwon, Gyeongnam, South Korea
Tel.
Google Maps (Google’s mapping service application) is currently unavailable in China.
Thank you for your understanding.
-
Doosan Mottrol Sales Office (China)
China Sales
Address #1209 Binjiang west road, Jiangyin city, Wuxi city, Jiangsu Province, China 214446
Tel.
Google Maps (Google’s mapping service application) is currently unavailable in China.
Thank you for your understanding.
-
Doosan Fuel Cell
Korea Headquarters
Address 100, Seogam-ro 7-gil, Iksan-si, Jeollabuk-do, Republic of Korea
Tel. 82-63-722-2001
Google Maps (Google’s mapping service application) is currently unavailable in China.
Thank you for your understanding.
-
Doosan Fuel Cell R&D Center
Korea R&D
Address Gwanggyo Central Biz Tower 310ho, 260, Changnyong-daero, Yeongtong-gu, Suwon-si, Gyeonggi-do, Republic of Korea
Tel. 82-31-8066-7361
Google Maps (Google’s mapping service application) is currently unavailable in China.
Thank you for your understanding.
-
Doosan Fuel Cell China Office
China Sales
Address 68 Suhong Dong RD, Suzhou Industrial Park, Suzhou, Jiangsu, China (215000)
Tel.
Google Maps (Google’s mapping service application) is currently unavailable in China.
Thank you for your understanding.
-
Doosan Fuel Cell Seoul Office
Korea
Address 17F Doosan Tower, 275 Jangchungdan-ro, Jung-gu, Seoul, South Korea
Tel. 82-2-3398-3820
Google Maps (Google’s mapping service application) is currently unavailable in China.
Thank you for your understanding.
-
HyAxiom, Inc.
United States Headquarters
Address 101 E River Dr, East Hartford, CT 06108, USA
Tel. 1-860-727-2200
Google Maps (Google’s mapping service application) is currently unavailable in China.
Thank you for your understanding.
-
Doosan Tesna
Korea Headquarters
Address 72, Sandan-ro 16beon-gil, Pyeongtaek-si, Gyeonggi-do (450-2, Mogok-dong, Pyeongtaek-si)
Tel. 82-31-646-8500
Google Maps (Google’s mapping service application) is currently unavailable in China.
Thank you for your understanding.
-
Doosan Tesna Cheongju Site
Korea Production
Address 94, Gwahaksaneop 3-ro, Ochang-eup, Cheongwon-gu, Cheongju-si, Chungcheongbuk-do(654-5, Gak-ri, Ochang-eup, Cheongwon-gu, Cheongju-si)
Tel. 82-43-241-2500
Google Maps (Google’s mapping service application) is currently unavailable in China.
Thank you for your understanding.
-
Doosan Tesna Anseong Site
Korea Production
Address 116, Gwansan-gil Wongok-myeon, Anseong-si, Gyeonggi-do (12, Oegacheon-ri, Wongok-myeon, Anseong-si)
Tel. 82-31-646-8500
Google Maps (Google’s mapping service application) is currently unavailable in China.
Thank you for your understanding.
-
Doosan Tesna West Anseong Site
Korea Production
Address 97-12, Jimun-ro Wongok-myeon, Anseong-si, Gyeonggi-do (772, Jimun-ri, Wongok-myeon, Anseong-si)
Tel. 82-31-646-8500
Google Maps (Google’s mapping service application) is currently unavailable in China.
Thank you for your understanding.
-
Doosan Robotics
Korea Headquarters
Address 155, Jeongjail-ro, Bundang-gu, Seongnam-si, Gyeonggi-do, Korea
Tel. 82-31-8014-5500
Google Maps (Google’s mapping service application) is currently unavailable in China.
Thank you for your understanding.
-
Doosan Robotics - DRIC
Korea R&D
Address 20 Tancheonsang-ro 151beon-gil, Bundang-gu, Seongnam-si, Gyeonggi-do, Korea
Tel. 82-31-8014-5500
Google Maps (Google’s mapping service application) is currently unavailable in China.
Thank you for your understanding.
-
Doosan Robotics - Suwon
Korea Production
Address 79, Saneopro 156-gil, Gwonseon-gu, Suwon-si, Gyeonggi-do, Korea
Tel. 82-31-8014-5500
Google Maps (Google’s mapping service application) is currently unavailable in China.
Thank you for your understanding.
-
Doosan Mobility Innovation Hwaseong
Korea Headquarters
Address 75, Jeyakdanji-ro, Hyangnam-eup, Hwaseong-si, Gyeonggi-do, Republic of Korea
Tel. 82-31-781-0475
Google Maps (Google’s mapping service application) is currently unavailable in China.
Thank you for your understanding.
-
Doosan Mobility Innovation Suji
Korea R&D
Address 10, Suji-ro 112beon-gil, Suji-gu, Yongin-si, Gyeonggi-do, Republic of Korea
Tel. 82-31-290-0710
Google Maps (Google’s mapping service application) is currently unavailable in China.
Thank you for your understanding.
-
Doosan Mobility Innovation Hwaseong
Korea Production
Address 75, Jeyakdanji-ro, Hyangnam-eup, Hwaseong-si, Gyeonggi-do, Republic of Korea
Tel. 82-31-781-0475
Google Maps (Google’s mapping service application) is currently unavailable in China.
Thank you for your understanding.
-
Doosan Mobility Innovation (Shen Zhen) Co., Ltd.
China
Address 3#28F, Lehui Building, No.489 Jihua Road, Longgang District, Shenzhen, China (518052)
Tel. 86-755-8527-2687
Google Maps (Google’s mapping service application) is currently unavailable in China.
Thank you for your understanding.
-
Doosan H2 Innovation
Korea Headquarters
Address 8th floor, 10, Suji-ro 112beon-gil, Suji-gu, Yongin-si, Gyeonggi-do, Republic of Korea
Tel. 82-31-8066-7730
Google Maps (Google’s mapping service application) is currently unavailable in China.
Thank you for your understanding.
-
Doosan Investments
Korea
Address 23F, Doosan Tower, 275, Jangchungdan-ro, Jung-gu, Seoul, Republic of Korea
Tel.
Google Maps (Google’s mapping service application) is currently unavailable in China.
Thank you for your understanding.
-
Oricom Inc. Office
Korea Headquarters
Address Doosan Bldg., 726, Eonju-ro, Gangnam-gu, Seoul, Korea
Tel. 82-2-510-4100
Google Maps (Google’s mapping service application) is currently unavailable in China.
Thank you for your understanding.
-
Hancomm Office
Korea Headquarters
Address Doosan Bldg., 726, Eonju-ro, Gangnam-gu, Seoul, Korea
Tel. 82-2-519-6900
Google Maps (Google’s mapping service application) is currently unavailable in China.
Thank you for your understanding.
-
Doosan Magazine
Korea Headquarters
Address Doosan Bldg., 726, Eonju-ro, Gangnam-gu, Seoul, Korea
Tel. 82-2-510-4500
Google Maps (Google’s mapping service application) is currently unavailable in China.
Thank you for your understanding.
-
Doosan Bears
Korea Headquarters
Address 25, Olympic-ro, Songpa-gu, Seoul
Tel. 82-2-2240-1777
Google Maps (Google’s mapping service application) is currently unavailable in China.
Thank you for your understanding.
-
Doosan Cuvex
Korea Headquarters
Address 72, Chiljeondong-gil, Chuncheon-si, Gangwon-do, Korea
Tel. 82-33-260-1114
Google Maps (Google’s mapping service application) is currently unavailable in China.
Thank you for your understanding.
-
Doosan Yonkang Foundation
Korea Headquarters
Address Yonkang Bldg., 15, Jong-ro 33-gil, Jongno-gu, Seoul, Korea
Tel. 82-2-708-5510
Google Maps (Google’s mapping service application) is currently unavailable in China.
Thank you for your understanding.
-
Doosan Art Center
Korea Headquarters
Address 15, Jong-ro 33-gil, Jongno-gu, Seoul, Korea
Tel. 82-2-708-5001
Google Maps (Google’s mapping service application) is currently unavailable in China.
Thank you for your understanding.
-
Doosan Art Center Doosan Gallery
Korea
Address 15, Jong-ro 33-gil, Jongno-gu, Seoul, Korea
Tel. 82-2-708-5050
Google Maps (Google’s mapping service application) is currently unavailable in China.
Thank you for your understanding.
-
Doosan Art Center Space111
Korea
Address 15, Jong-ro 33-gil, Jongno-gu, Seoul, Korea
Tel. 82-2-708-5001
Google Maps (Google’s mapping service application) is currently unavailable in China.
Thank you for your understanding.
-
Doosan Art Center Studio DAC
Korea
Address 8F, 187, Jongno Jongno-gu, Seoul, Korea
Tel. 82-2-708-5001
Google Maps (Google’s mapping service application) is currently unavailable in China.
Thank you for your understanding.
-
Doosan Art Center Yonkang Hall
Korea
Address 15, Jong-ro 33-gil, Jongno-gu, Seoul, Korea
Tel. 82-2-708-5001
Google Maps (Google’s mapping service application) is currently unavailable in China.
Thank you for your understanding.
-
Doosan Business Research Institute
Korea
Address 31F, 275(Doosan Tower Building), Jangchungdan-ro, Jung-gu, Seoul, Korea
Tel. 82-2-3398-1224
Google Maps (Google’s mapping service application) is currently unavailable in China.
Thank you for your understanding.
-
DLI Yonkangwon
Korea
Address 25, Myeongil-ro 26-gil, Gangdong-gu, Seoul, Korea
Tel. 82-2-2041-3000
Google Maps (Google’s mapping service application) is currently unavailable in China.
Thank you for your understanding.
© 2026 Doosan Corporation.
 No next Article.
 Doosan Bobcat’s RogueX3 Wins Red Dot Award






 English