|
JBCC Holdings Inc. is a pure holding company that provides total IT services across Japan, covering consulting, planning, construction, implementation, operation, and maintenance of corporate information systems. The group operates through eight consolidated subsidiaries and is divided into two business segments: Information Solutions and Product Development & Manufacturing. The Information Solutions segment focuses on high-speed development, cloud computing, and security, offering system integration (SI), services, and system maintenance. The Product Development & Manufacturing segment develops and provides proprietary software, cloud data integration platforms, and production management systems, while also manufacturing and selling hardware such as printers. Summarised from the annual report, fiscal year ended Mar 2026 |
Industry Information Technology Services | Homepage jbcchd.co.jp |
| Sector Technology | IR page jbcchd.co.jp/ir | |
|
Tags
system integration, cloud computing, cybersecurity, production management software, hardware manufacturing, it consulting, data integration
|
Press page — |
Metrics
| Valuation | |
|---|---|
| Market cap | ¥ 121.928B |
| Market cap (USD) | $ 762.058M |
| P/E | 18.48 |
| PEG | 0.71 |
| P/BV | 4.77 |
| P/S | 1.57 |
| P/OCF | 19.12 |
| P/FCF | 20.50 |
| Dividend yield | 2.4% |
| Turnover / mcap | — |
| Returns | |
|---|---|
| ROE | 21.8% |
| ROI | 20.0% |
| ROIC | 18.7% |
| Profit margin | 7.0% |
| Growth | |
|---|---|
| Revenue growing | Yes |
| Profits growing | Yes |
| Revenue up 3y | Yes |
| Revenue up 5y | No |
| Earnings growth 3y (net profit CAGR) | 26.0% |
| Quality | |
|---|---|
| Profitable | Yes |
| Margin expanding | Yes |
| Buying back stock | No |
| Diluting (TTM) | No |
| Debt/Equity | — |
| Podcast bulls (TTM) | Sign up |
| Podcast bears (TTM) | Sign up |
| Podcast sentiment (TTM) | Sign up |
| Podcast sentiment % (TTM) | Sign up |
| News sentiment (TTM) | 0 |
| Quality score | 22.2% |
| Insiders | |
|---|---|
| Buys, 1w | Sign up |
| Buys, 1m | Sign up |
| Buys, 1y | Sign up |
| Sells, 1w | Sign up |
| Sells, 1m | Sign up |
| Sells, 1y | Sign up |
Sign up to see this company's insider trades
| Figure | FY 2026 | FY 2025 | FY 2024 | FY 2023 | FY 2022 | FY 2021 | FY 2020 | FY 2019 | FY 2018 | FY 2017 | FY 2016 | FY 2015 | FY 2014 | FY 2013 |
|---|---|---|---|---|---|---|---|---|---|---|---|---|---|---|
| Revenue | 76.019B | 69.868B | 65.194B | 58.144B | 55.934B | 60.042B | 65.618B | 58.899B | 63.107B | 83.272B | 86.129B | 91.966B | 93.668B | 90.265B |
| Net profit | 5.353B | 4.603B | 3.187B | 2.679B | 2.245B | 1.931B | 1.951B | 1.782B | 1.186B | 1.269B | 436M | 324M | 254M | 878M |
| Free cash flow | 5.796B | 6.498B | 1.131B | 129M | 3.344B | 2.302B | 3.037B | 1.722B | -820M | 2.141B | 985M | — | — | — |
| Figure | FY 2026 | FY 2025 | FY 2024 | FY 2023 | FY 2022 | FY 2021 | FY 2020 | FY 2019 | FY 2018 | FY 2017 | FY 2016 | FY 2015 | FY 2014 | FY 2013 |
|---|---|---|---|---|---|---|---|---|---|---|---|---|---|---|
| Share price | 1.194K | 1.101K | 3.27K | 2.169K | 1.552K | 1.482K | 1.675K | 1.5K | 1.065K | 781.13 | 677.92 | 782.03 | 751.95 | 902.26 |
| Price performance 12m | 0.08 | -0.66 | 0.51 | 0.4 | 0.05 | -0.12 | 0.12 | 0.41 | 0.36 | 0.15 | -0.13 | 0.04 | -0.17 | — |
Filed figures
Lines the statements and their notes report beside the headline figures, read from the filings' XBRL as filed (no restatement applied), with figures computed from one filing's own lines. Cash-flow lines carry their cash direction: an outflow is negative. Each period links to its filing; a figure's period, report date and tag are in its tooltip.
| Figure | Mar 2017 | Mar 2018 | Mar 2019 | Mar 2020 | Mar 2021 | Mar 2022 | Mar 2023 | Mar 2024 | Mar 2025 | Mar 2026 |
|---|---|---|---|---|---|---|---|---|---|---|
| Balance sheet detail | ||||||||||
| Trade receivables (JPY) | 15.8B | 11.4B | 12.4B | 11B | 12B | 7.87B | 9.13B | 8.74B | 9.68B | 10.9B |
| ↳ YoY growth | -4.4% | -28.0% | +8.5% | -11.1% | +8.9% | -34.3% | +16.0% | -4.3% | +10.7% | +12.9% |
| ↳ 5y CAGR | -6.3% | -13.1% | -4.3% | -6.7% | -2.5% | -1.8% | ||||
| Other receivables (JPY) | — | — | 56M | 3.08B | — | — | — | — | — | — |
| Borrowings, current (JPY) | 450M | 370M | 356M | 330M | 290M | 210M | — | — | — | — |
| Borrowings, non-current (JPY) | — | — | — | — | — | — | — | — | 2.59B | 1.9B |
| Lease liabilities (JPY) | 320M | 185M | 158M | 708M | 585M | 386M | 213M | 102M | 100M | 116M |
| Cash and deposits (JPY) | 7.29B | 7.23B | 7.65B | 9.61B | 10.8B | 12.1B | 10.7B | 9.9B | 17.8B | 18.6B |
| Intangible assets (JPY) | 753M | 622M | 578M | 539M | 624M | 531M | 456M | 378M | 330M | 360M |
| Net debt (borrowings + leases - cash) (JPY) | -6.52B | -6.68B | -7.13B | -8.57B | -9.88B | -11.5B | — | — | -15.1B | -16.6B |
| Cash flow detail | ||||||||||
| Operating cash flow (JPY) | 2.59B | -647M | 1.84B | 3.22B | 2.55B | 3.56B | 910M | 1.24B | 6.64B | 6.03B |
| Purchases of property, plant and equipment (JPY) | -226M | -101M | -115M | -93M | -93M | -59M | -675M | -18M | -30M | -25M |
| Purchases of intangible assets (JPY) | -226M | -72M | -60M | -86M | -158M | -159M | -106M | -86M | -111M | -213M |
| Change in receivables (cash effect) (JPY) | 682M | -202M | -843M | -1.68B | 1.98B | 104M | -73M | -354M | -689M | -195M |
| Change in inventories (cash effect) (JPY) | 557M | 328M | -716M | -414M | 626M | -11M | -272M | -1.7B | 1.58B | 133M |
| Change in payables (cash effect) (JPY) | 73M | -105M | 473M | -646M | -404M | -343M | 1.11B | 80M | 376M | 965M |
| Dividends paid (cash effect) (JPY) | -423M | -478M | -603M | -875M | -819M | -808M | -989M | -1.27B | -1.66B | -2.41B |
| Share buybacks (cash effect) (JPY) | -118M | -122M | -509M | -875M | 0.00 | -1B | 0.00 | -1B | -2.59B | -3B |
| Interest paid (cash effect) (JPY) | -12M | -8M | -6M | -17M | -17M | -13M | -5M | -6M | -3M | -2M |
| Income taxes paid (cash effect) (JPY) | -679M | -1.18B | -970M | -1.25B | -1.14B | -284M | -800M | -771M | -1.18B | -2.15B |
| Operating cash flow before change in receivables (JPY) | 1.91B | -445M | 2.68B | 4.9B | 574M | 3.46B | 983M | 1.59B | 7.33B | 6.23B |
| Free cash flow (OCF - PPE - intangibles) (JPY) | 2.14B | -820M | 1.66B | 3.04B | 2.3B | 3.34B | 129M | 1.13B | 6.5B | 5.8B |
| Income detail | ||||||||||
| Research and development expense (JPY) | 302M | 246M | 445M | 418M | 366M | 338M | 324M | 320M | 368M | 381M |
| ↳ 5y CAGR | -0.6% | +2.3% | +5.7% | -6.4% | -2.5% | +0.8% | ||||
| Total comprehensive income (JPY) | 1.52B | 1.66B | 1.92B | 1.7B | 2.52B | 2.09B | 2.68B | 3.39B | 4.45B | 5.44B |
| Comprehensive income to owners (JPY) | 1.52B | 1.66B | 1.92B | 1.69B | 2.52B | 2.08B | 2.68B | 3.39B | 4.45B | 5.44B |
| Provision for credit losses (JPY) | 19M | 124M | 1M | 1M | 3M | -3M | 1M | 7M | 1M | 4M |
| Credit cost ratio (credit losses / average receivables) (%) | 0.1% | 0.9% | 0.0% | 0.0% | 0.0% | 0.0% | 0.0% | 0.1% | 0.0% | 0.0% |
| Reported | Jun 22, 2017 | Jun 21, 2018 | Jun 22, 2020 | Jun 22, 2020 | Jun 21, 2021 | Jun 22, 2022 | Jun 21, 2023 | Jun 19, 2024 | Jun 16, 2025 | Jun 18, 2026 |
Sign up to see institutional holdings
Sign UpPodcast Mentions
Sign up to see podcast mentions and sentiment
Sign UpTimely disclosures published on TDnet, newest first, titles as filed in Japanese. The link opens the disclosure on TDnet. Filings with EDINET (periodic reports, extraordinary reports, offerings, holding and buy-back reports), newest first, titles as filed in Japanese. The link opens the filing on EDINET. Press releases from the company's own website, newest first.
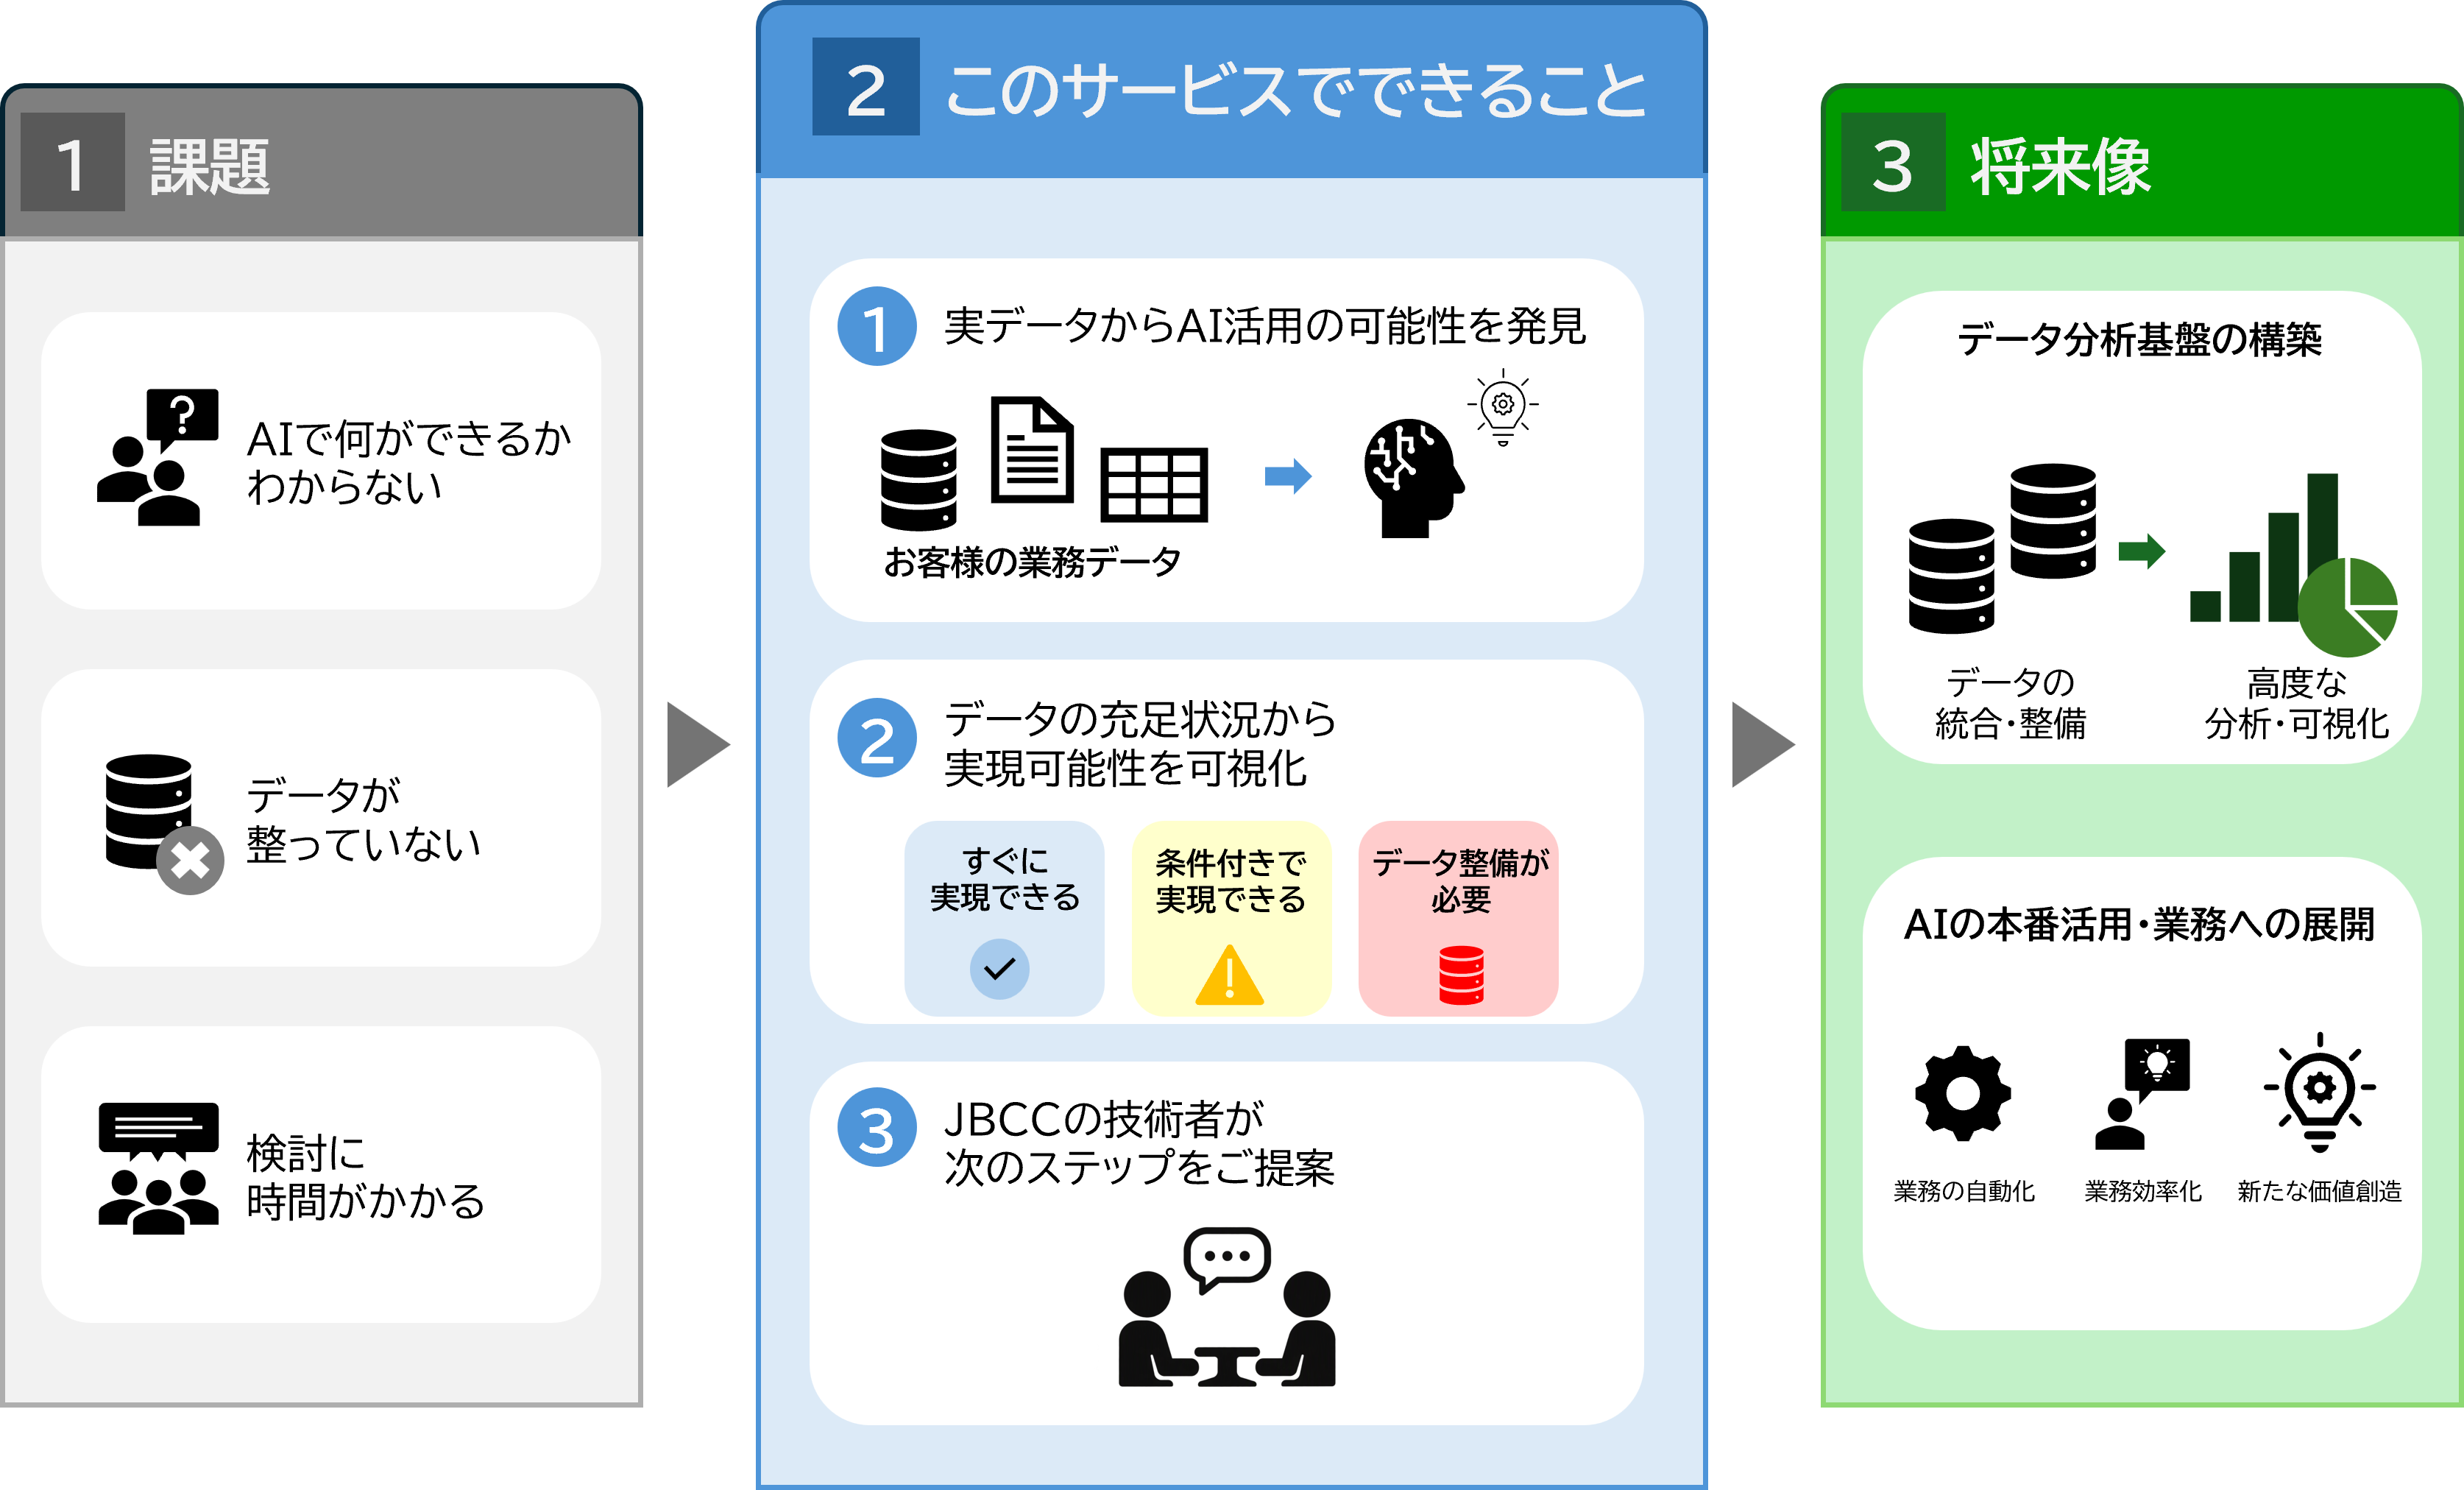


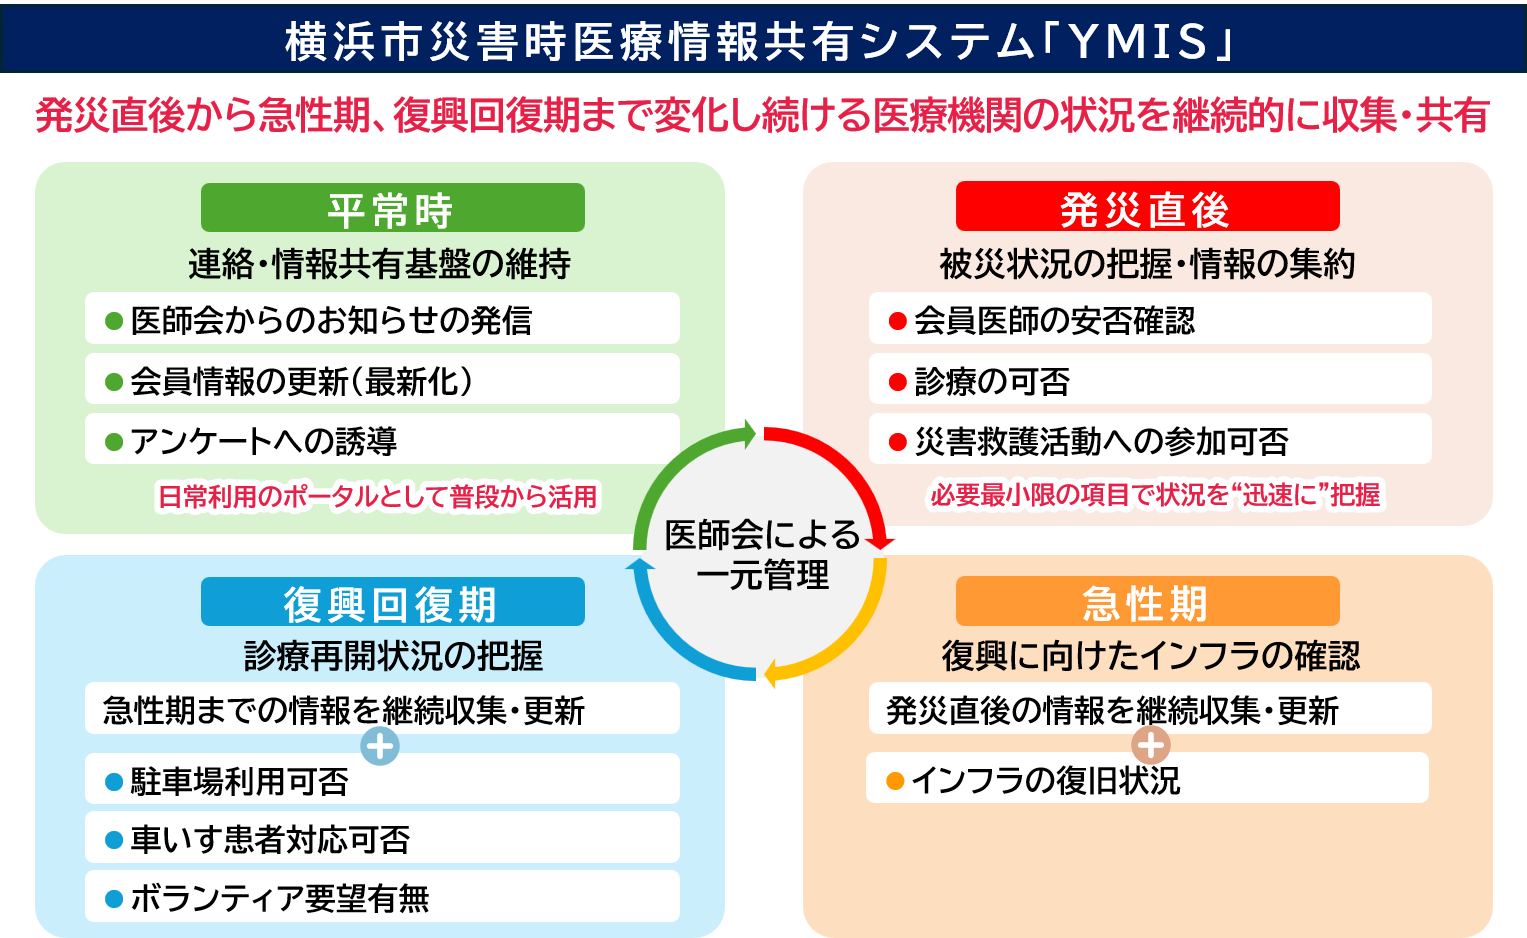
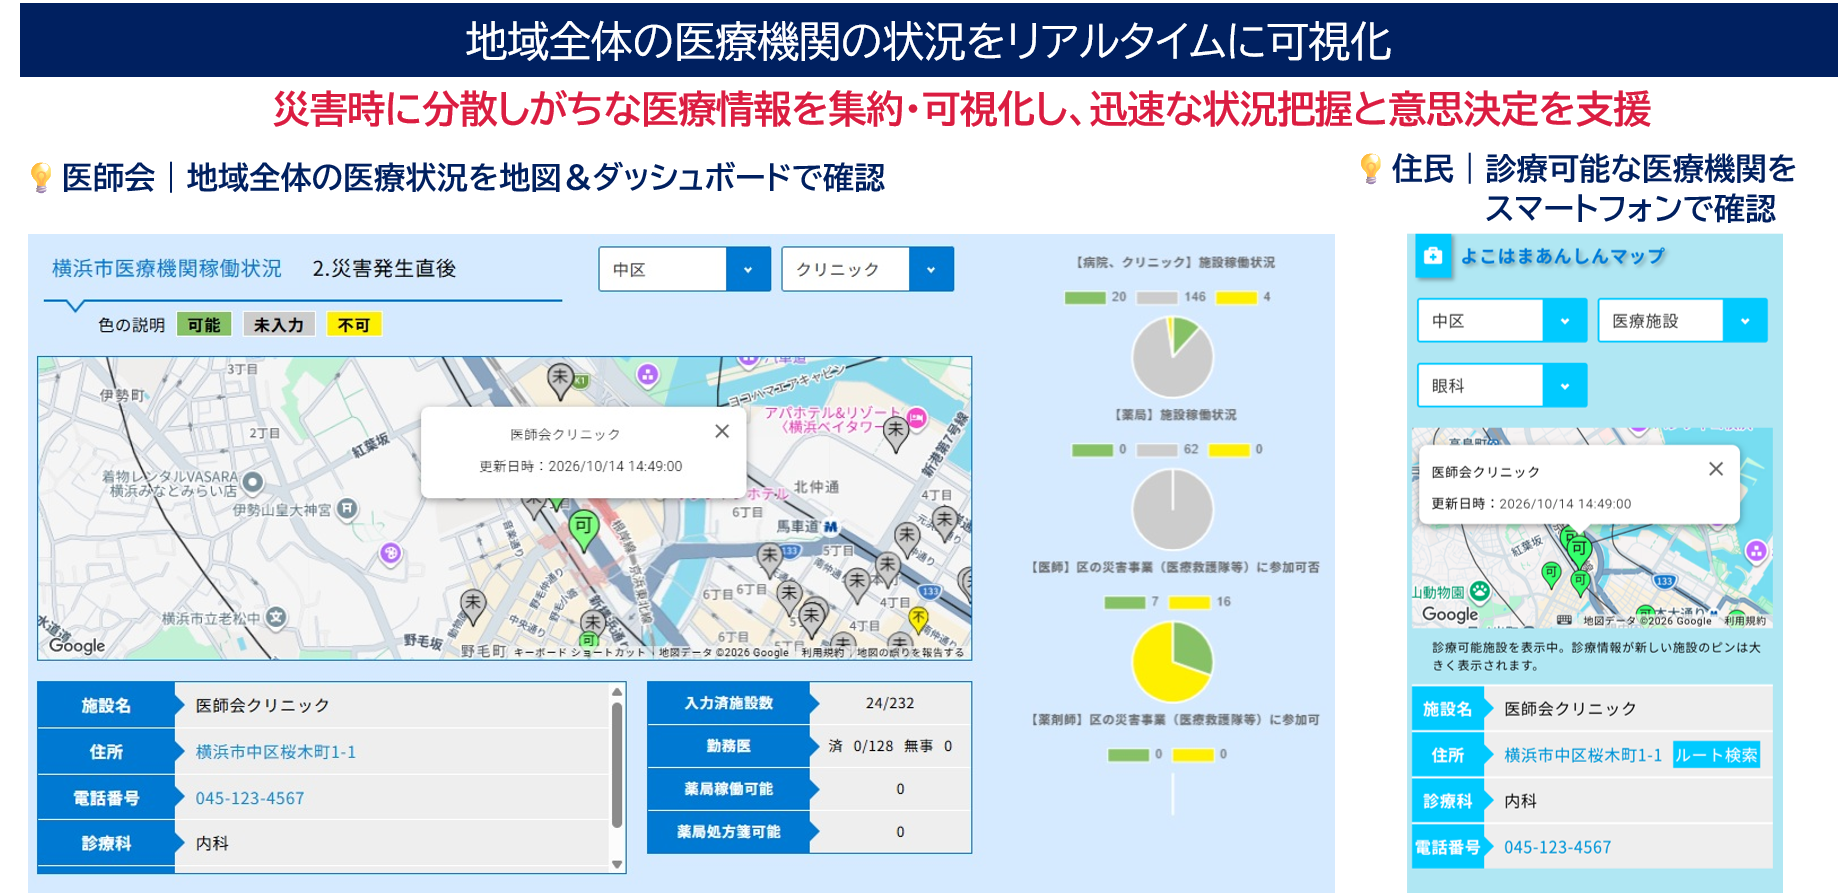
 これまでの災害対応や支援活動を通じて、被災地の医療機関の状況や支援ニーズを迅速に共有する仕組みの必要性を強く感じてきました。一方で、災害時には情報が分散し、必要な支援につなげるまでに時間を要することも少なくありませんでした。JBCCとの共同開発により、現場の知見を生かした情報共有基盤を実現できました。今後は、本システムを活用して市民へ必要な医療をより迅速に届けるとともに、横浜で培った仕組みを全国へ広げ、災害時でも切れ目なく医療を届けられる医療ネットワークの実現を目指します。
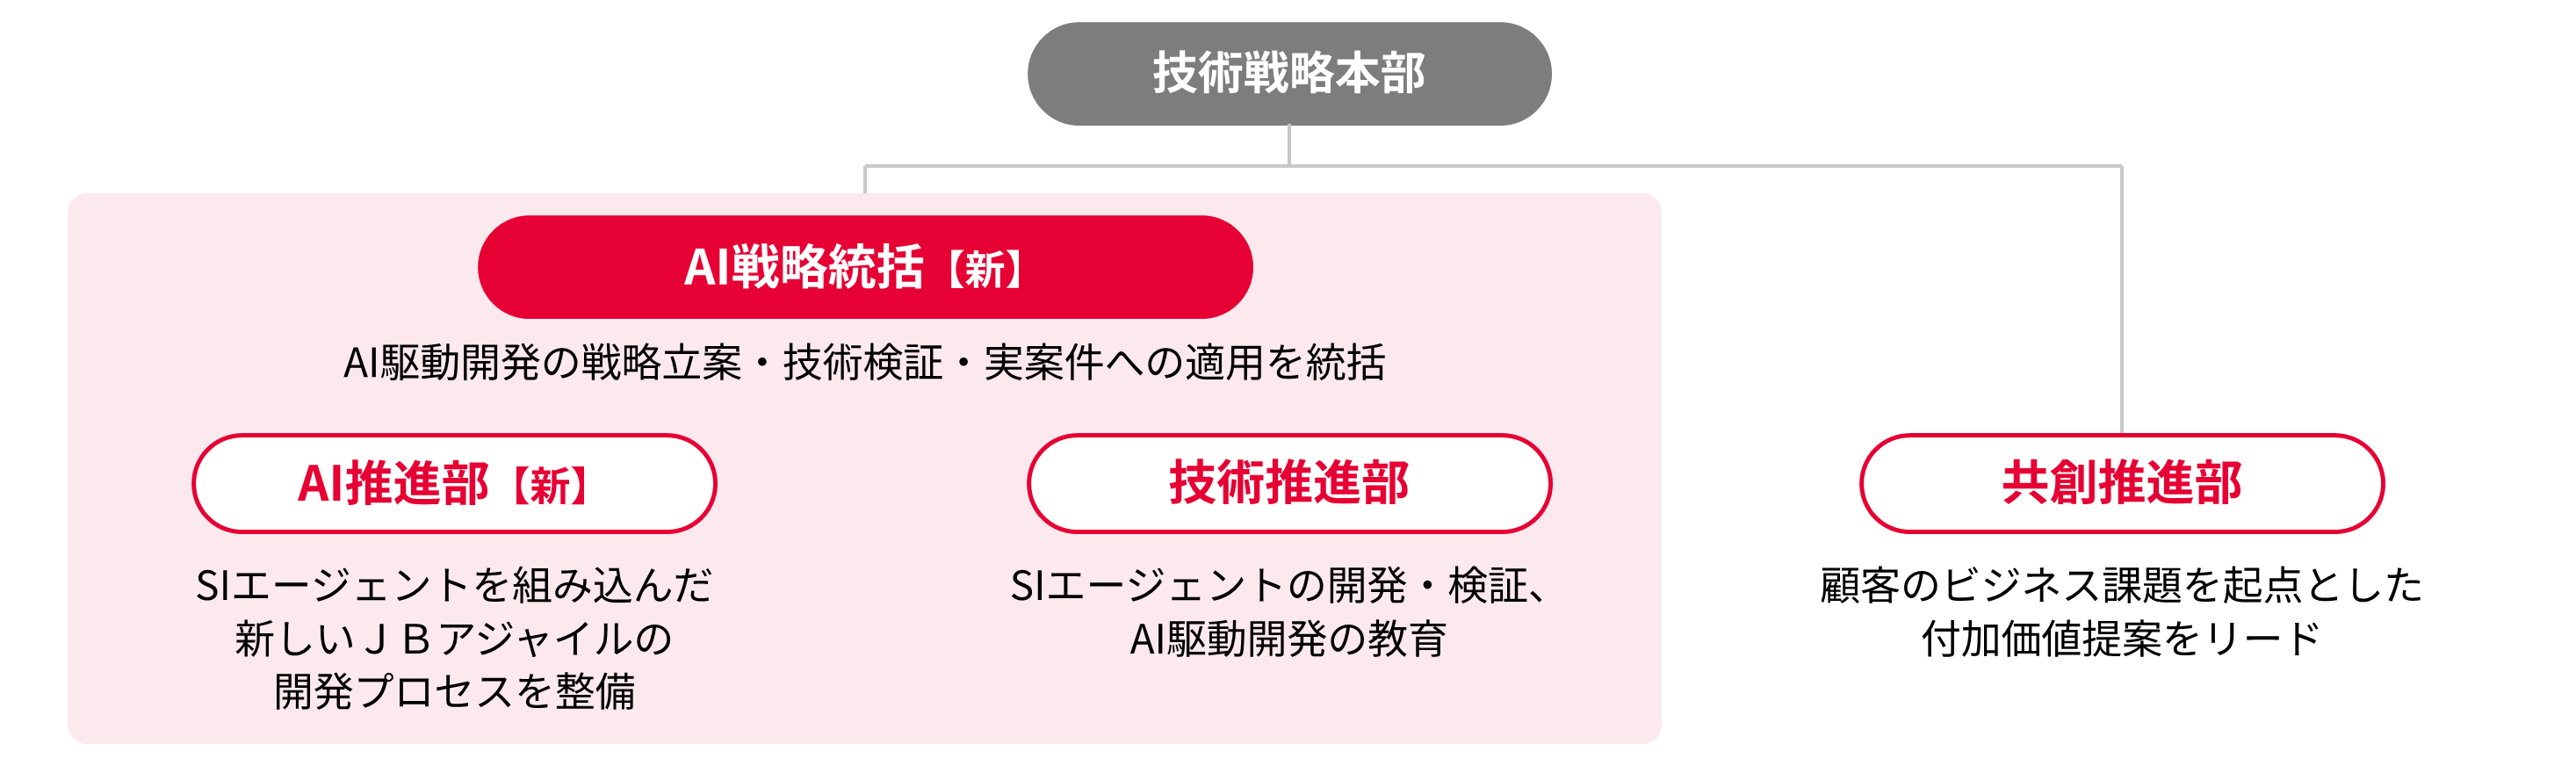

 詳細は、JBCCサイトのお客様事例でご覧ください。
Prompts
Click prompts to add them under the company line, click again to take one out, then copy the result into your AI chat. Shared by Asian Century Stocks and Uncovered Thai Stocks. Thank you.
ETFs Holding JBCC Holdings Inc.
Exchange-traded funds whose newest published daily portfolio holds one of the company's listings, largest weight first.
| ETF | Weight in ETF | Shares | Market value | As of |
|---|---|---|---|---|
| AVDS | 0.03% | 8,000 | $ 102.649K | Nov 16, 2026 |
| DXIV | 0.02% | 3,400 | $ 43.739K | Nov 12, 2026 |
| DFIS | 0.01% | 66,600 | $ 856.762K | Nov 12, 2026 |
| AVSD | 0.01% | 2,400 | $ 30.795K | Nov 16, 2026 |
| DFSI | 0.01% | 6,900 | $ 88.764K | Nov 12, 2026 |
| DFIC | 0.01% | 68,000 | $ 874.772K | Nov 12, 2026 |
| DFAI | 0.00% | 46,300 | $ 595.617K | Nov 12, 2026 |
| DFAX | 0.00% | 24,700 | $ 317.748K | Nov 12, 2026 |
| AVDE | 0.00% | 69,000 | $ 885.347K | Nov 16, 2026 |