Financial Results for the 2nd Quarter of Fiscal Year Ending March 31, 2027 (Apr. 1, 2026 - Sep. 30, 2026) 目次 / Contents Ⅰ 連結業績 / Consolidated Results 1. 損益計算書 / Statements of Income ・・・・・・・・・ P. 1 報告セグメント別業績 / Segment…
Financial Results for the 2nd Quarter of
Fiscal Year Ending March 31, 2027
(Apr. 1, 2026 - Sep. 30, 2026)
目次 / Contents
Ⅰ 連結業績 / Consolidated Results
1.
損益計算書 / Statements of Income
・・・・・・・・・ P. 1
報告セグメント別業績 / Segment Information
・・・・・・・・・ P. 2
設備投資 / Capital Expenditures
・・・・・・・・・ P. 3
海外子会社国別の損益 / Sales and Profits by Country
・・・・・・・・・ P. 3
Ⅱ 報告セグメント別情報 / Information by Reportable Segment
1.
オートバックス事業 / AUTOBACS Business
(1)
商品別・部門別売上高 / Net Sales Breakdown by Type of Operation and Merchandise
・・・・・・・・・ P. 4
(2)
オートバックスチェン小売売上高(FC店含む)/ AUTOBACS Chain Retail Sales
・・・・・・・・・ P. 5
(1)
3.
(1)
コンシューマ事業 / Consumer Business
拠点・ブランド別売上高 / Breakdown of Sales by Store Location and Brand
ホールセール事業 / Wholesale Business
国内海外別売上高 / Domestic and Overseas Sales
Ⅲ 店舗の出退店状況 / Number of Stores by Store Type
・・・・・・・・・ P. 6
・・・・・・・・・ P. 6
・・・・・・・・・ P. 6
・・・・・・・・・ P. 6
・・・・・・・・・ P. 7
Ⅳ 単体業績 / Non-consolidated Results
損益計算書 / Statements of Income
・・・・・・・・・ P. 8
注意1:業績予想の各数値は、現在入手可能な情報による判断および仮定に基づき算定しており、今後の状況により実際の業績等が計画の数値と大きく異なる可能性もあります。
Note1: The estimated figures are based on present assumptions, and actual achievements may differ from these figures according to future risks and uncertainties.
注意2:2027年3月期の期首より(2)商品別店舗売上高(FC店含む)を(2)オートバックスチェン小売売上高(FC含む)に変更しております。詳細については当該ページの注意記載をご覧ください。
Note2: From the beginning of the fiscal year ending March 31, 2027, the Company changed "Retail Sales Breakdown and Change by Merchandise" to "AUTOBACS Chain Retail Sales."
For details, please refer to the notes on the relevant page.
注意3:2026年8月27日に連結業績予想の修正をおこないました。詳細は「特別損失の計上および法人税等調整額(益)の計上ならびに通期連結業績予想の修正に関するお知らせ」をご覧ください。
本資料は修正後の業績予想を記載しております。
Note3: On August 27, 2026, we revised our consolidated financial results forecasts. For details, please refer to
the “Notice Concerning the Recognition of Extraordinary Losses and Deferred Tax Benefit, and Revisions to Consolidated Financial Results Forecasts.”
株式会社オートバックスセブン
AUTOBACS SEVEN CO., LTD.
Ⅰ.連結業績 / Consolidated Results
1.損益計算書 / Statements of Income
(単位 : 百万円、%)
(millions of yen, %)
2027年3月期 (実績・予想) / FY March 2027 (Results&Estimates)
2026年3月期 (実績) / FY March 2026 (Results)
第2四半期
上期
下期
通期
第2四半期
上期
下期
通期
2Q (Results)
1st Half (Results)
2nd Half (Estimates)
Full Year (Estimates)
2Q
1st Half
2nd Half
Full Year
売上高
金額 / Amount
72,376
141,191
158,808
300,000
64,615
128,838
151,216
Net Sales
増減率 / yoy chg.
12.0
9.6
5.0
7.1
14.8
16.8
8.6
12.2
売上原価
金額 / Amount
46,081
89,606
101,593
191,200
41,332
82,583
97,335
179,919
Cost of Goods Sold
増減率 / yoy chg.
11.5
8.5
4.4
6.3
14.3
15.2
8.8
11.6
金額 / Amount
26,294
51,585
57,214
108,800
23,283
46,254
53,880
100,135
売上総利益
280,055
36.3
12.9
36.5
11.5
36.0
6.2
36.3
8.7
36.0
15.7
35.9
19.8
35.6
8.3
35.8
13.3
人件費
売上比 / % of Sales
増減率 / yoy chg.
金額 / Amount
10,902
21,397
22,002
43,400
9,989
19,498
21,563
41,062
Salaries
増減率 / yoy chg.
9.1
9.7
2.0
5.7
17.6
17.8
12.2
14.8
販売費
金額 / Amount
3,388
7,006
7,293
14,300
2,981
6,287
6,886
13,174
Selling Expenses
増減率 / yoy chg.
13.7
11.4
5.9
8.5
7.8
6.9
2.7
4.7
設備費
金額 / Amount
4,110
8,065
9,634
17,700
3,783
7,290
7,842
15,132
Facilities
増減率 / yoy chg.
8.7
10.6
22.9
17.0
14.5
14.9
15.2
15.1
その他
金額 / Amount
5,167
10,056
8,343
18,400
4,132
8,094
8,876
16,970
Other
増減率 / yoy chg.
25.0
24.2
▲ 6.0
8.4
0.7
10.5
19.6
15.1
金額 / Amount
23,569
46,526
47,273
93,800
20,886
41,171
45,168
86,340
32.6
12.8
33.0
13.0
29.8
4.7
31.3
8.6
32.3
11.9
32.0
14.1
29.9
12.5
30.8
13.2
13,795
Gross Profit
販売費及び一般管理費
SG&A Expenses
営業利益
Operating Income
売上比 / % of Sales
増減率 / yoy chg.
2,725
5,058
9,941
15,000
2,396
5,083
8,711
売上比 / % of Sales
3.8
3.6
6.3
5.0
3.7
3.9
5.8
4.9
増減率 / yoy chg.
13.7
▲ 0.5
14.1
8.7
64.9
102.5
▲ 9.4
13.8
金額 / Amount
受取利息
金額 / Amount
27
44
35
80
24
47
37
85
Interest Income
増減率 / yoy chg.
13.8
▲ 7.4
▲ 6.4
▲ 6.9
▲ 23.2
▲ 16.9
▲ 37.3
▲ 27.3
受取配当金
金額 / Amount
0
130
89
220
0
66
57
123
Dividend Income
—
97.7
54.9
77.7
—
▲ 6.9
▲ 9.3
▲ 8.0
持分法利益
増減率 / yoy chg.
金額 / Amount
Equity Income on
Affiliates
▲ 43
—
—
—
13
192
100
292
増減率 / yoy chg.
—
—
—
—
—
50.9
▲ 67.2
▲ 32.5
24
39
20
60
16
32
35
68
53.7
20.6
▲ 42.2
▲ 12.4
▲ 56.5
▲ 33.5
—
42.5
受取家賃
金額 / Amount
増減率 / yoy chg.
金額 / Amount
15
29
10
40
11
23
10
34
Rental Income
増減率 / yoy chg.
28.9
24.9
▲ 4.1
15.8
▲ 10.3
▲ 10.2
81.3
6.7
情報機器賃貸料
金額 / Amount
Lease Revenue of
System Equipment
81
163
136
300
71
166
143
309
増減率 / yoy chg.
14.1
▲ 1.5
▲ 4.9
▲ 3.1
▲ 51.5
▲ 52.0
▲ 46.9
▲ 49.8
その他
金額 / Amount
350
768
531
1,300
260
543
862
1,405
Other
受取手数料
Commission Received
増減率 / yoy chg.
34.4
41.5
▲ 38.4
▲ 7.5
457.5
39.9
113.7
77.5
営業外収益
金額 / Amount
456
1,176
823
2,000
398
1,071
1,248
2,320
Non-operating Income
増減率 / yoy chg.
14.7
9.7
▲ 34.0
▲ 13.8
41.3
0.5
12.6
6.7
支払利息
金額 / Amount
146
274
265
540
97
193
222
416
Interest Expenses
増減率 / yoy chg.
50.4
42.0
19.0
29.7
489.9
544.7
61.2
147.4
持分法損失
金額 / Amount
Equity Loss on
Affiliates
480
480
▲ 480
—
—
—
—
—
増減率 / yoy chg.
—
—
—
—
—
—
—
—
情報機器賃貸費用
金額 / Amount
Lease Expenses of
System Equipment
121
242
197
440
97
208
193
402
増減率 / yoy chg.
23.9
16.3
2.0
9.4
▲ 45.5
▲ 51.1
▲ 47.3
▲ 49.4
固定資産除却損
金額 / Amount
Loss on Disposal of
Fixed Assets
28
37
62
100
8
14
53
67
増減率 / yoy chg.
237.8
153.6
18.2
47.6
▲ 48.2
▲ 53.3
34.4
▲ 4.5
その他
金額 / Amount
639
756
163
920
159
256
346
603
Other
増減率 / yoy chg.
301.5
194.6
▲ 52.9
52.4
▲ 7.9
▲ 32.8
▲ 5.9
▲ 19.6
1,490
営業外費用
金額 / Amount
935
1,310
689
2,000
362
673
816
Non-operating Expenses
157.9
94.7
▲ 15.6
34.2
▲ 5.7
▲ 22.6
▲ 10.7
▲ 16.5
2,246
4,924
10,075
15,000
2,432
5,481
9,143
14,625
3.1
▲ 7.6
3.5
▲ 10.2
6.3
10.2
5.0
2.6
3.8
80.1
4.3
102.6
6.0
▲ 6.8
5.2
16.9
1,269
特別利益
増減率 / yoy chg.
金額 / Amount
売上比 / % of Sales
増減率 / yoy chg.
金額 / Amount
—
—
—
—
—
—
1,269
Extraordinary Gains
増減率 / yoy chg.
—
—
—
—
—
—
123.5
23.3
特別損失
金額 / Amount
—
—
2,300
2,300
—
—
1,526
1,526
Extraordinary Losses
増減率 / yoy chg.
—
—
50.6
50.6
—
—
294.2
156.8
税前利益
金額 / Amount
Income before Income
Taxes and Minority
Interests
2,246
4,924
7,775
12,700
2,432
5,481
8,886
14,368
売上比 / % of Sales
3.1
3.5
4.9
4.2
3.8
4.3
5.9
5.1
増減率 / yoy chg.
▲ 7.6
▲ 10.2
▲ 12.5
▲ 11.6
51.6
85.1
▲ 11.1
10.9
1,121
2,196
▲ 696
1,500
1,046
2,135
4,615
6,750
経常利益
Ordinary Income
法人税、住民税
及び事業税
金額 / Amount
Corporate, Local and
Income Taxes
増減率 / yoy chg.
7.2
2.9
—
▲ 77.8
324.7
378.5
23.2
61.0
法人税等調整額
金額 / Amount
Adjustments to Income
Taxes
▲ 4,381
▲ 4,311
4,311
—
▲ 101
▲ 180
▲ 578
▲ 758
増減率 / yoy chg.
—
—
—
—
—
—
—
—
金額 / Amount
5,506
7,038
4,161
11,200
1,486
3,527
4,849
8,377
中間純利益
Net income
親会社株主に帰属する
中間純利益
増減率 / yoy chg.
270.4
99.6
▲ 14.2
33.7
63.3
114.6
▲ 25.4
2.8
金額 / Amount
5,507
6,987
4,212
11,200
1,499
3,500
4,852
8,352
売上比 / % of Sales
7.6
4.9
2.7
3.7
2.3
2.7
3.2
3.0
増減率 / yoy chg.
267.4
99.6
▲ 13.2
34.1
65.1
113.6
▲ 25.3
2.7
非支配株主に帰属する
中間純利益
金額 / Amount
▲0
51
▲ 51
—
▲ 12
27
▲3
24
Profit attributable to noncontrolling interests
増減率 / yoy chg.
—
88.4
—
—
—
399.8
—
49.8
Profit attributable to
owners of parent
1
Ⅰ.連結業績 / Consolidated Results
2.報告セグメント別業績 / Segment Information
(単位 :百万円)
(millions of yen)
2027年3月期 (実績・予想) / FY March 2027 (Results&Estimates)
報告セグメント
Gross Sales
売上高
Net Sales
売上総利益
Gross Profit
販管費
SG&A
営業利益
Operating Income
総売上高※1
Gross Sales
売上高
Net Sales
コンシューマ事業
Consumer Business
売上総利益
Gross Profit
販管費
SG&A
営業利益
Operating Income
総売上高※1
Gross Sales
売上高
Net Sales
ホールセール事業
Wholesale Business
売上総利益
Gross Profit
販管費
SG&A
営業利益
Operating Income
総売上高※1
Gross Sales
売上高
Net Sales
拡張事業
Other Business
売上総利益
Gross Profit
販管費
SG&A
営業利益
Operating Income
コーポレート※2
Corporate
上期
1st Half (Results)
下期
通期
第2四半期
上期
下期
通期
2Q
1st Half
2nd Half
Full Year
2nd Half (Estimates) Full Year (Estimates)
Segment
総売上高※1
オートバックス事業
AUTOBACS Business
第2四半期
2Q (Results)
2026年3月期 (実績) / FY March 2026 (Results)
営業利益
Operating Income
50,513
99,508
111,561
211,070
47,658
94,166
112,197
206,363
48,382
95,212
110,887
206,100
45,797
90,992
107,793
198,785
18,569
36,872
43,847
80,720
17,613
35,065
41,027
76,092
13,685
27,384
30,245
57,630
13,222
26,046
27,643
53,690
4,883
9,487
13,602
23,090
4,390
9,019
13,383
22,402
17,154
31,717
30,962
62,680
12,334
24,528
28,310
52,838
17,099
31,585
30,824
62,410
12,286
24,412
28,212
52,625
5,574
10,178
8,651
18,830
3,805
7,105
8,676
15,782
5,214
9,399
8,180
17,580
3,653
6,996
8,266
15,262
360
779
470
1,250
152
108
410
519
8,589
16,970
20,249
37,220
7,803
15,849
17,661
33,511
5,558
11,526
14,643
26,170
5,414
11,037
12,896
23,933
1,491
3,001
3,798
6,800
1,394
2,903
3,214
6,117
1,362
2,724
2,715
5,440
1,296
2,666
2,510
5,176
129
277
1,082
1,360
98
237
704
941
2,995
6,199
4,370
10,570
2,556
5,263
5,453
10,716
1,335
2,867
2,452
5,320
1,116
2,396
2,314
4,710
659
1,532
917
2,450
469
1,180
962
2,143
381
900
709
1,610
175
588
789
1,378
277
631
208
840
293
591
173
764
▲2,925
▲6,117
▲5,422
▲11,540
▲2,537
▲4,873
▲5,959
▲10,832
※1 「総売上高」はセグメント間の内部売上高および振替高を含む金額です。
"Gross Sales" includes the transactions with other segments.
※2 「 コーポレート」は各報告セグメントに配分していない全社経費であり、主に一般管理費です。
"Corporate" of Operating profit (loss) is the corporate administrative expense which is not allocable to each reportable segment.
2
Ⅰ.連結業績 / Consolidated Results
3.設備投資 / Capital Expenditures
(単位 : 百万円)
(millions of yen)
2027年3月期 (実績・予想) / FY March 2027 (Results&Estimates)
新規出店
New Store Openings
既存店改装・改修
Store Remodeling & Repair
土地
Land
情報化投資
IT Systems
その他
Other
設備投資計
Total Capital Expenditures
減価償却費
Depreciation
2026年3月期 (実績) / FY March 2026 (Results)
第2四半期
上期
下期
通期
第2四半期
上期
下期
通期
2Q (Results)
1st Half (Results)
2nd Half (Estimates)
Full Year (Estimates)
2Q
1st Half
2nd Half
Full Year
金額 / Amount
833
1,528
2,821
4,350
785
1,286
1,374
2,660
増減額 / yoy chg.
47
242
1,446
1,689
123
▲ 147
224
77
金額 / Amount
567
820
2,359
3,180
589
888
1,336
2,224
増減額 / yoy chg.
▲ 22
▲ 67
1,023
955
557
802
1,081
1,884
金額 / Amount
95
174
975
1,150
1,188
1,266
1,525
2,791
増減額 / yoy chg.
▲ 1,093
▲ 1,091
▲ 549
▲ 1,641
1,188
1,266
▲ 904
361
金額 / Amount
361
1,049
1,840
2,890
556
993
1,170
2,164
増減額 / yoy chg.
▲ 194
55
670
725
287
331
607
939
金額 / Amount
1,382
2,731
268
3,000
2,359
3,328
3,839
7,167
増減額 / yoy chg.
▲ 977
▲ 596
▲ 3,570
▲ 4,167
1,667
2,128
2,691
4,819
金額 / Amount
3,240
6,304
8,265
14,570
5,480
7,763
9,244
17,008
増減額 / yoy chg.
▲ 2,239
▲ 1,458
▲ 979
▲ 2,438
3,825
4,381
3,700
8,082
金額 / Amount
1,795
3,497
4,002
7,500
1,512
3,035
3,354
6,389
増減額 / yoy chg.
282
461
648
1,110
157
344
396
741
Ⅰ.連結業績 / Consolidated Results
4.海外子会社国別の損益 / Sales and Profits by Country
(単位 : 百万円、%)
(millions of yen, %)
2027年3月期 (実績・予想) / FY March 2027 (Results&Estimates)
売上高 / Net Sales
2026年3月期 (実績) / FY March 2026 (Results)
第2四半期
上期
下期
通期
第2四半期
上期
下期
通期
2Q (Results)
1st Half (Results)
2nd Half (Estimates)
Full Year (Estimates)
2Q
1st Half
2nd Half
Full Year
5,575
9,230
1,874
3,654
2,091
3,968
3,677
7,645
フランス
増減率 / yoy chg.
▲ 10.3
▲ 7.9
51.6
20.7
▲ 1.8
▲ 5.8
1.7
▲ 2.4
France
営業利益 / Operating Income
▲ 186
▲ 483
283
▲ 200
▲ 109
▲ 277
▲ 376
▲ 654
増減率 / yoy chg.
-
-
-
-
-
-
-
-
売上高 / Net Sales
676
1,245
1,684
2,930
615
1,192
1,215
2,408
オーストラリア
増減率 / yoy chg.
9.8
4.4
38.6
21.6
0.2
▲ 0.6
▲ 3.7
▲ 2.2
Australia
営業利益 / Operating Income
41
53
126
180
26
31
64
95
増減率 / yoy chg.
55.6
73.7
96.8
89.3
-
-
142.2
-
売上高 / Net Sales
389
853
1,296
2,150
499
967
1,064
2,032
5.1
シンガポール
増減率 / yoy chg.
▲ 22.1
▲ 11.8
21.8
5.8
7.8
0.4
9.7
Singapore
営業利益 / Operating Income
▲ 34
▲ 35
45
10
▲4
▲8
12
4
増減率 / yoy chg.
-
-
251.0
124.4
-
-
-
-
2,741
売上高 / Net Sales
1,000
2,029
2,680
4,710
667
1,513
1,227
中国
増減率 / yoy chg.
49.8
34.1
118.3
71.8
104.1
157.0
▲ 9.2
41.2
China
営業利益 / Operating Income
37
89
120
210
53
118
17
136
▲ 30.3
▲ 25.0
603.3
54.4
-
-
▲ 52.7
-
増減率 / yoy chg.
売上高 / Net Sales
23
96
133
230
39
86
76
163
マレーシア
増減率 / yoy chg.
▲ 40.2
10.7
74.3
40.5
▲ 7.4
14.3
▲ 28.5
▲ 10.7
Malaysia
営業利益 / Operating Income
▲4
1
8
10
▲4
▲6
▲ 15
▲ 22
-
-
-
-
-
-
-
-
増減率 / yoy chg.
3
Ⅱ.報告セグメント別情報 / Information by Reportable Segment
- オートバックス事業 / AUTOBACS Business
(1)商品別・部門別売上高 / Net Sales Breakdown by Type of Operation and Merchandise
(単位 : 百万円、% / millions of yen, %)
2027年3月期 (実績) / FY March 2027 (Results)
第2四半期 / 2Q
タイヤ・ホイール
Tires and Wheels
卸
売
部
門
/
W
H
O
L
E
S
A
L
E
カーエレクトロニクス
Car Electronics
オイル・バッテリー
Oil and Batteries
アクセサリー・メンテナンス用品
Accessories and maintenance
車検・サービス
Statutory safety inspections and
services
その他
Others
小計
Sub Total
タイヤ・ホイール
Tires and Wheels
カーエレクトロニクス
Car Electronics
小
売
部
門
オイル・バッテリー
Oil and Batteries
アクセサリー・メンテナンス用品
/
R
E
T
A
I
L
Accessories and maintenance
車検・サービス
Statutory safety inspections and
services
車販売
Car sales
その他
Others
小計
Sub Total
タイヤ・ホイール
Tires and Wheels
A
B
事
業
計
カーエレクトロニクス
Car Electronics
オイル・バッテリー
Oil and Batteries
/
アクセサリー・メンテナンス用品
W
H
O
L
E
S
A
L
E
+
R
E
T
A
I
L
Accessories and maintenance
車検・サービス
Statutory safety inspections and
services
車販売
Car sales
その他
Others
総合計
Total
セグメント間取引
Intersegment Transactions
総売上高
Gross Sales
上期 / 1st Half
2026年3月期 (実績) / FY March 2026 (Results)
第2四半期 / 2Q
上期 / 1st Half
下期 / 2nd Half
通期 / Full Year
売上高 / Sales
構成比 / % of Sales
増減率 / yoy
売上高 / Sales
構成比 / % of Sales
増減率 / yoy
売上高 / Sales
構成比 / % of Sales
増減率 / yoy
売上高 / Sales
構成比 / % of Sales
増減率 / yoy
売上高 / Sales
構成比 / % of Sales
増減率 / yoy
売上高 / Sales
構成比 / % of Sales
増減率 / yoy
売上高 / Sales
構成比 / % of Sales
増減率 / yoy
売上高 / Sales
構成比 / % of Sales
増減率 / yoy
売上高 / Sales
構成比 / % of Sales
増減率 / yoy
売上高 / Sales
構成比 / % of Sales
増減率 / yoy
売上高 / Sales
構成比 / % of Sales
増減率 / yoy
売上高 / Sales
構成比 / % of Sales
増減率 / yoy
売上高 / Sales
構成比 / % of Sales
増減率 / yoy
売上高 / Sales
構成比 / % of Sales
増減率 / yoy
売上高 / Sales
構成比 / % of Sales
増減率 / yoy
売上高 / Sales
構成比 / % of Sales
増減率 / yoy
売上高 / Sales
構成比 / % of Sales
増減率 / yoy
売上高 / Sales
構成比 / % of Sales
増減率 / yoy
売上高 / Sales
構成比 / % of Sales
増減率 / yoy
売上高 / Sales
構成比 / % of Sales
増減率 / yoy
売上高 / Sales
構成比 / % of Sales
増減率 / yoy
売上高 / Sales
構成比 / % of Sales
増減率 / yoy
売上高 / Sales
構成比 / % of Sales
増減率 / yoy
売上高 / Sales
8,519
36.0
13.4
2,456
10.4
▲ 5.5
3,021
12.8
20.4
4,948
20.9
▲ 2.7
428
1.8
6.1
4,291
18.1
4.1
23,665
100.0
6.4
4,294
17.4
7.8
1,847
7.5
1.2
2,788
11.3
23.5
4,613
18.7
9.2
5,303
21.5
9.3
2,748
11.1
▲ 5.4
3,121
12.6
▲ 11.2
24,717
100.0
4.9
15,601
34.0
8.2
5,627
12.3
▲ 1.9
5,014
10.9
5.4
9,895
21.6
▲ 3.1
926
2.0
▲ 1.3
8,793
19.2
1.9
45,859
100.0
2.6
8,697
17.6
8.2
3,627
7.4
2.4
5,042
10.2
24.3
9,367
19.0
10.4
10,839
22.0
10.1
5,613
11.4
0.7
6,165
12.5
▲ 8.8
49,352
100.0
6.6
12,814
26.5
11.5
4,303
8.9
▲ 2.7
5,809
12.0
21.9
9,561
19.8
2.7
5,732
11.8
9.0
2,748
5.7
▲ 5.4
7,412
15.3
▲ 3.0
48,382
100.0
5.6
24,298
25.5
8.2
9,254
9.7
▲ 0.3
10,057
10.6
14.1
19,262
20.2
3.0
11,765
12.4
9.1
5,613
5.9
0.7
14,959
15.7
▲ 2.8
95,212
100.0
4.6
2,130
4,295
増減率 / yoy
14.5
35.4
53.5
34.1
69.2
52.4
売上高 / Sales
50,513
99,508
47,658
94,166
112,197
206,363
増減率 / yoy
6.0
5.7
4.7
5.5
4.1
4.7
4
7,511
33.8
14.2
2,599
11.7
▲ 1.3
2,508
11.3
▲ 3.8
5,083
22.9
0.5
404
1.8
▲ 11.4
4,124
18.6
▲ 4.5
22,231
100.0
2.7
3,983
16.9
13.0
1,824
7.7
▲ 3.9
2,258
9.6
7.4
4,224
17.9
1.5
4,853
20.6
5.6
2,904
12.3
1.7
3,515
14.9
0.0
23,565
100.0
4.0
11,494
25.1
13.8
4,424
9.7
▲ 2.4
4,767
10.4
1.2
9,308
20.3
0.9
5,258
11.5
4.0
2,904
6.3
1.7
7,640
16.7
▲ 2.5
45,797
100.0
3.4
1,860
14,418
32.3
11.1
5,738
12.8
▲ 4.1
4,759
10.6
▲ 1.2
10,211
22.8
▲ 1.3
939
2.1
▲ 9.4
8,628
19.3
1.3
44,696
100.0
2.3
8,035
17.4
14.8
3,542
7.7
1.1
4,057
8.8
9.5
8,487
18.3
4.6
9,842
21.3
9.7
5,573
12.0
4.5
6,758
14.6
2.1
46,295
100.0
7.1
22,453
24.7
12.4
9,280
10.2
▲ 2.2
8,817
9.7
3.4
18,699
20.6
1.3
10,781
11.8
7.7
5,573
6.1
4.5
15,386
16.9
1.7
90,992
100.0
4.7
3,173
22,043
40.7
8.5
5,681
10.5
▲ 7.3
5,146
9.5
▲ 8.4
10,720
19.8
▲ 1.0
887
1.6
▲ 24.6
9,737
18.0
▲ 0.5
54,218
100.0
0.7
12,613
23.5
5.8
3,351
6.3
▲ 2.8
4,730
8.8
7.4
9,507
17.7
4.5
10,913
20.4
7.2
5,865
10.9
4.0
6,593
12.3
▲ 0.8
53,574
100.0
4.4
34,657
32.2
7.5
9,033
8.4
▲ 5.7
9,876
9.2
▲ 1.5
20,227
18.8
1.5
11,801
10.9
3.9
5,865
5.4
4.0
16,331
15.2
▲ 0.6
107,793
100.0
2.5
4,403
36,462
36.9
9.5
11,420
11.5
▲ 5.7
9,906
10.0
▲ 5.1
20,931
21.2
▲ 1.2
1,826
1.8
▲ 17.5
18,366
18.6
0.3
98,914
100.0
1.4
20,648
20.7
9.1
6,893
6.9
▲ 0.8
8,787
8.8
8.3
17,994
18.0
4.5
20,755
20.8
8.4
11,438
11.5
4.3
13,351
13.4
0.7
99,870
100.0
5.6
57,111
28.7
9.3
18,314
9.2
▲ 3.9
18,693
9.4
0.8
38,926
19.6
1.4
22,582
11.4
5.7
11,438
5.8
4.3
31,718
16.0
0.5
198,785
100.0
3.5
7,577
Ⅱ.報告セグメント別情報 / Information by Reportable Segment
- オートバックス事業 / AUTOBACS Business
(2)オートバックスチェン小売売上高(FC含む) / AUTOBACS Chain Retail Sales (Including FC Stores)
(単位 : 百万円、%)
(全店 / total store basis)
(millions of yen, %)
2027年3月期 (実績) / FY March 2027
(Results)
第2四半期
2Q
2026年3月期 (実績) / FY March 2026 (Results)
第2四半期
2Q
上期
1st Half
上期
下期
通期
1st Half
2nd Half
Full Year
サービス
売上高 / Category Sales
17,568
36,107
16,913
34,889
38,109
Services
増減率 / yoy chg.
3.8
3.4
5.0
7.0
5.3
6.1
構成比 / % of Total Retail Sales
29.0
29.8
29.2
30.0
27.3
28.5
タイヤ
売上高 / Category Sales
13,215
26,924
12,502
25,847
38,479
64,327
Tires
増減率 / yoy chg.
5.7
4.1
12.1
10.2
5.3
7.2
構成比 / % of Total Retail Sales
21.8
22.2
21.6
22.2
27.5
25.1
ホイール
売上高 / Category Sales
854
1,831
810
1,824
6,250
8,075
Wheels
増減率 / yoy chg.
5.4
0.3
1.6
1.1
▲ 2.9
▲ 2.0
カーエレクトロニクス
Car Electronics
オイル
Oil
バッテリー
Batteries
メンテナンス ※1
Maintenance Parts
アクセサリー ※2
Accessories
カーリペア ※3
Car Repair Parts
カースポーツ
Motor Sports Goods
カーレジャー
Car Leisure
マイクロモビリティ
Micro Mobility
合計 / Total
72,999
構成比 / % of Total Retail Sales
1.4
1.5
1.4
1.6
4.5
3.2
売上高 / Category Sales
5,920
11,601
6,183
11,997
11,260
23,258
▲ 5.7
増減率 / yoy chg.
▲ 4.3
▲ 3.4
▲ 7.9
▲ 5.1
▲ 6.3
構成比 / % of Total Retail Sales
9.8
9.6
10.7
10.3
8.1
9.1
売上高 / Category Sales
5,831
10,926
4,429
8,612
8,512
17,125
4.6
増減率 / yoy chg.
31.6
26.8
5.0
5.0
4.2
構成比 / % of Total Retail Sales
9.6
9.0
7.6
7.4
6.1
6.7
売上高 / Category Sales
3,562
6,074
3,516
5,878
8,019
13,898
7.3
増減率 / yoy chg.
1.3
3.3
7.6
8.3
6.6
構成比 / % of Total Retail Sales
5.9
5.0
6.1
5.1
5.7
5.4
売上高 / Category Sales
3,158
6,618
3,006
6,365
9,485
15,851
▲ 1.3
増減率 / yoy chg.
5.0
3.9
0.9
2.2
▲ 3.5
構成比 / % of Total Retail Sales
5.2
5.5
5.2
5.5
6.8
6.2
売上高 / Category Sales
5,223
10,025
5,562
10,601
8,541
19,143
▲ 1.1
増減率 / yoy chg.
▲ 6.2
▲ 5.5
▲ 0.2
0.1
▲ 2.5
構成比 / % of Total Retail Sales
8.6
8.3
9.6
9.1
6.1
7.5
売上高 / Category Sales
2,731
5,785
2,546
5,591
5,841
11,433
2.3
増減率 / yoy chg.
7.2
3.4
0.4
0.3
4.2
構成比 / % of Total Retail Sales
4.5
4.8
4.4
4.8
4.2
4.5
売上高 / Category Sales
2,331
4,638
2,246
4,407
4,779
9,186
1.0
増減率 / yoy chg.
3.7
5.2
▲ 3.3
▲ 2.2
4.2
構成比 / % of Total Retail Sales
3.8
3.8
3.9
3.8
3.4
3.6
売上高 / Category Sales
213
440
140
276
407
683
50.5
増減率 / yoy chg.
52.3
59.4
37.9
30.4
68.0
構成比 / % of Total Retail Sales
0.4
0.4
0.2
0.2
0.3
0.3
売上高 / Category Sales
70
141
48
91
114
205
32.3
増減率 / yoy chg.
44.0
54.6
31.7
15.4
49.8
構成比 / % of Total Retail Sales
0.1
0.1
0.1
0.1
0.1
0.1
売上高 / Total Major Store Sales
60,680
121,115
57,905
116,384
139,803
256,187
4.7
4.0
3.8
4.5
2.8
3.6
増減率 / yoy chg.
(既存店 / yoy sales growth rate in comparable store basis)
(%)
2027年3月期 (実績) / FY March 2027
(Results)
第2四半期
2Q
2026年3月期 (実績) / FY March 2026 (Results)
第2四半期
2Q
上期
1st Half
上期
下期
通期
1st Half
2nd Half
Full Year
サービス / Services
3.9
3.1
4.4
6.4
4.5
タイヤ / Tires
5.3
3.5
11.0
9.2
4.1
6.1
ホイール / Wheels
5.2
▲ 0.2
0.3
0.0
▲ 4.1
▲ 3.2
5.4
▲ 4.2
▲ 3.6
▲ 8.6
▲ 5.9
▲ 7.1
▲ 6.5
オイル / Oil
32.0
26.8
4.3
4.4
3.5
4.0
バッテリー / Batteries
1.4
3.2
6.9
7.6
5.8
6.6
5.2
3.7
0.2
1.5
▲ 4.3
▲ 2.1
▲ 6.2
▲ 5.8
▲ 1.0
▲ 0.8
▲ 3.3
▲ 1.9
7.3
3.1
▲ 0.4
▲ 0.4
3.3
1.4
カースポーツ / Motor Sport Goods
3.6
5.0
▲ 3.7
▲ 2.6
3.6
0.5
カーレジャー / Car Leisure
43.1
50.7
37.7
30.3
61.6
47.0
マイクロモビリティ / Micro Mobility
37.5
46.1
32.1
15.6
40.7
27.9
合計 / Total
4.7
3.7
3.0
3.8
1.9
2.7
カーエレクトロニクス / Car Electronics
メンテナンス / Maintenance Parts
アクセサリー / Accessories
カーリペア / Car Repair Parts
※1
※2
※3
注意: 対象業態はオートバックス、オートバックスガレージ、スーパーオートバックス、A PIT AUTOBACS、ASM、Smart+1、オートバックスエクスプレス、オートバックスカーズです。
NOTE: The figures Includes total store sales of AUTOBACS (includes Smart+1, AUTOBACS GARAGE), Super AUTOBACS(includes A PIT AUTOBACS), ASM, and AUTOBACS CARS.
※1 メンテナンスの主な商品は、ワイパーやタイヤチェーンなどです。The main merchandise of Maintenance Parts are windshield wipers and tire chains, etc.
※2 アクセサリーの主な商品は、芳香剤やクッション、携帯電話関連商品などです。The main merchandise of Accessories are air fresheners, cushions and mobile phone related items, etc.
※3 カーリペアの主な商品は、洗車用品や補修用品などです。The main merchandise of Car Repair Parts are car washing supplies and repair tools, etc.
5
Ⅱ.報告セグメント別情報 / Information by Reportable Segment
2.コンシューマ事業 / Consumer Business
(1)拠点・ブランド別売上高 / Breakdown of Sales by Store Location and Brand
(単位 :百万円)
(millions of yen)
2027年3月期 (実績) /
FY March 2027 (Results)
第2四半期
2Q
2026年3月期 (実績) / FY March 2026 (Results)
第2四半期
2Q
上期
1st Half
上期
下期
通期
1st Half
2nd Half
Full Year
ディーラー※1
Car dealership
売上高 / Net Sales
6,223
10,252
3,999
7,887
8,806
16,693
ビーライン※2
Bee Line
売上高 / Net Sales
1,977
4,689
2,177
4,469
4,024
8,493
オートバックスカーズ※3
AUTOBACS Cars
売上高 / Net Sales
2,437
4,582
1,943
4,050
4,197
8,247
オトロン※4
Otoron
売上高 / Net Sales
2,584
4,819
1,485
3,020
4,127
7,147
オンラインストア※5
Online Store
売上高 / Net Sales
2,329
4,513
1,619
3,169
4,380
7,550
その他
Others
売上高 / Net Sales
1,547
2,727
1,060
1,815
2,676
4,492
セグメント間取引
Intersegment
Transactions
売上高 / Net Sales
54
132
48
116
97
213
17,154
31,717
12,334
24,528
28,310
52,838
コンシューマ事業計
総売上高※6 / Gross Sales
Total Consumer Business
※1「ディーラー」は Audi、Honda、BYD、ボルボを展開しております。
"Dealer" handles Audi, Honda, BYD, and Volvo brands.
※2「ビーライン」タイヤ専業店を展開するビーライン本部の売上高および直営店舗の売上高を含む金額です。
"Bee Line" includes sales from the Bee Line headquarters and its Company-operated stores.
※3「オートバックスカーズ」はオートバックスカーズ本部およびオートバックスカーズ直営・子会社の売上高を含む金額です。
"AUTOBACS Cars" includes sales from the AUTOBACS CARS headquarters, as well as its Company-operated and subsidiary stores.
※4「オトロン」は自社ローン専門の中古車販売店です。
"Otoron" is a used car dealership specializing in in-house auto loans based on its own screening criteria.
※5「オンラインストア」は自社ECサイトおよびECモールが含まれています。
"Online Store" includes e-commerce malls.
※6「総売上高」はセグメント間の内部売上高および振替高を含む金額です。
"Gross Sales" includes the transactions with other segments.
Ⅱ.報告セグメント別情報 / Information by Reportable Segment
3.ホールセール事業 / Wholesale Business
(1)国内海外別売上高 / Domestic and Overseas Sales
(単位 :百万円)
(millions of yen)
2027年3月期 (実績) /
FY March 2027 (Results)
第2四半期
2Q
2026年3月期 (実績) / FY March 2026 (Results)
第2四半期
2Q
上期
1st Half
上期
下期
通期
1st Half
2nd Half
Full Year
国内卸売
Domestic Wholesale
売上高 / Net Sales
4,569
9,838
4,704
9,639
11,496
21,136
海外卸売
Overseas Wholesale
売上高 / Net Sales
988
1,687
709
1,398
1,399
2,797
セグメント間取引
Intersegment
Transactions
売上高 / Net Sales
3,031
5,443
2,388
4,812
4,765
9,577
総売上高※6 / Gross Sales
8,589
16,970
7,803
15,849
17,661
33,511
ホールセール事業計
Total Wholesale Business
※6「総売上高」はセグメント間の内部売上高および振替高を含む金額です。
"Gross Sales" includes the transactions with other segments.
6
Ⅲ. 店舗の出退店状況 / Number of Stores by Store Type
(単位:店)
(stores)
退店 / closure
法人変更 / change in ownership
第2四半期末店舗数 / No. of
stores at Sep 30, 2025
新店 / newly built
退店 / closure
法人変更 / change in ownership
上期末店舗数 / No. of
stores at Sep 30, 2025
新店 / newly built
退店 / closure
法人変更 / change in ownership
2026年3月末店舗数 / No.
of stores at Mar 31, 2026
新店 / newly built
退店 / closure
法人変更 / change in ownership
第2四半期末店舗数 / No. of
stores at Sep 30, 2026
新店 / newly built
退店 / closure
法人変更 / change in ownership
上期末店舗数 / No. of
stores at Sep 30, 2026
新店 / newly built
退店 / closure
法人変更 / change in ownership
2027年3月末店舗数 / No.
of stores at Mar 31, 2027
2027年3月期増減 / Change in No. of
stores in FY 2027
2027年3月期 (実績・予想) / FY March 2027 (Results&Estimates)
新店 / newly built
2026年3月期 (実績) / FY March 2026 (Results)
AUTOBACS
1
0
-4
376
1
0
-4
376
2
0
-2
376
0
0
0
370
0
0
-6
370
2
-1
0
371
-5
AUTOBACS GARAGE
0
0
0
0
0
0
0
0
0
0
0
0
0
0
0
0
0
0
0
0
0
0
0
0
0
Super AUTOBACS
0
0
0
47
0
0
0
47
0
0
-1
46
0
0
0
46
0
0
0
46
0
0
0
46
0
A PIT AUTOBACS
0
0
0
0
0
0
0
0
0
0
0
0
0
0
0
0
0
0
0
0
0
0
0
0
0
ASM
0
0
0
5
0
0
0
5
2
0
0
7
0
0
0
8
1
0
0
8
1
0
0
9
2
Smart+1
0
0
0
4
0
0
0
4
0
0
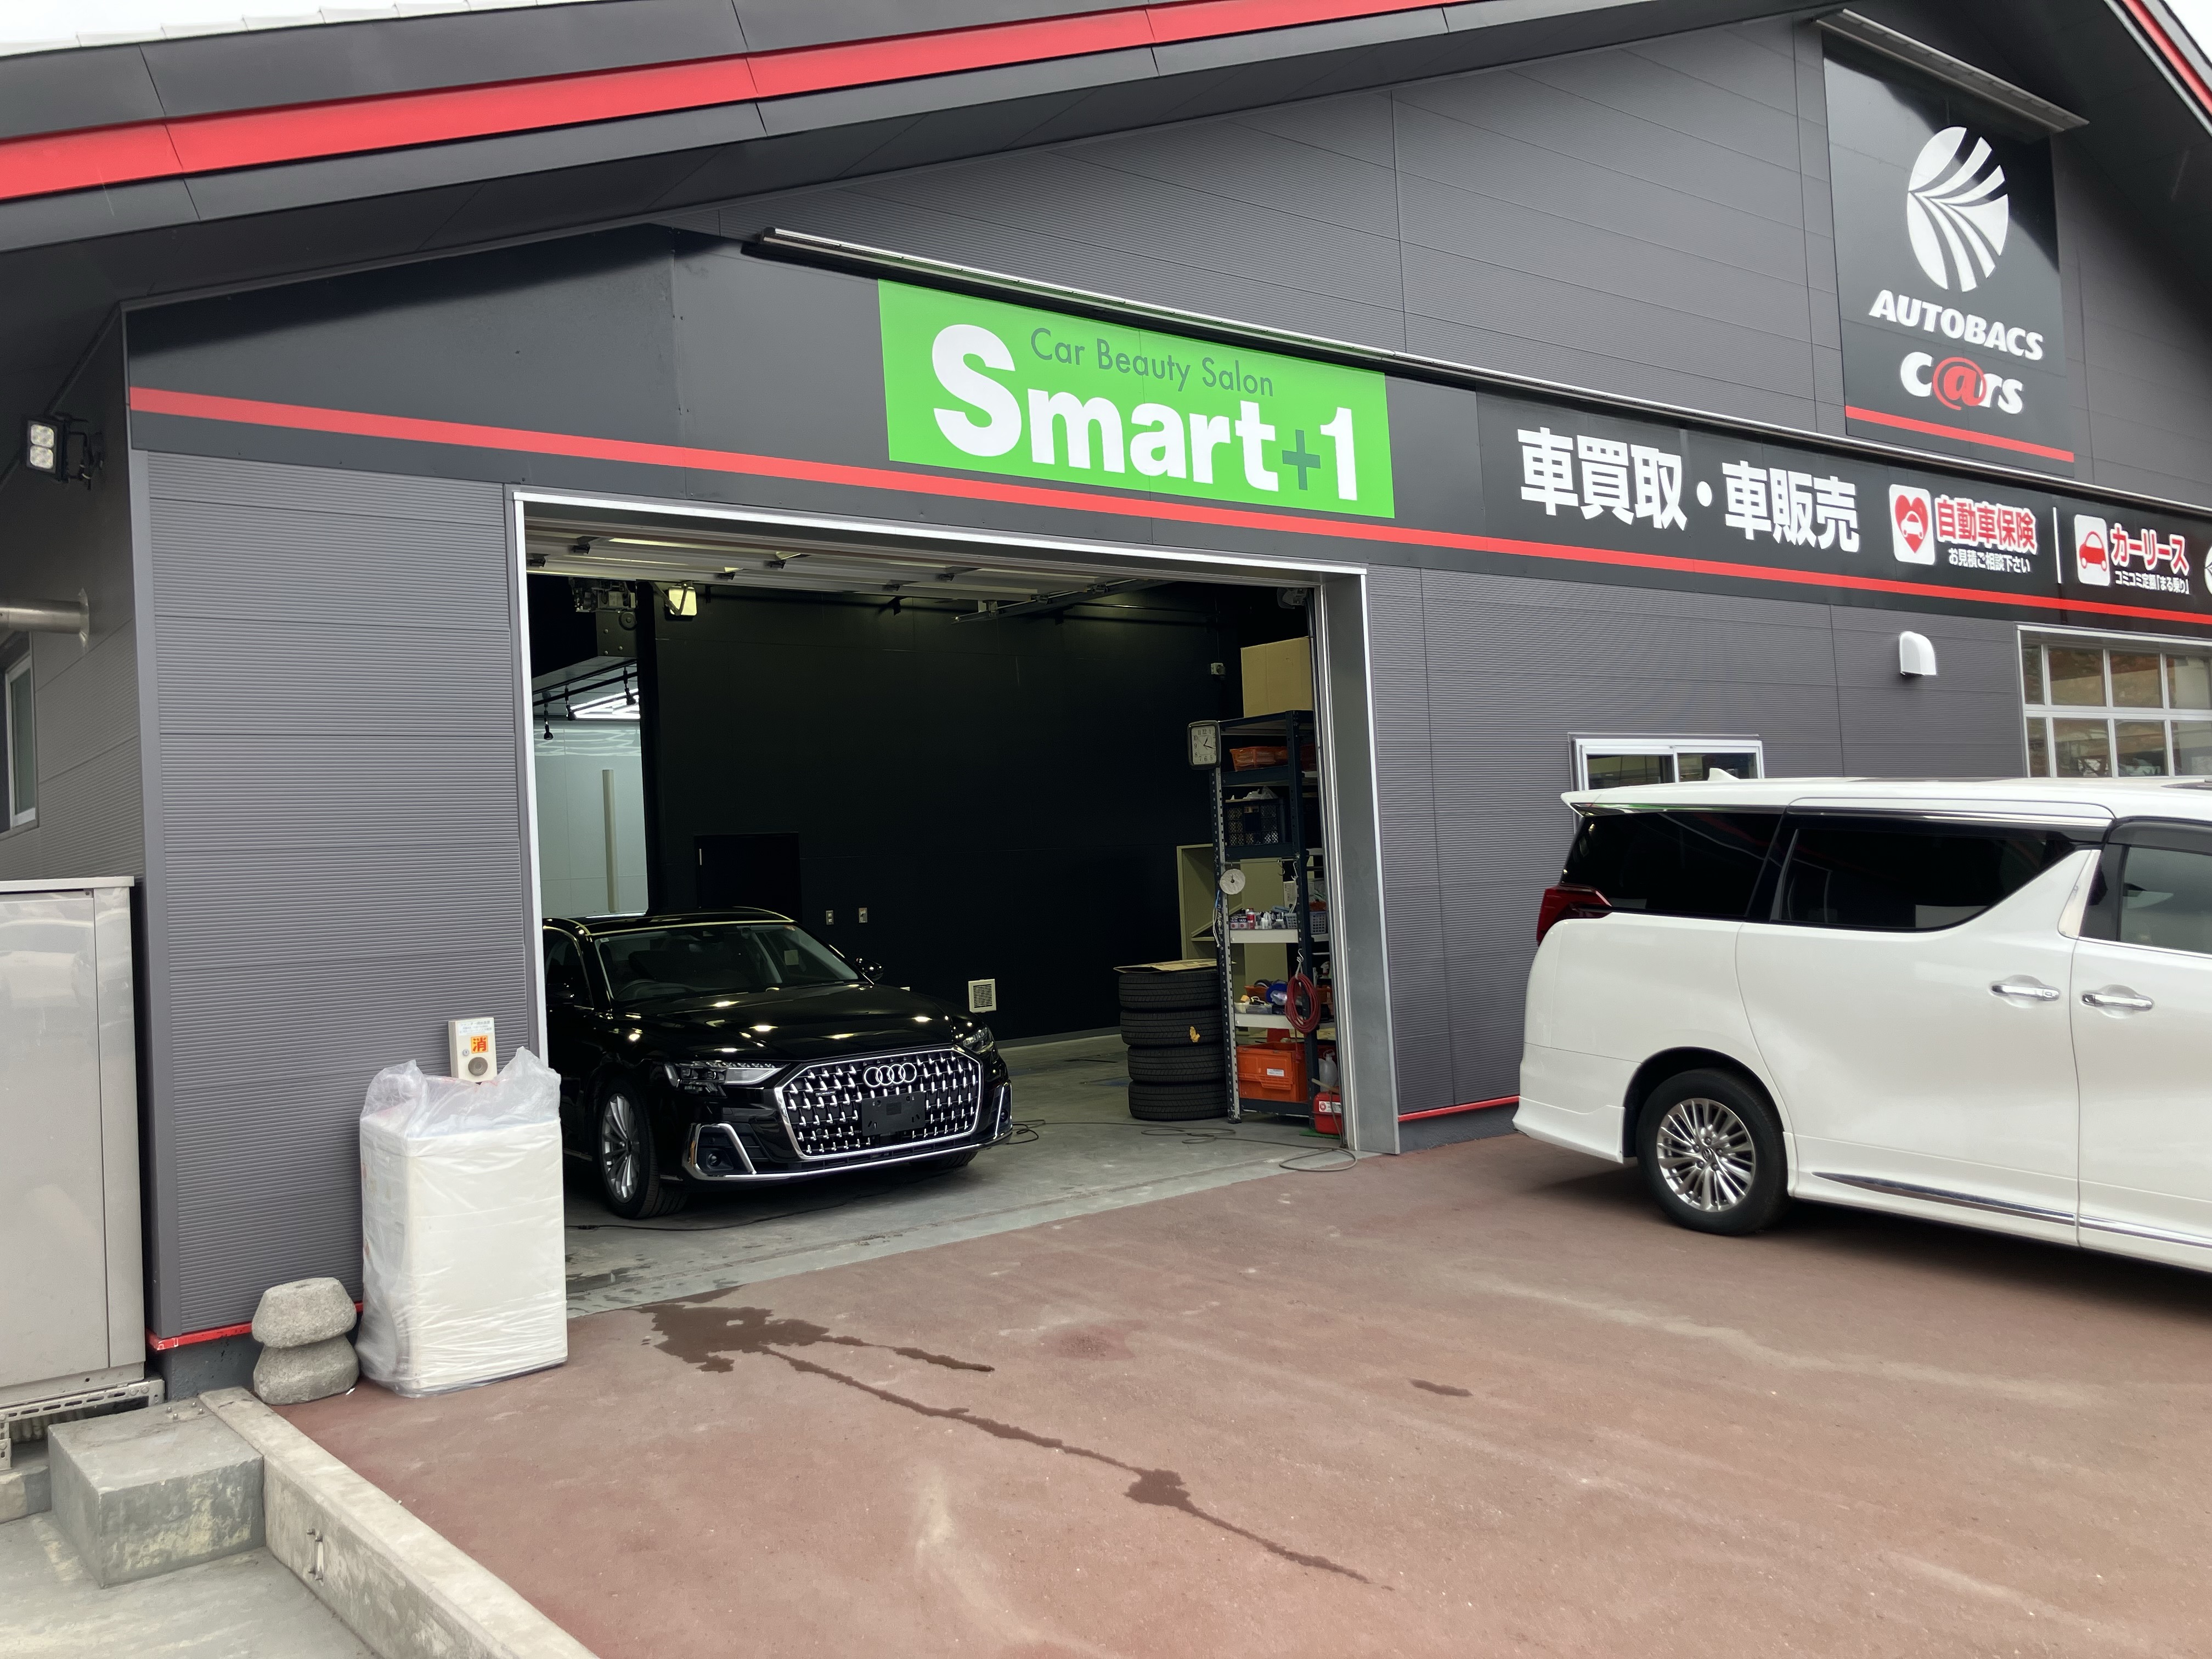
0
4
1
0
0
5
1
0
0
5
2
0
0
7
3
AUTOBACS Express
0
0
0
7
0
0
0
7
0
0
0
7
0
0
0
7
0
0
0
7
0
0
0
7
0
AUTOBACS CARS
1
0
-4
288
6
0
-4
288
3
0
-2
289
0
0
0
285
2
0
-6
285
0
0
0
285
-4
-8
727
7
0
-8
727
7
0
-5
729
1
0
0
721
4
0
-12
721
5
-1
0
725
-4
4
136
2
4
136
5
2
143
2
155
6
6
155
2
第2四半期
上期
1st Half
2Q
第2四半期(実績)
下期
2nd Half
上期(実績)
1st Half (Results)
2Q (Results)
下期(予想)
2nd Half (Estimates)
国内 / Domestic
FC
小計 / Subtotal
2
0
直営&子会社 / Company & Subsidiaires
AUTOBACS
1
157
14
1
1
1
1
0
25
25
25
25
0
1
3
4
4
4
1
13
1
14
13
13
13
-1
10
10
4
14
15
20
6
4
4
4
4
AUTOBACS GARAGE
1
1
Super AUTOBACS
24
24
A PIT AUTOBACS
2
2
ASM
13
Smart+1
AUTOBACS Express
AUTOBACS CARS
1
1
4
121
9
-1
1
4
121
4
-1
2
126
1
-1
1
-1
1
15
5
4
135
4
-1
6
135
1
4
0
136
10
小計 / Subtotal
2
0
8
311
12
-1
8
311
15
-1
5
330
3
-1
0
352
12
-2
12
352
8
0
0
360
30
FC・直営・子会社合計 /
Total (FC, Company, Subsidiary)
4
0
0
1,038
19
-1
0
1,038
22
-1
0
1,059
4
-1
0
1,073
16
-2
0
1,073
13
-1
0
1,085
26
22
2
22
1
23
5
29
6
29
1
1
-5
75
1
75
2
77
6
86
9
86
4
21
4
ストアブランド / Store Brand
Car Dealership
BEE LINE
-5
Otoron
2
19
2
19
2
AUTO IN
70
79
71
79
4
-1
小計 / Subtotal
73
-5
0
195
76
-5
0
195
9
-1
AUTOBACS
2
0
0
512
3
0
0
512
7
0
AUTOBACS GARAGE
0
0
0
1
0
0
0
1
0
Super AUTOBACS
0
0
0
71
0
0
0
71
A PIT AUTOBACS
0
0
0
2
0
0
0
ASM
0
0
0
18
1
-1
Smart+1※
0
0
0
14
0
AUTOBACS Express
0
0
0
11
AUTOBACS CARS※
2
0
0
Car Dealership
0
0
BEE LINE
1
Otoron
AUTO IN
21
21
-1
4
-3
0
223
20
0
528
9
0
0
1
0
0
0
0
71
0
4
0
0
0
4
1
0
21
1
0
0
22
1
0
0
20
7
0
0
27
9
0
0
0
11
0
0
0
11
0
420
6
-1
0
420
1
0
0
421
6
5
29
6
29
1
0
0
30
7
6
86
9
86
4
-1
0
89
12
21
0
21
4
0
0
25
4
79
1
79
0
0
0
79
-3
1,304
22
-2
-2
79
1
-4
0
203
12
-2
0
519
2
0
0
215
16
-4
0
215
9
-1
0
525
6
0
0
525
4
-1
0
0
1
0
0
0
1
0
0
0
1
0
0
0
0
71
0
0
0
71
0
0
0
71
2
1
0
0
3
0
0
0
4
1
0
0
0
18
3
0
0
21
0
0
0
21
1
-1
0
0
14
4
0
0
18
1
0
0
20
2
0
0
0
11
0
0
0
11
0
0
0
11
409
15
0
0
409
7
-1
0
415
1
-1
0
0
22
2
0
0
22
1
0
0
23
-5
0
75
1
-5
0
75
2
0
0
77
2
0
0
19
70
0
0
79
2
0
0
19
2
0
0
21
71
0
0
79
4
-1
0
82
1
0
0
9
78
-5
0
1,242
1
0
0
9
96
-6
0
1,242
31
-2
台湾 / Taiwan
6
0
シンガポール / Singapore
2
0
0
6
0
0
0
0
2
0
0
0
125
3
0
125
2
0
0
127
フランス / France
8
0
0
8
0
0
0
マレーシア / Malaysia
4
0
0
4
0
-4
インドネシア / Indonesia
0
0
0
6
0
6
0
0
6
151
3
0
151
1
9
6
1,271
22
-2
79
0
-4
16
7
1,304
39
-6
6
5
0
-1
5
0
2
2
0
0
2
0
128
1
0
128
8
8
0
0
0
0
0
0
0
0
6
0
0
0
0
0
6
6
0
0
2
-4
0
149
149
1
-1
0
12
79
1
Other
7
89
25
82
国内合計 / Total Domestic
30
-3
0
16
0
16
7
0
1,324
53
0
5
-1
0
2
0
6
0
134
7
8
0
0
8
0
0
0
0
0
0
0
0
0
0
0
0
-6
6
0
0
6
0
149
6
0
155
6
0
海外 / Overseas
タイ / Thailand
3
フィリピン / Philippines
海外合計 / Total Oversease
3
0
0
0
※インショップ、併設店を含みます。 Includes in-shops and attached stores.
7
1
1
0
0
0
0
Ⅳ.単体業績 / Non-consolidated Results
損益計算書 / Statements of Income
(単位 : 百万円、%)
(millions of yen, %)
2027年3月期 (実績・予想) / FY March 2027 (Results&Estimates)
2026年3月期 (実績) / FY March 2026 (Results)
第2四半期
上期
下期
通期
第2四半期
上期
下期
通期
2Q (Results)
1st Half (Results)
2nd Half (Estimates)
Full Year (Estimates)
2Q
1st Half
2nd Half
Full Year
売上高
金額 / Amount
43,782
85,699
102,540
188,240
40,067
81,344
95,683
Net Sales
増減率 / yoy chg.
9.3
5.4
7.2
6.3
6.2
9.5
5.3
7.1
金額 / Amount
32,592
63,913
78,736
142,650
30,116
61,277
72,352
133,629
増減率 / yoy chg.
8.2
4.3
8.8
6.8
6.5
9.0
5.1
6.9
金額 / Amount
11,189
21,785
23,804
45,590
9,950
20,067
23,331
43,398
25.6
25.4
23.2
24.2
24.8
24.7
24.4
24.5
売上原価
Cost of Goods Sold
売上総利益
Gross Profit
販売費及び一般管理費
SG&A Expenses
営業利益
Operating Income
売上比 / % of Sales
177,028
増減率 / yoy chg.
12.4
8.6
2.0
5.0
5.2
10.8
5.7
8.0
金額 / Amount
8,413
16,799
17,820
34,620
7,874
15,780
16,736
32,516
売上比 / % of Sales
19.2
19.6
17.4
18.4
19.7
19.4
17.5
18.4
増減率 / yoy chg.
6.9
6.5
6.5
6.5
1.6
4.7
6.0
5.4
金額 / Amount
2,776
4,986
5,983
10,970
2,076
4,286
6,595
10,882
売上比 / % of Sales
6.3
5.8
5.8
5.8
5.2
5.3
6.9
6.1
増減率 / yoy chg.
33.7
16.3
▲ 9.3
0.8
22.0
41.3
5.0
16.8
373
受取利息
金額 / Amount
140
262
57
320
92
163
209
Interest Income
増減率 / yoy chg.
52.7
60.4
▲ 72.6
▲ 14.3
77.0
54.1
69.3
62.3
受取配当金
金額 / Amount
7
1,659
40
1,700
72
1,388
78
1,466
Dividend Income
増減率 / yoy chg.
▲ 90.1
19.5
▲ 48.2
15.9
169.1
14.7
1.2
13.9
受取家賃
金額 / Amount
10
20
9
30
10
20
19
39
Rental Income
増減率 / yoy chg.
5.1
1.2
▲ 51.7
▲ 24.5
▲ 23.1
▲ 23.0
▲ 9.9
▲ 17.1
情報機器賃貸料
金額 / Amount
Lease Revenue of
System Equipment
180
362
227
590
174
373
368
742
増減率 / yoy chg.
3.6
▲ 2.9
▲ 38.3
▲ 20.5
▲ 31.6
▲ 34.7
▲ 25.8
▲ 30.6
受取手数料
金額 / Amount
2
4
15
20
4
13
11
24
Commission Received
増減率 / yoy chg.
▲ 50.5
▲ 69.5
40.1
▲ 19.9
▲ 45.9
36.4
68.7
49.4
533
その他
金額 / Amount
45
143
6
150
113
216
317
Other
増減率 / yoy chg.
▲ 59.6
▲ 33.6
▲ 98.1
▲ 71.9
—
48.0
99.6
74.8
金額 / Amount
386
2,453
356
2,810
466
2,176
1,004
3,180
増減率 / yoy chg.
▲ 17.1
12.7
▲ 64.5
▲ 11.7
60.3
5.1
13.5
7.6
110
209
350
560
71
141
175
317
268.7
営業外収益
Non-operating Income
支払利息
金額 / Amount
Interest Expenses
増減率 / yoy chg.
53.5
48.3
99.2
76.5
757.8
852.0
147.1
情報機器賃貸費用
金額 / Amount
238
477
522
1,000
206
424
425
850
Lease Expenses of
System Equipment
増減率 / yoy chg.
15.6
12.4
22.7
17.6
▲ 36.6
▲ 40.4
▲ 36.0
▲ 38.3
その他
金額 / Amount
123
260
269
530
218
294
322
617
Other
増減率 / yoy chg.
▲ 43.7
▲ 11.6
▲ 16.4
▲ 14.1
19.7
19.7
▲ 36.3
▲ 17.9
営業外費用
金額 / Amount
472
947
1,142
2,090
497
861
923
1,784
Non-operating Expenses
増減率 / yoy chg.
▲ 5.0
10.0
23.7
17.1
▲ 3.8
▲ 11.6
▲ 25.6
▲ 19.5
金額 / Amount
12,277
経常利益
Ordinary Income
2,691
6,491
5,198
11,690
2,046
5,601
6,675
売上比 / % of Sales
6.1
7.6
5.1
6.2
5.1
6.9
7.0
6.9
増減率 / yoy chg.
31.5
15.9
▲ 22.1
▲ 4.8
38.5
35.6
12.7
22.1
925
特別利益
金額 / Amount
741
741
▲ 741
—
—
234
691
Extraordinary Gains
増減率 / yoy chg.
—
215.7
—
—
—
—
—
—
特別損失
金額 / Amount
730
730
1,769
2,500
—
—
2,110
2,110
Extraordinary Losses
増減率 / yoy chg.
—
—
▲ 16.2
18.5
—
—
—
—
金額 / Amount
11,093
税前利益
Income before Income Taxes
and Minority Interests
2,701
6,502
2,687
9,190
2,046
5,836
5,256
売上比 / % of Sales
6.2
7.6
2.6
4.9
5.1
7.2
5.5
6.3
増減率 / yoy chg.
32.0
11.4
▲ 48.9
▲ 17.2
45.9
43.9
▲ 7.6
13.8
法人税、住民税
及び事業税
金額 / Amount
648
1,309
▲ 2,319
▲ 1,010
691
1,426
2,794
4,221
Corporate, Local and
Income Taxes
増減率 / yoy chg.
▲ 6.2
▲ 8.3
—
—
—
—
32.1
99.3
法人税等調整額
金額 / Amount
▲ 4,248
▲ 4,171
4,171
—
125
27
▲ 436
▲ 409
Adjustments to Income Taxes
増減率 / yoy chg.
—
—
—
—
▲ 80.7
▲ 97.6
—
—
金額 / Amount
6,301
9,364
835
10,200
1,229
4,382
2,899
7,281
中間純利益
Net Income
売上比 / % of Sales
14.4
10.9
0.8
5.4
3.1
5.4
3.0
4.1
増減率 / yoy chg.
412.6
113.7
▲ 71.2
40.1
63.0
49.7
▲ 19.9
11.2
8