2026年12月期第3四半期決算短信〔日本基準〕(連結)
Bull 0
Bear 1
Results
9755
|
OYO Corporation is a Japanese engineering and geotechnical services company operating through three main business segments: Disaster Prevention & Infrastructure, Environment & Energy, and International. The Disaster Prevention & Infrastructure segment provides solutions for strengthening society and enterprises against natural disasters such as earthquakes, tsunamis, and landslides, along with maintenance and management services for social infrastructure. This includes non-destructive testing, damage prediction, disaster planning, and monitoring systems. The Environment & Energy segment focuses on environmental conservation, soil and groundwater pollution countermeasures, asbestos management, and the development of renewable energy sources like offshore wind and geothermal power. The International segment delivers infrastructure maintenance, disaster prevention, and resource exploration services globally. Key subsidiaries include Kinematics, Inc., Geophysical Survey Systems, Inc., Geometrics, Inc., and Robertson Geologging Ltd. The company serves customers in the public infrastructure, construction, and energy sectors across Japan and international markets. Summarised from the annual report, fiscal year ended Dec 2025 |
Industry Engineering & Construction | Homepage oyo.co.jp |
| Sector Industrials | IR page oyo.co.jp | |
|
Tags
geotechnical engineering, disaster prevention, infrastructure maintenance, non-destructive testing, environmental consulting, renewable energy, offshore wind, geothermal energy, seismic monitoring, soil pollution remediation, OYO Corporation U.S.A., Kinematics Inc., Geophysical Survey Systems Inc., OYO Corporation Pacific, Fong Consult Pte. Ltd., FC Inspection Pte. Ltd., Geosmart International Pte. Ltd., Geometrics Inc., Robertson Geologging Ltd., Iris Instruments SAS, Oyo Resource Management Co. Ltd., Oyo Measurement Services Co. Ltd., Tohoku Boring Co. Ltd., Koei Consultant Co. Ltd., KCS Co. Ltd., Nanko Geology Co. Ltd., Oyo Seismic Measurement Co. Ltd., ERS Co. Ltd., NS Environment Co. Ltd., Ocean Engineering Co. Ltd., Japan Methane Co. Ltd., Sanyo Technomarine Co. Ltd.
|
Press page oyo.co.jp/news/news-article |
Metrics
| Valuation | |
|---|---|
| Market cap | ¥ 68.126B |
| Market cap (USD) | $ 427.67M |
| P/E | 18.86 |
| PEG | 0.58 |
| P/BV | 0.88 |
| P/S | 0.90 |
| P/OCF | 8.65 |
| P/FCF | 11.46 |
| Dividend yield | 3.9% |
| Turnover / mcap | — |
| Returns | |
|---|---|
| ROE | 5.5% |
| ROI | 5.3% |
| ROIC | 3.2% |
| Profit margin | 5.7% |
| Growth | |
|---|---|
| Revenue growing | Yes |
| Profits growing | Yes |
| Revenue up 3y | Yes |
| Revenue up 5y | Yes |
| Earnings growth 3y (net profit CAGR) | 32.4% |
| Quality | |
|---|---|
| Profitable | Yes |
| Margin expanding | No |
| Buying back stock | Yes |
| Diluting (TTM) | No |
| Debt/Equity | — |
| Podcast bulls (TTM) | Sign up |
| Podcast bears (TTM) | Sign up |
| Podcast sentiment (TTM) | Sign up |
| Podcast sentiment % (TTM) | Sign up |
| News sentiment (TTM) | 4 |
| Quality score | 27.8% |
| Insiders | |
|---|---|
| Buys, 1w | Sign up |
| Buys, 1m | Sign up |
| Buys, 1y | Sign up |
| Sells, 1w | Sign up |
| Sells, 1m | Sign up |
| Sells, 1y | Sign up |
Sign up to see this company's insider trades
| Figure | FY 2025 | FY 2024 | FY 2023 | FY 2022 | FY 2021 | FY 2020 | FY 2019 | FY 2018 | FY 2017 | FY 2016 | FY 2015 | FY 2014 | FY 2013 | FY 2012 |
|---|---|---|---|---|---|---|---|---|---|---|---|---|---|---|
| Revenue | 76.285B | 74.085B | 65.602B | 59.011B | 51.675B | 49.608B | 53.883B | 45.232B | 45.957B | 51.323B | 49.23B | 48.634B | 47.033B | 40.704B |
| Net profit | 4.331B | 4.01B | 4.006B | 1.864B | 2.866B | 1.781B | 2.176B | 804M | 747M | 1.381B | 2.361B | 3.55B | 2.595B | 5.756B |
| Free cash flow | 5.944B | -253M | -820M | -5.767B | 1.206B | 4.032B | 1.364B | 1.095B | 2.856B | -2.103B | 323M | — | — | — |
| Figure | FY 2025 | FY 2024 | FY 2023 | FY 2022 | FY 2021 | FY 2020 | FY 2019 | FY 2018 | FY 2017 | FY 2016 | FY 2015 | FY 2014 | FY 2013 | FY 2012 |
|---|---|---|---|---|---|---|---|---|---|---|---|---|---|---|
| Share price | 2.806K | 2.57K | 2.055K | 2.283K | 2.147K | 1.225K | 1.527K | 1.112K | 1.444K | 1.403K | 1.368K | 1.847K | 1.61K | 1.044K |
| Price performance 12m | 0.09 | 0.25 | -0.1 | 0.06 | 0.75 | -0.2 | 0.37 | -0.23 | 0.03 | 0.02 | -0.26 | 0.15 | 0.54 | — |
Filed figures
Lines the statements and their notes report beside the headline figures, read from the filings' XBRL as filed (no restatement applied), with figures computed from one filing's own lines. Cash-flow lines carry their cash direction: an outflow is negative. Each period links to its filing; a figure's period, report date and tag are in its tooltip.
| Figure | Dec 2016 | Dec 2017 | Dec 2018 | Dec 2019 | Dec 2020 | Dec 2021 | Dec 2022 | Dec 2023 | Dec 2024 | Dec 2025 |
|---|---|---|---|---|---|---|---|---|---|---|
| Balance sheet detail | ||||||||||
| Trade receivables (JPY) | 1.68B | 1.82B | 1.79B | 1.78B | 1.52B | 1.53B | 5.78B | 5.15B | 4.88B | 6.8B |
| ↳ YoY growth | -10.5% | +8.1% | -1.6% | -0.6% | -14.8% | +1.1% | +277.0% | -10.9% | -5.4% | +39.5% |
| ↳ 5y CAGR | -4.2% | -1.8% | +26.0% | +23.5% | +22.3% | +35.0% | ||||
| Borrowings, current (JPY) | — | — | — | 104M | 93M | 171M | 198M | 1.37B | 1.67B | 2.19B |
| Borrowings, non-current (JPY) | — | — | — | — | — | — | 50M | 2.88B | 2.45B | 1.55B |
| Lease liabilities (JPY) | 2.98B | 2.77B | 2.66B | 3.24B | 4.06B | 4.03B | 4.37B | 4.85B | 5.81B | 5.29B |
| Cash and deposits (JPY) | 23.8B | 26.2B | 25.5B | 26.4B | 30B | 29.9B | 22.3B | 24.4B | 18.8B | 23.4B |
| Intangible assets (JPY) | 1.55B | 1.58B | 1.36B | 1.35B | 1.03B | 1B | 1.1B | 2.23B | 2.55B | 1.84B |
| Net debt (borrowings + leases - cash) (JPY) | — | — | — | -23B | -25.8B | -25.7B | -17.7B | -15.3B | -8.83B | -14.3B |
| Cash flow detail | ||||||||||
| Operating cash flow (JPY) | -1.32B | 3.93B | 2.15B | 2.52B | 4.93B | 2.31B | -4.14B | 870M | 1.31B | 7.88B |
| Purchases of property, plant and equipment (JPY) | -782M | -1.07B | -1.06B | -1.15B | -893M | -1.1B | -1.63B | -1.69B | -1.56B | -1.93B |
| Change in receivables (cash effect) (JPY) | -6.51B | 3.61B | -112M | -2.93B | 1.64B | -516M | -7.42B | -4.15B | -3.99B | 974M |
| Change in inventories (cash effect) (JPY) | -17M | -350M | 56M | -100M | -426M | -636M | -899M | -1.04B | -413M | -83M |
| Change in payables (cash effect) (JPY) | 806M | -1.23B | -47M | 133M | -216M | -87M | 1.13B | 684M | -507M | 374M |
| Dividends paid (cash effect) (JPY) | -763M | -1.04B | -752M | -740M | -846M | -838M | -1.38B | -1.2B | -1.5B | -2.36B |
| Share buybacks (cash effect) (JPY) | 0.00 | 0.00 | -1.41B | 0.00 | 0.00 | -1.6B | -2.21B | -341M | -2B | -1.5B |
| Interest paid (cash effect) (JPY) | -8M | -5M | -4M | -7M | -11M | -9M | -17M | -41M | -78M | -96M |
| Income taxes paid (cash effect) (JPY) | -680M | -1.06B | -272M | -686M | -1.3B | -1.2B | -1.29B | -1.25B | -1.53B | -1.31B |
| Operating cash flow before change in receivables (JPY) | 5.18B | 315M | 2.26B | 5.44B | 3.28B | 2.82B | 3.28B | 5.02B | 5.3B | 6.9B |
| Free cash flow (OCF - PPE - intangibles) (JPY) | -2.1B | 2.86B | 1.1B | 1.36B | 4.03B | 1.21B | -5.77B | -820M | -253M | 5.94B |
| Income detail | ||||||||||
| Research and development expense (JPY) | 2.02B | 1.65B | 1.68B | 1.61B | 1.43B | 1.45B | 2.14B | 2.25B | 2.53B | 2.4B |
| ↳ 5y CAGR | -5.7% | -6.4% | +5.2% | +6.1% | +9.4% | +11.0% | ||||
| Total comprehensive income (JPY) | 749M | 1.02B | -581M | 2.64B | 519M | 4.17B | 4.16B | 6.08B | 6.85B | 3.93B |
| Comprehensive income to owners (JPY) | 807M | 1.06B | -551M | 2.63B | 612M | 4.14B | 4.13B | 6B | 6.7B | 3.97B |
| Provision for credit losses (JPY) | 38M | 85M | 13M | 12M | 132M | 5M | 2M | 48M | 29M | 154M |
| Credit cost ratio (credit losses / average receivables) (%) | 2.1% | 4.9% | 0.7% | 0.7% | 8.0% | 0.3% | 0.1% | 0.9% | 0.6% | 2.6% |
| Segments | ||||||||||
| Dsisaster Prevention And Infrastructure · Segment revenue (JPY) | — | — | — | — | — | — | — | 25.3B | 27.2B | 30.3B |
| ↳ YoY growth | +7.5% | +11.5% | ||||||||
| Dsisaster Prevention And Infrastructure · Segment operating income (JPY) | — | — | — | — | — | — | — | 522M | 1.07B | 1.51B |
| Environment · Segment revenue (JPY) | — | 9.61B | 8.52B | 9B | 9.39B | 10B | 9.97B | 10.5B | — | — |
| ↳ YoY growth | -11.3% | +5.6% | +4.3% | +6.5% | -0.3% | +5.3% | ||||
| Environment · Segment operating income (JPY) | — | 663M | 528M | 649M | 962M | 981M | 1.06B | 1.08B | — | — |
| Environment And Energy · Segment revenue (JPY) | — | — | — | — | — | — | — | 24B | 28.7B | 29.8B |
| ↳ YoY growth | +19.4% | +4.0% | ||||||||
| Environment And Energy · Segment operating income (JPY) | — | — | — | — | — | — | — | 2.34B | 2.91B | 3.07B |
| Infrastructure Maintenance Management And Renovation · Segment revenue (JPY) | — | 19.7B | 19.3B | 23.5B | 19.3B | 19B | 20.7B | 24.8B | — | — |
| ↳ YoY growth | -2.3% | +22.1% | -17.8% | -1.8% | +9.1% | +19.8% | ||||
| Infrastructure Maintenance Management And Renovation · Segment operating income (JPY) | — | 896M | 1.1B | 1.25B | 1.01B | 1.03B | 404M | 391M | — | — |
| International · Segment revenue (JPY) | — | — | — | — | — | — | — | 17B | 18.9B | 16.7B |
| ↳ YoY growth | +11.2% | -11.7% | ||||||||
| International · Segment operating income (JPY) | — | — | — | — | — | — | — | 26M | 402M | -513M |
| Natural Disaster Prevention And Mitigation · Segment revenue (JPY) | — | 8B | 9.3B | 11.8B | 13.3B | 12.4B | 13.6B | 14.2B | — | — |
| ↳ YoY growth | +16.2% | +26.7% | +12.6% | -6.4% | +9.8% | +4.2% | ||||
| Natural Disaster Prevention And Mitigation · Segment operating income (JPY) | — | 126M | 391M | 806M | 860M | 540M | 474M | 460M | — | — |
| Natural Resources And Energy · Segment revenue (JPY) | — | 8.72B | 8.29B | 10.3B | 8.33B | 11B | 15.7B | 17B | — | — |
| ↳ YoY growth | -5.0% | +24.0% | -19.0% | +32.4% | +42.3% | +8.4% | ||||
| Natural Resources And Energy · Segment operating income (JPY) | — | -799M | -543M | -121M | -335M | 1.12B | 567M | 895M | — | — |
| Reported | Mar 28, 2017 | Mar 27, 2019 | Mar 27, 2020 | Mar 27, 2020 | Mar 26, 2021 | Mar 25, 2022 | Mar 24, 2023 | Mar 26, 2025 | Mar 26, 2025 | Mar 25, 2026 |
Sign up to see institutional holdings
Sign UpPodcast Mentions
Sign up to see podcast mentions and sentiment
Sign UpTimely disclosures published on TDnet, newest first, titles as filed in Japanese. The link opens the disclosure on TDnet. Filings with EDINET (periodic reports, extraordinary reports, offerings, holding and buy-back reports), newest first, titles as filed in Japanese. The link opens the filing on EDINET. Press releases from the company's own website, newest first.
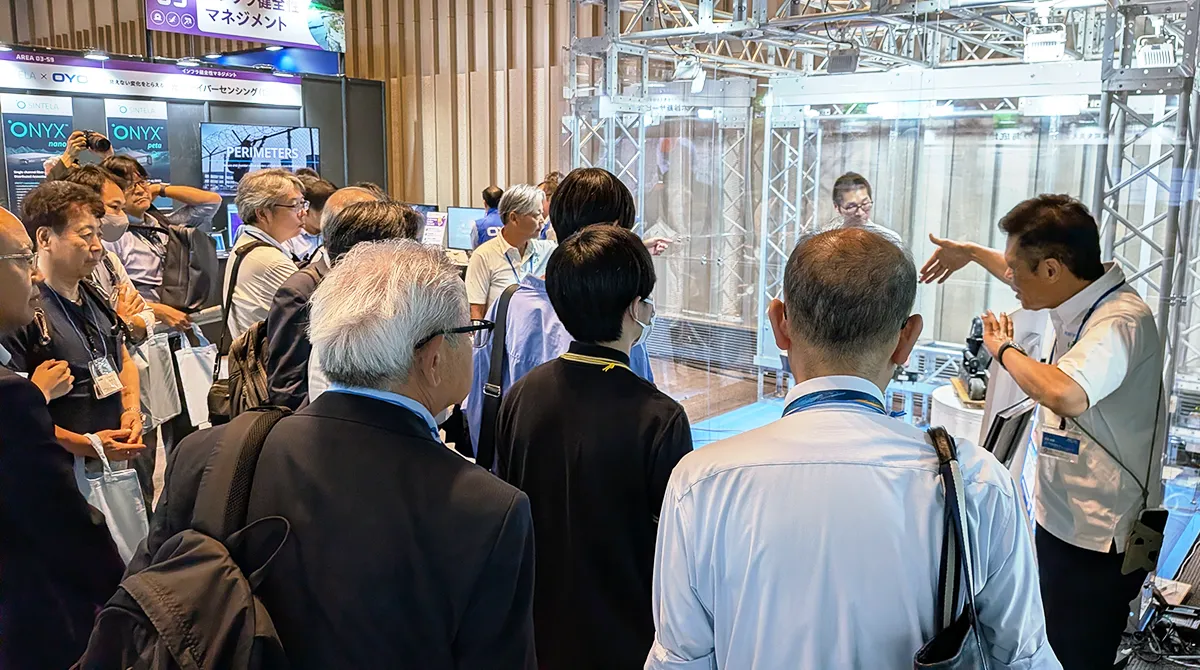
OYOフェア2026オンラインセミナー受講証明書の発行を開始しました
Bull 0
Bear 0
Routine
2026.11.06
会社情報
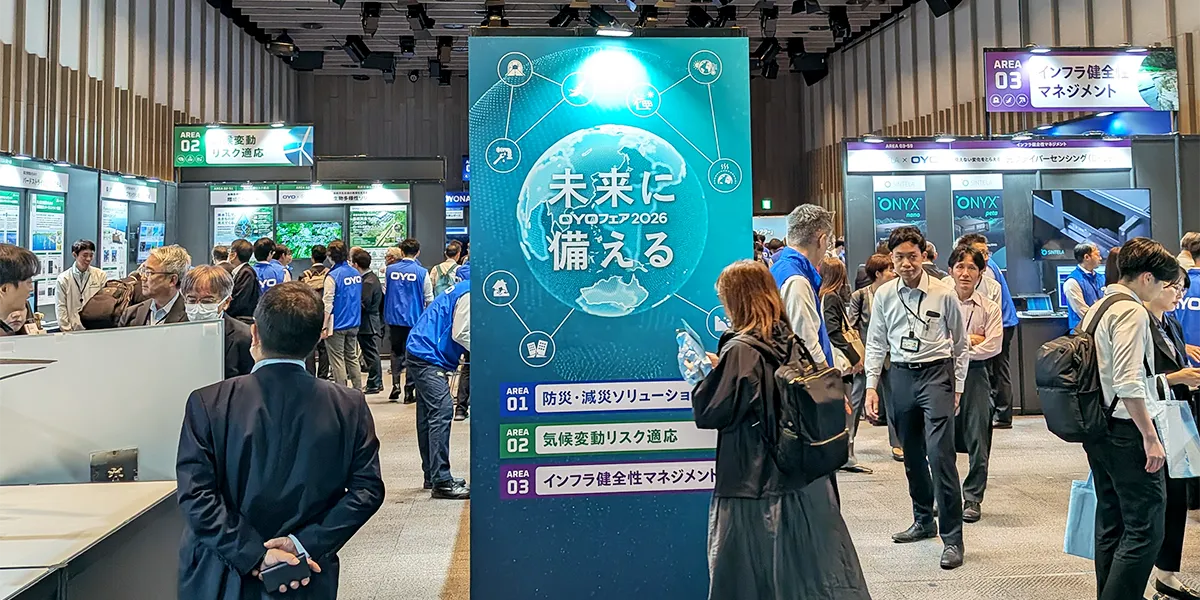
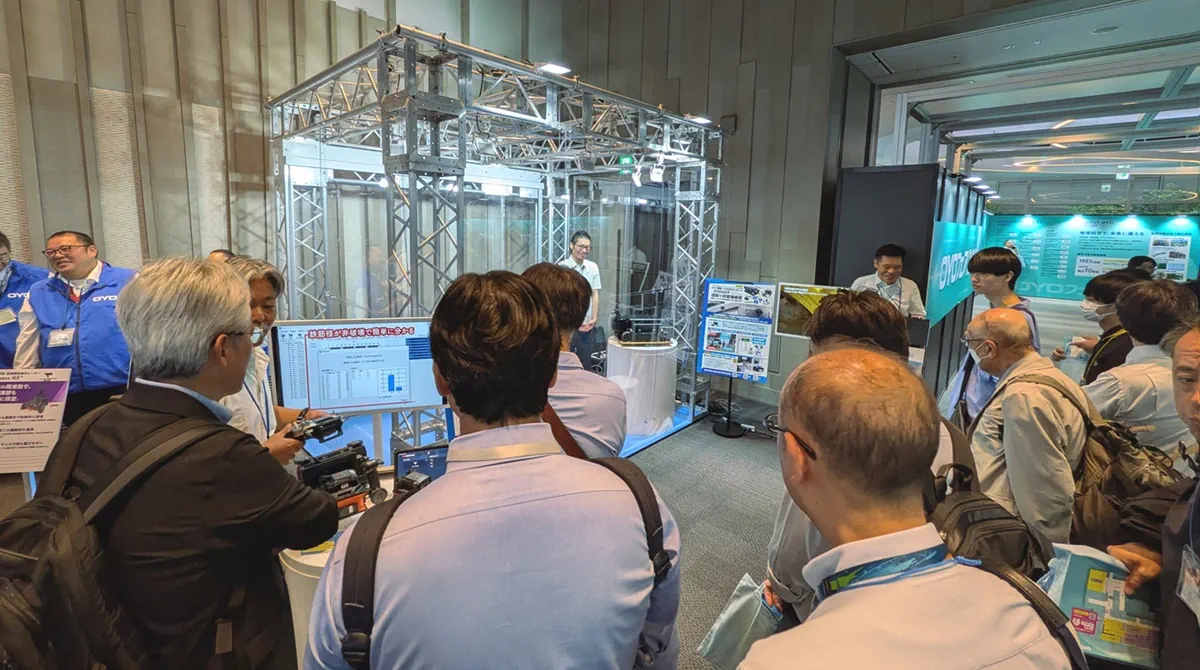
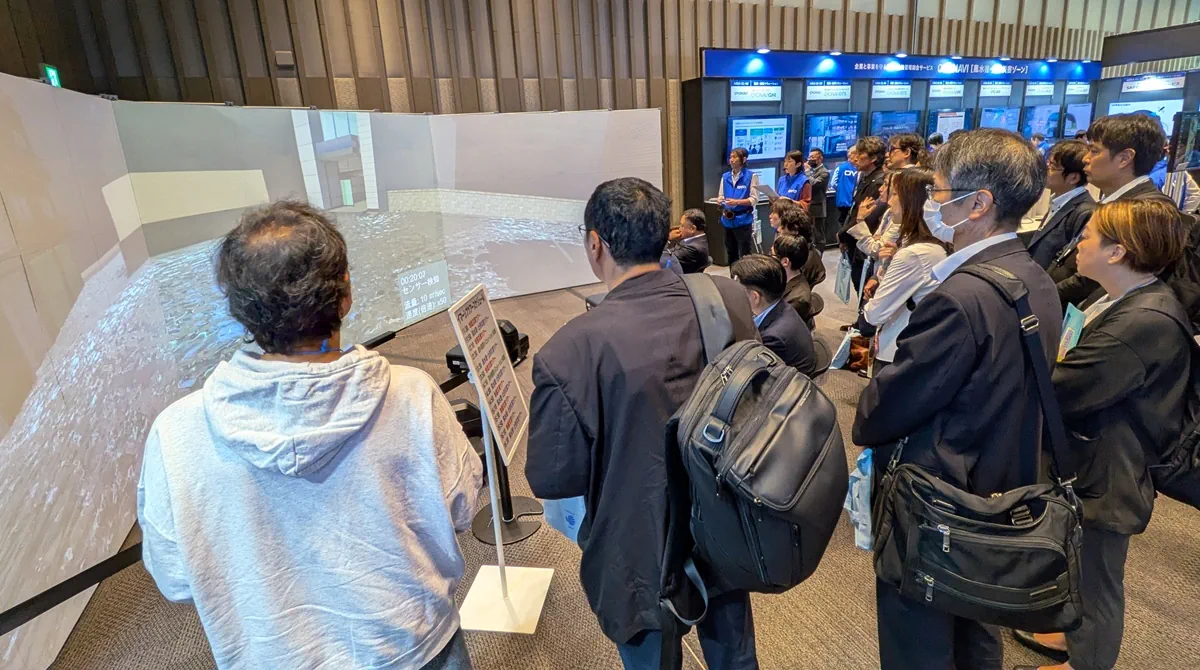
OYOフェア2026のオンラインセミナーを受講し、受講証明書を申請された方を対象に、本日より受講証明書の発行を開始しました。
対象の方は、以下のサイトから受講証明書をダウンロードいただけます。オンラインセミナー視聴時に登録したメールアドレスをご入力ください。
受講証明書ダウンロードページ
ダウンロード期限
12月3日(木)まで
期限を過ぎるとダウンロードできなくなりますので、ご希望の方はお早めにお手続きください。なお、ダウンロード方法などについては、サイト内の「よくあるご質問」をご確認ください。
会場参加者への受講証明書の配布、およびオンラインセミナー受講者からの受講証明書の申請受付は終了しています。
Web Magazine
防災・減災に関わる問題について、地質や防災の専門家ならではの視点で情報を発信するWebメディアです。
応用地質ソーシャルメディア
公式アカウント
 Facebook
 YouTube
 Instagram
 LinkedIn


© 1997-2026 OYO Corporation
当サイト内のクッキー (Cookies) は、皆さまにより便利に応用地質のWebサイトをご利用いただけるよう、利用者の動向を把握するために使われています。
詳しくは当サイトについて
をご確認ください。
OK
i-SENSORクラウドの一時停止に伴う今後の運用について (第三報)
Bull 0
Bear 0
Routine
2026.11.06
会社情報
「第一報」および「第二報」でお知らせしましたとおり、当社では、安全性を最優先に考え、i-SENSORクラウドの閲覧サービスを停止しております。
現時点で確認できる範囲では、今回公表されたPHPの脆弱性を利用した不正アクセスや、情報漏えいなどの被害は確認されておりません。
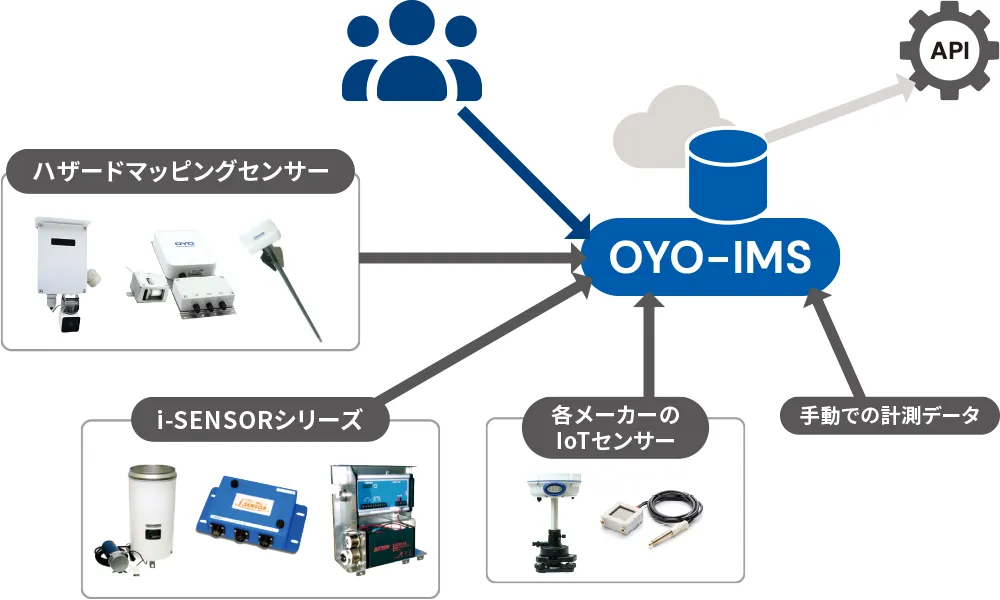
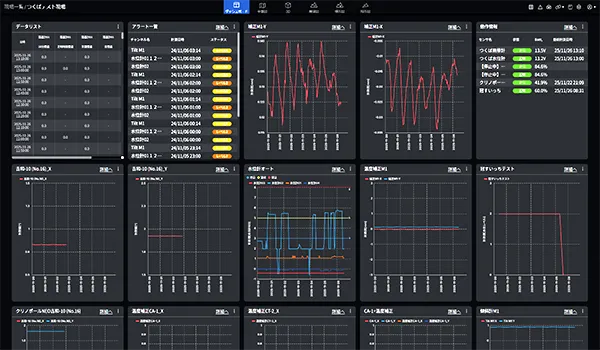
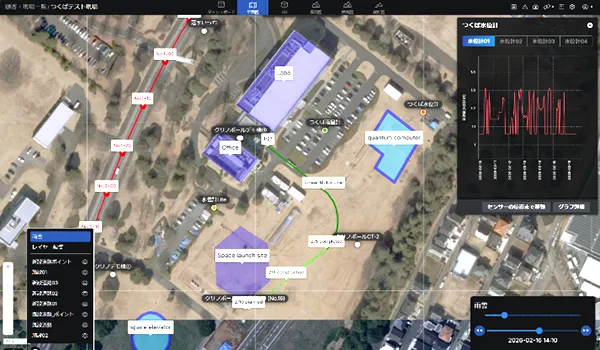
一方、安全性を十分に確認できない状態でのi-SENSORクラウドの閲覧サービスの再開は適切でないと判断し、観測データの閲覧を「OYO-IMS」へ順次切り替えます。
なお、「OYO-IMS」は、今回対象となったPHPを使用しておらず、必要なセキュリティ対策を実施した環境で運用しております。
観測データの送信・収集と警報メールの配信は、これまでどおり継続します。OYO-IMSの利用に必要なID・パスワードは、準備が整い次第、対象のお客様へ個別にご案内します。
今回の措置は、安全性を確保しながらサービスを継続するための予防的な対応です。ご不便をおかけしますが、何卒ご理解とご協力を賜りますようお願い申し上げます。
お問い合わせ窓口
応用地質株式会社 計測システム事業部
E-mail:[email protected]
お問い合せ件名:i-SENSORクラウドに関するお問い合わせ
Web Magazine
防災・減災に関わる問題について、地質や防災の専門家ならではの視点で情報を発信するWebメディアです。
応用地質ソーシャルメディア
公式アカウント
Facebook
YouTube
Instagram
LinkedIn
© 1997-2026 OYO Corporation
当サイト内のクッキー (Cookies) は、皆さまにより便利に応用地質のWebサイトをご利用いただけるよう、利用者の動向を把握するために使われています。
詳しくは当サイトについて
をご確認ください。
OK



Prompts
Click prompts to add them under the company line, click again to take one out, then copy the result into your AI chat. Shared by Asian Century Stocks and Uncovered Thai Stocks. Thank you.
OYO Corporation (ticker 9755), listed in Japan.
Copied
ETFs Holding OYO Corporation
Exchange-traded funds whose newest published daily portfolio holds one of the company's listings, largest weight first.
| ETF | Weight in ETF | Shares | Market value | As of |
|---|---|---|---|---|
| AVDS | 0.01% | 2,700 | $ 45.722K | Nov 16, 2026 |
| DXIV | 0.01% | 1,400 | $ 23.508K | Nov 12, 2026 |
| DFIS | 0.01% | 33,200 | $ 557.486K | Nov 12, 2026 |
| DISV | 0.01% | 23,000 | $ 386.21K | Nov 12, 2026 |
| DFIC | 0.00% | 23,500 | $ 394.606K | Nov 12, 2026 |
| DFSI | 0.00% | 1,300 | $ 21.829K | Nov 12, 2026 |
| DFAX | 0.00% | 9,900 | $ 166.238K | Nov 12, 2026 |
| DFAI | 0.00% | 10,500 | $ 176.313K | Nov 12, 2026 |
| AVDE | 0.00% | 11,800 | $ 199.823K | Nov 16, 2026 |
| AVSD | 0.00% | 100 | $ 1,693.41 | Nov 16, 2026 |