|
transcosmos inc. is an independent information services provider founded in 1966 that offers one-stop outsourcing solutions combining human expertise and technology. The company operates through a group structure that includes subsidiaries such as J-Stream, which handles service operations, and Ooyu Information Creation (China) Co., Ltd., which focuses on software development. It also maintains international operations through transcosmos Korea Inc. and Shanghai T-S-L Da Uchuu Business Consulting Co., Ltd., providing service outsourcing and business consulting in Asia. The firm serves clients by integrating specialized professionals with global technology to address corporate challenges, aiming to evolve its business model and expand its service portfolio. Its strategy emphasizes platform development and global expansion to enhance profitability and growth. Summarised from the annual report, fiscal year ended Mar 2026 |
Industry Information Technology Services | Homepage trans-cosmos.co.jp |
| Sector Technology | IR page trans-cosmos.co.jp | |
|
Tags
it outsourcing, software development, business process outsourcing, information services, global it services, J-Stream, Ooyu Information Creation (China) Co. Ltd., transcosmos Korea Inc., Shanghai T-S-L Da Uchuu Business Consulting Co. Ltd., EMNET INC., UNQ HOLDINGS LIMITED
|
Press page — |
Metrics
| Valuation | |
|---|---|
| Market cap | ¥ 154.617B |
| Market cap (USD) | $ 966.37M |
| P/E | 11.51 |
| PEG | — |
| P/BV | 1.10 |
| P/S | 0.38 |
| P/OCF | 13.62 |
| P/FCF | 25.55 |
| Dividend yield | 4.0% |
| Turnover / mcap | — |
| Returns | |
|---|---|
| ROE | 9.8% |
| ROI | 9.2% |
| ROIC | 8.8% |
| Profit margin | 3.3% |
| Growth | |
|---|---|
| Revenue growing | Yes |
| Profits growing | Yes |
| Revenue up 3y | No |
| Revenue up 5y | No |
| Earnings growth 3y (net profit CAGR) | -6.0% |
| Quality | |
|---|---|
| Profitable | Yes |
| Margin expanding | Yes |
| Buying back stock | Yes |
| Diluting (TTM) | No |
| Debt/Equity | — |
| Podcast bulls (TTM) | Sign up |
| Podcast bears (TTM) | Sign up |
| Podcast sentiment (TTM) | Sign up |
| Podcast sentiment % (TTM) | Sign up |
| News sentiment (TTM) | 13 |
| Quality score | 27.8% |
| Insiders | |
|---|---|
| Buys, 1w | Sign up |
| Buys, 1m | Sign up |
| Buys, 1y | Sign up |
| Sells, 1w | Sign up |
| Sells, 1m | Sign up |
| Sells, 1y | Sign up |
Sign up to see this company's insider trades
| Figure | FY 2026 | FY 2025 | FY 2024 | FY 2023 | FY 2022 | FY 2021 | FY 2020 | FY 2019 | FY 2018 | FY 2017 | FY 2016 | FY 2015 | FY 2014 | FY 2013 |
|---|---|---|---|---|---|---|---|---|---|---|---|---|---|---|
| Revenue | 393.866B | 375.849B | 362.201B | 373.83B | 354.085B | 336.405B | 311.871B | 284.696B | 266.645B | 242.314B | 224.605B | 199.178B | 186.503B | 166.335B |
| Net profit | 13.084B | 11.332B | 10.097B | 15.767B | 21.488B | 10.022B | 6.279B | 4.433B | -2.176B | 7.156B | 7.587B | 7.349B | 6.289B | 4.919B |
| Free cash flow | 16.308B | 13.225B | 13.202B | 18.22B | 11.767B | 9.899B | 3.189B | -41M | 3.477B | 5.252B | -211M | — | — | — |
| Figure | FY 2026 | FY 2025 | FY 2024 | FY 2023 | FY 2022 | FY 2021 | FY 2020 | FY 2019 | FY 2018 | FY 2017 | FY 2016 | FY 2015 | FY 2014 | FY 2013 |
|---|---|---|---|---|---|---|---|---|---|---|---|---|---|---|
| Share price | 3.887K | 3.183K | 3.141K | 3.146K | 3.201K | 2.993K | 1.909K | 2.159K | 2.615K | 2.615K | 2.933K | 2.534K | 2.128K | 1.34K |
| Price performance 12m | 0.22 | 0.01 | -0 | -0.02 | 0.07 | 0.57 | -0.12 | -0.17 | 0 | -0.11 | 0.16 | 0.19 | 0.59 | — |
Filed figures
Lines the statements and their notes report beside the headline figures, read from the filings' XBRL as filed (no restatement applied), with figures computed from one filing's own lines. Cash-flow lines carry their cash direction: an outflow is negative. Each period links to its filing; a figure's period, report date and tag are in its tooltip.
| Figure | Mar 2017 | Mar 2018 | Mar 2019 | Mar 2020 | Mar 2021 | Mar 2022 | Mar 2023 | Mar 2024 | Mar 2025 | Mar 2026 |
|---|---|---|---|---|---|---|---|---|---|---|
| Balance sheet detail | ||||||||||
| Trade receivables (JPY) | 40B | 42.2B | 44.7B | 49.8B | 56.4B | 146B | 140B | 134B | 137B | 148B |
| ↳ YoY growth | +11.3% | +5.7% | +5.9% | +11.3% | +13.3% | +158.3% | -4.0% | -4.5% | +2.2% | +8.5% |
| ↳ 5y CAGR | +9.5% | +29.5% | +27.1% | +24.5% | +22.3% | +21.3% | ||||
| Borrowings, current (JPY) | 2.18B | 3.03B | 3.53B | 3.17B | 2.68B | 13.7B | 3.77B | 2.26B | 2.22B | 2.18B |
| Borrowings, non-current (JPY) | 13.5B | 11.9B | 10.1B | 256M | 16.4B | 14.5B | 12.5B | 16.4B | 14.3B | 2.25B |
| Bonds payable (JPY) | 10.1B | 10.1B | 10B | 142M | 214M | 10.3B | 10.3B | 10.2B | 10.2B | 228M |
| Cash and deposits (JPY) | 33.9B | 31.9B | 36B | 35B | 49.9B | 64.8B | 51.2B | 64.8B | 73.5B | 80.5B |
| Intangible assets (JPY) | 6.29B | 6.24B | 3.53B | 4.31B | 4.67B | 4.65B | 4.52B | 5.47B | 5.33B | 5.94B |
| Net debt (borrowings + leases - cash) (JPY) | -18.2B | -17.1B | -22.4B | -31.6B | -30.8B | -36.6B | -34.9B | -46.2B | -57B | -76B |
| Cash flow detail | ||||||||||
| Operating cash flow (JPY) | 8.49B | 7.81B | 3.89B | 8.09B | 15.7B | 15.8B | 24.3B | 18.3B | 17.3B | 20.8B |
| Purchases of property, plant and equipment (JPY) | -2.18B | -3.16B | -2.63B | -3.09B | -4.66B | -4B | -4.82B | -3.24B | -2.73B | -3.29B |
| Purchases of intangible assets (JPY) | -1.05B | -1.18B | -1.3B | -1.82B | -1.16B | -1.22B | -1.21B | -1.81B | -1.36B | -1.16B |
| Change in receivables (cash effect) (JPY) | -3.83B | -1.92B | -3.06B | -4.29B | -6.47B | -15.3B | 3.7B | 4.02B | -584M | -5.32B |
| Change in inventories (cash effect) (JPY) | -1.04B | -805M | -577M | -1.58B | -1.64B | 1.51B | 813M | 1.14B | 765M | 676M |
| Change in payables (cash effect) (JPY) | 2.29B | -1.17B | 251M | 1.07B | 305M | 3.07B | -217M | -2.37B | 235M | 2.96B |
| Dividends paid (cash effect) (JPY) | -2.3B | -2.16B | -957M | -1.37B | -1.91B | -3.85B | -5.78B | -5.06B | -3.04B | -3.98B |
| Share buybacks (cash effect) (JPY) | — | — | — | — | — | -2M | -13.3B | 0.00 | — | — |
| Interest paid (cash effect) (JPY) | -28M | -40M | -73M | -88M | -99M | -116M | -150M | -176M | -130M | -120M |
| Income taxes paid (cash effect) (JPY) | -4.03B | -2.79B | -4.94B | -2.95B | -5.01B | -9.43B | -8.69B | -5.56B | -3.19B | -3.2B |
| Operating cash flow before change in receivables (JPY) | 12.3B | 9.73B | 6.95B | 12.4B | 22.2B | 31.1B | 20.6B | 14.2B | 17.9B | 26.1B |
| Free cash flow (OCF - PPE - intangibles) (JPY) | 5.25B | 3.48B | -41M | 3.19B | 9.9B | 10.5B | 18.2B | 13.2B | 13.2B | 16.3B |
| Income detail | ||||||||||
| Research and development expense (JPY) | 160M | 159M | 158M | 150M | 158M | 146M | 158M | 139M | 159M | 136M |
| ↳ 5y CAGR | +11.9% | -1.8% | -0.1% | -2.5% | +1.2% | -3.0% | ||||
| Total comprehensive income (JPY) | 4.37B | -11.1B | 6.07B | 4.39B | 12.8B | 32B | 10.5B | 10.4B | 14.3B | 14.6B |
| Comprehensive income to owners (JPY) | 3.93B | -11.2B | 6B | 4.1B | 11.6B | 30.7B | 9.31B | 9.28B | 13.3B | 13.6B |
| Provision for credit losses (JPY) | 17M | 292M | 29M | 34M | 692M | 6M | 4M | 110M | 487M | 117M |
| Credit cost ratio (credit losses / average receivables) (%) | 0.0% | 0.7% | 0.1% | 0.1% | 1.3% | 0.0% | 0.0% | 0.1% | 0.4% | 0.1% |
| Reported | Jun 20, 2017 | Jun 21, 2018 | Jun 25, 2019 | Jun 25, 2020 | Jun 23, 2021 | Jun 21, 2023 | Jun 21, 2023 | Jun 25, 2024 | Jun 23, 2025 | Jun 19, 2026 |
Sign up to see institutional holdings
Sign UpPodcast Mentions
Sign up to see podcast mentions and sentiment
Sign UpTimely disclosures published on TDnet, newest first, titles as filed in Japanese. The link opens the disclosure on TDnet. Filings with EDINET (periodic reports, extraordinary reports, offerings, holding and buy-back reports), newest first, titles as filed in Japanese. The link opens the filing on EDINET. Press releases from the company's own website, newest first.

共に挑み、実現する。かなえる力を、もっと世界に。
-

-

-
-
-

-

-

-

-

-

-

-

-

-

-

-

-

-

-

-
サービス

-
会社案内PDF


Financial Results
決算短信
最新
2027年 3月期
2026.10.30
2026.07.31
第1四半期決算短信【PDF 258kb】 (2026.08.05 レビュー報告書付き第1四半期決算短信【348kb】)
バックナンバー
2026年 3月期
2026.04.30
2026.01.30
第3四半期決算短信【PDF 253kb】
(2026.02.05 レビュー報告書付き第3四半期決算短信【351kb】)
2025.10.31
2025.07.31
第1四半期決算短信【PDF 252kb】
(2025.08.05 レビュー報告書付き第1四半期決算短信【349kb】)
2025年 3月期
2025.04.30
2025.01.31
第3四半期決算短信【PDF 261kb】
(2025.02.05 レビュー報告書付き第3四半期決算短信【357kb】)
2024.10.31
2024.07.31
第1四半期決算短信【PDF 258kb】
(2024.08.05 レビュー報告書付き第1四半期決算短信【340kb】)
2024年 3月期
2024.04.30
2024.01.31
2023.10.31
2023.07.31
2023年 3月期
2023.04.28
2023.01.31
2022.10.31
2022.07.29
2022年 3月期
2022.04.28
2022.01.31
2021.10.29
2021.07.30
2021年 3月期
2021.05.10
(注)4月30日に開示した決算短信を訂正しております。
2021.01.29
2020.10.30
2020.07.31
2020年 3月期
2020.04.30
2020.01.31
2019.10.31
2019.07.31
2019年 3月期
2019.04.26
2019.01.31
2018.10.31
2018.07.31
2018年 3月期
2018.04.27
2018.01.31
2017.10.31
2017.07.31
2017年 3月期
2017.04.28
2017.01.31
2016.10.31
2016.07.29
2016年 3月期
2016.04.28
2016.01.29
2015.10.30
2015.07.31
2015年 3月期
2015.04.30
2015.01.30
2014.10.31
2014.07.31
2014年 3月期
2014.04.30
2014.01.31
2013.10.31
2013.07.31
2013年 3月期
2013.04.30
2013.02.07
2012.11.05
2012.08.06
2012年 3月期
2012.05.15
2012.02.10
2011.11.08
2011.08.08
2011年 3月期
2011.05.13
2011.02.10
2010.11.10
2010.08.09
2010年 3月期
2010.05.14
2010.02.10
2009.11.11
2009.08.10
2009年 3月期
2009.05.15
2009.02.10
2008.11.11
2008.08.12
2008年 3月期
2008.05.15
2008.02.15
2007.11.16
2007.08.10
2007年 3月期
2007.05.17
2007.02.15
2006.11.26
2006.08.11
2006年 3月期
2006.05.18
2006.02.14
2005.11.17
2005.08.11
2005年 3月期
2005.05.19
決算短信
連結業績の概況【PDF 188kb】
2005.02.14
第3四半期財務・業績の概況
連結業績の概況【PDF 22kb】
2004.11.18
中間決算短信
連結業績の概況【PDF 75kb】
2004.08.13
第1四半期決算
連結業績の概況【PDF 45kb】
2004年 3月期
2004.05.20
2004.02.19
第3四半期決算
連結業績の概況【PDF 24kb】
2003.11.20
中間決算
連結業績の概況【PDF 11kb】
2003.08.21
第1四半期決算
連結業績の概況【PDF 41kb】
2003年 3月期
2003.05.22
2002.11.20
中間決算
連結業績の概況【PDF 7kb】
2002年 3月期
2002.05.23
本決算
連結業績の概況【PDF 7kb】
2001.11.21
中間決算
連結業績の概況【PDF 6kb】
2001年 3月期
2001.05.24
本決算
連結業績の概況【PDF 6kb】
2001.01.12
中間決算
連結業績の概況【PDF 6kb】
2000年 3月期
2000.05.25
1999.11.18
中間決算
連結業績の概況【PDF 73kb】
1999年 3月期
1999.05.19
IR情報
-
経営方針・事業内容
-
財務・業績
-
IRライブラリ
-
株式・格付け情報
-
個人投資家の皆様へ
-
ESG情報
-
経営方針・事業内容
-
財務・業績
-
IRライブラリ
-
株式・格付け情報
-
個人投資家の皆様へ
-
ESG情報
関連情報

サービスに関する
お問い合わせ
 TEL
[ TEL](tel:0120120364)
 チャット
 メール
サービス
業界別事例


© transcosmos inc. All rights reserved.




 0120-120-364
 Webからの
 チャットからの






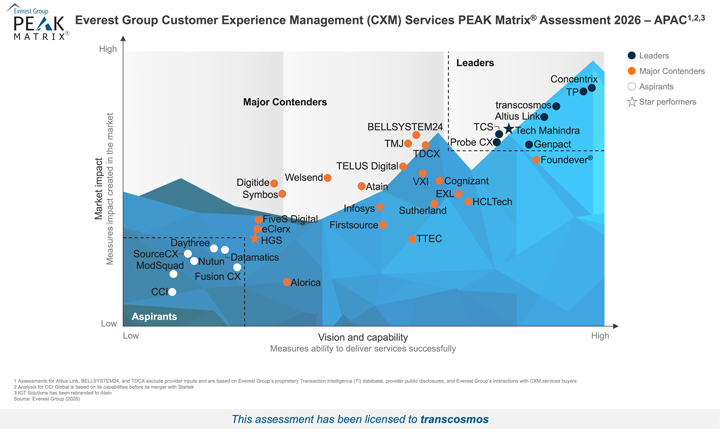




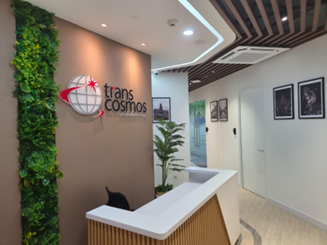
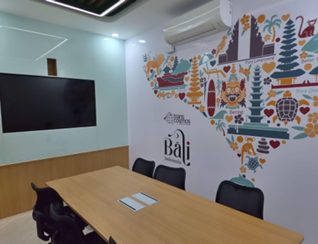




Prompts
Click prompts to add them under the company line, click again to take one out, then copy the result into your AI chat. Shared by Asian Century Stocks and Uncovered Thai Stocks. Thank you.
ETFs Holding transcosmos inc.
Exchange-traded funds whose newest published daily portfolio holds one of the company's listings, largest weight first.
| ETF | Weight in ETF | Shares | Market value | As of |
|---|---|---|---|---|
| AVDS | 0.02% | 2,800 | $ 62.454K | Nov 16, 2026 |
| DFIS | 0.01% | 28,500 | $ 619.371K | Nov 12, 2026 |
| AVDV | 0.01% | 48,500 | $ 1.082M | Nov 16, 2026 |
| DXIV | 0.01% | 1,000 | $ 21.732K | Nov 12, 2026 |
| DFSI | 0.00% | 2,000 | $ 43.465K | Nov 12, 2026 |
| DFIC | 0.00% | 25,100 | $ 545.482K | Nov 12, 2026 |
| DFAX | 0.00% | 19,237 | $ 418.065K | Nov 12, 2026 |
| DFAI | 0.00% | 14,300 | $ 310.772K | Nov 12, 2026 |
| AVDE | 0.00% | 20,400 | $ 455.025K | Nov 16, 2026 |
| AVSD | 0.00% | 600 | $ 13.383K | Nov 16, 2026 |