2026年12月期第3四半期決算説明資料
Bull 6
Bear 0
Results
9702
|
ISB Corporation is a Japanese information services and security systems company. The group operates through two main business segments. The information services segment includes the development and verification of embedded and control software for automotive, medical, industrial, mobile, and home appliance devices, as well as software development for core systems, information systems, and solutions for distribution, finance, and public sectors. This segment also provides field services such as data center housing and hosting, cloud infrastructure design and operation, and system operation services. Additionally, the company develops and sells business package software and medical or communication solutions, along with related hardware. The security systems segment focuses on the development, sales, and maintenance of access control systems, electric locks, and keypads. The group serves customers in the automotive, medical, industrial, and public sectors. Key subsidiaries include SMC, Knox Data, 3S, Art, Art Service, Computer House, T-stock, Takeus, AMBC, and ISB Vietnam Company Limited. Summarised from the annual report, fiscal year ended Dec 2025 |
Industry Information Technology Services | Homepage isb.co.jp |
| Sector Technology | IR page isb.co.jp | |
|
Tags
embedded software, automotive software, medical software, data center services, cloud infrastructure, access control systems, electric locks, system operation services, business software, SMC, Knox Data, 3S, Art, Art Service, Computer House, T-stock, Takeus, AMBC, ISB Vietnam Company Limited
|
Press page isb.co.jp/newsroom |
Metrics
| Valuation | |
|---|---|
| Market cap | ¥ 28.788B |
| Market cap (USD) | $ 180.38M |
| P/E | 14.36 |
| PEG | 55.62 |
| P/BV | 1.87 |
| P/S | 0.76 |
| P/OCF | 16.50 |
| P/FCF | 36.30 |
| Dividend yield | 2.2% |
| Turnover / mcap | — |
| Returns | |
|---|---|
| ROE | 10.2% |
| ROI | 9.8% |
| ROIC | 9.5% |
| Profit margin | 3.9% |
| Growth | |
|---|---|
| Revenue growing | Yes |
| Profits growing | No |
| Revenue up 3y | Yes |
| Revenue up 5y | Yes |
| Earnings growth 3y (net profit CAGR) | 0.26% |
| Quality | |
|---|---|
| Profitable | Yes |
| Margin expanding | No |
| Buying back stock | No |
| Diluting (TTM) | No |
| Debt/Equity | — |
| Podcast bulls (TTM) | Sign up |
| Podcast bears (TTM) | Sign up |
| Podcast sentiment (TTM) | Sign up |
| Podcast sentiment % (TTM) | Sign up |
| News sentiment (TTM) | 35 |
| Quality score | 5.6% |
| Insiders | |
|---|---|
| Buys, 1w | Sign up |
| Buys, 1m | Sign up |
| Buys, 1y | Sign up |
| Sells, 1w | Sign up |
| Sells, 1m | Sign up |
| Sells, 1y | Sign up |
Sign up to see this company's insider trades
| Figure | FY 2025 | FY 2024 | FY 2023 | FY 2022 | FY 2021 | FY 2020 | FY 2019 | FY 2018 | FY 2017 | FY 2016 | FY 2015 | FY 2014 | FY 2013 | FY 2012 |
|---|---|---|---|---|---|---|---|---|---|---|---|---|---|---|
| Revenue | 37.02B | 33.955B | 32.388B | 28.953B | 26.177B | 24.434B | 22.52B | 17.441B | 16.668B | 13.395B | 12.824B | 13.718B | 11.763B | 10.6B |
| Net profit | 1.435B | 2.032B | 1.473B | 1.424B | 1.11B | 994.439M | 633.301M | 546.896M | 307.673M | 175.072M | 180.981M | 474.177M | 239.605M | 330.615M |
| Free cash flow | 793M | 1.444B | 1.822B | 1.805B | 1.309B | 1.738B | 1.272B | 1.034B | 140.104M | 186.965M | 352.49M | — | — | — |
| Figure | FY 2025 | FY 2024 | FY 2023 | FY 2022 | FY 2021 | FY 2020 | FY 2019 | FY 2018 | FY 2017 | FY 2016 | FY 2015 | FY 2014 | FY 2013 | FY 2012 |
|---|---|---|---|---|---|---|---|---|---|---|---|---|---|---|
| Share price | 1.731K | 1.37K | 1.466K | 1.125K | 1.018K | 1.532K | 2.009K | 1.543K | 1.336K | 905.1 | 764.42 | 978.22 | 765.9 | 506.04 |
| Price performance 12m | 0.26 | -0.07 | 0.3 | 0.11 | -0.34 | -0.24 | 0.3 | 0.15 | 0.48 | 0.18 | -0.22 | 0.28 | 0.51 | — |
Filed figures
Lines the statements and their notes report beside the headline figures, read from the filings' XBRL as filed (no restatement applied), with figures computed from one filing's own lines. Cash-flow lines carry their cash direction: an outflow is negative. Each period links to its filing; a figure's period, report date and tag are in its tooltip.
| Figure | Dec 2016 | Dec 2017 | Dec 2018 | Dec 2019 | Dec 2020 | Dec 2021 | Dec 2022 | Dec 2023 | Dec 2024 | Dec 2025 |
|---|---|---|---|---|---|---|---|---|---|---|
| Balance sheet detail | ||||||||||
| Trade receivables (JPY) | 2.83B | 3.38B | 3.63B | 4.22B | 4.45B | 4.96B | 5.42B | 5.81B | 6.08B | 6.39B |
| ↳ YoY growth | +16.0% | +19.4% | +7.4% | +16.3% | +5.5% | +11.4% | +9.2% | +7.3% | +4.6% | +5.1% |
| ↳ 5y CAGR | +12.8% | +11.9% | +9.9% | +9.9% | +7.6% | +7.5% | ||||
| Borrowings, current (JPY) | 370M | 830M | 830M | 1.32B | 140M | 120M | 120M | 120M | 120M | 120M |
| Borrowings, non-current (JPY) | — | — | — | 25.7M | — | — | — | — | — | — |
| Bonds payable (JPY) | — | — | — | 16M | — | — | — | — | — | — |
| Cash and deposits (JPY) | 3.09B | 2.67B | 3.55B | 3.68B | 5.2B | 6.07B | 7.63B | 8.88B | 8.98B | 9.08B |
| Intangible assets (JPY) | 454M | 719M | 496M | 1.71B | 1.23B | 756M | 395M | 36.6M | 725M | 769M |
| Net debt (borrowings + leases - cash) (JPY) | -2.72B | -1.84B | -2.72B | -2.33B | -5.06B | -5.95B | -7.51B | -8.76B | -8.86B | -8.96B |
| Cash flow detail | ||||||||||
| Operating cash flow (JPY) | 346M | 290M | 1.16B | 1.35B | 1.86B | 1.46B | 1.93B | 1.95B | 1.88B | 1.75B |
| Purchases of property, plant and equipment (JPY) | -45.3M | -45.3M | -106M | -75.4M | -74M | -148M | -115M | -113M | -372M | -895M |
| Purchases of intangible assets (JPY) | -113M | -105M | -15.8M | — | -51.5M | -500,000 | -6.26M | -10.8M | -64.8M | -57M |
| Change in receivables (cash effect) (JPY) | -395M | -93.1M | -340M | -112M | -289M | -514M | -308M | -395M | -225M | -296M |
| Change in inventories (cash effect) (JPY) | 35.3M | -164M | 22.7M | 8.48M | 28.1M | 235M | -379M | 33.8M | -229M | -210M |
| Change in payables (cash effect) (JPY) | -5.73M | -38.1M | 203M | 97.2M | 8.7M | 213M | 430M | 48.2M | 157M | 76M |
| Dividends paid (cash effect) (JPY) | -178M | -128M | -127M | -168M | -194M | -356M | -340M | -454M | -480M | -616M |
| Share buybacks (cash effect) (JPY) | — | — | — | — | — | — | — | -53,000 | — | — |
| Interest paid (cash effect) (JPY) | -1.09M | -9.6M | -5.24M | -10.7M | -5.04M | -911,000 | -748,000 | -737,000 | -983,000 | -1M |
| Income taxes paid (cash effect) (JPY) | -92.5M | -210M | -148M | -669M | -647M | -842M | -840M | -1.26B | -939M | -898M |
| Operating cash flow before change in receivables (JPY) | 740M | 384M | 1.5B | 1.46B | 2.15B | 1.97B | 2.23B | 2.34B | 2.11B | 2.04B |
| Free cash flow (OCF - PPE - intangibles) (JPY) | 187M | 140M | 1.03B | 1.27B | 1.74B | 1.31B | 1.8B | 1.82B | 1.44B | 793M |
| Income detail | ||||||||||
| Research and development expense (JPY) | — | 322M | 228M | 198M | 127M | 211M | 165M | 136M | 164M | 125M |
| ↳ 5y CAGR | -12.5% | -9.9% | -3.7% | -0.3% | ||||||
| Total comprehensive income (JPY) | 169M | 377M | 508M | 670M | 1.01B | 1.13B | 1.42B | 1.56B | 2.14B | 1.6B |
| Comprehensive income to owners (JPY) | 169M | 377M | 508M | 670M | 1.01B | 1.13B | 1.42B | 1.56B | 2.14B | 1.6B |
| Provision for credit losses (JPY) | — | 2.7M | — | — | — | — | — | — | — | — |
| Credit cost ratio (credit losses / average receivables) (%) | — | 0.1% | — | — | — | — | — | — | — | — |
| Reported | Mar 30, 2017 | Mar 29, 2018 | Mar 28, 2019 | Mar 27, 2020 | Mar 26, 2021 | Mar 25, 2022 | Mar 30, 2023 | Mar 27, 2024 | Mar 28, 2025 | Mar 26, 2026 |
Sign up to see institutional holdings
Sign UpPodcast Mentions
Sign up to see podcast mentions and sentiment
Sign UpTimely disclosures published on TDnet, newest first, titles as filed in Japanese. The link opens the disclosure on TDnet. Filings with EDINET (periodic reports, extraordinary reports, offerings, holding and buy-back reports), newest first, titles as filed in Japanese. The link opens the filing on EDINET. Press releases from the company's own website, newest first.
2026年12月期 第3四半期決算短信〔日本基準〕(連結)
Bull 5
Bear 0
Results
日本の将来を担うIT人材の育成に向けて 「第37回全国高等専門学校プログラミングコンテスト」に特別協賛
Bull 1
Bear 0
Routine
お知らせ
2026.10.23
アイ・エス・ビー(以下、ISB)は、2019年度より、全国高等専門学校連合会が主催する「全国高等専門学校プログラミングコンテスト」(以下、高専プロコン)の創造性教育プロジェクトに賛同し、継続的に支援しています。
高専プロコンは2026年度で第37回を迎えました。国公私立合わせて全国58校の高専生を対象に、優れたコンピュータソフトウェア作品の発表の場を提供するイベントで、IT産業に優秀な人材を供給し、技術の創造と進化を促進することを目的としています。
2026年の高専プロコンは、10月10日(土)・11日(日)の2日間、香川県の「サンポートホール高松」で開催されました。予選を通過した課題・自由部門各20テーマのほか、競技部門56チームにより本選が実施され、参加した高専生たちはICT技術や創造力を駆使した作品を発表し、学校対抗戦を通じて技術力と創意工夫を競い合いました。
ISBは、今回の「第37回高専プロコン」に特別協賛するとともに、審査員としても大会に参加しました。参加した審査員は、今回の各校の発表を以下のように述べ、大会の成功を報告しました。
「今年も高専プロコンに審査員として参加をしてきました。今回は生成AIを活用した開発管理や学習支援をはじめ、農業、伝統工芸、インフラ点検など、身近な社会・地域課題に挑む意欲的な作品が揃いました。現場でのデータ収集や実験を重ね、最新技術を実用的な仕組みへと磨き上げる姿勢に、高専生ならではの柔軟な発想と情熱を感じました。プレゼンテーションやデモの完成度も高く、技術への深い理解と実運用を見据えた工夫が光る、将来性を強く感じる大会でした。」
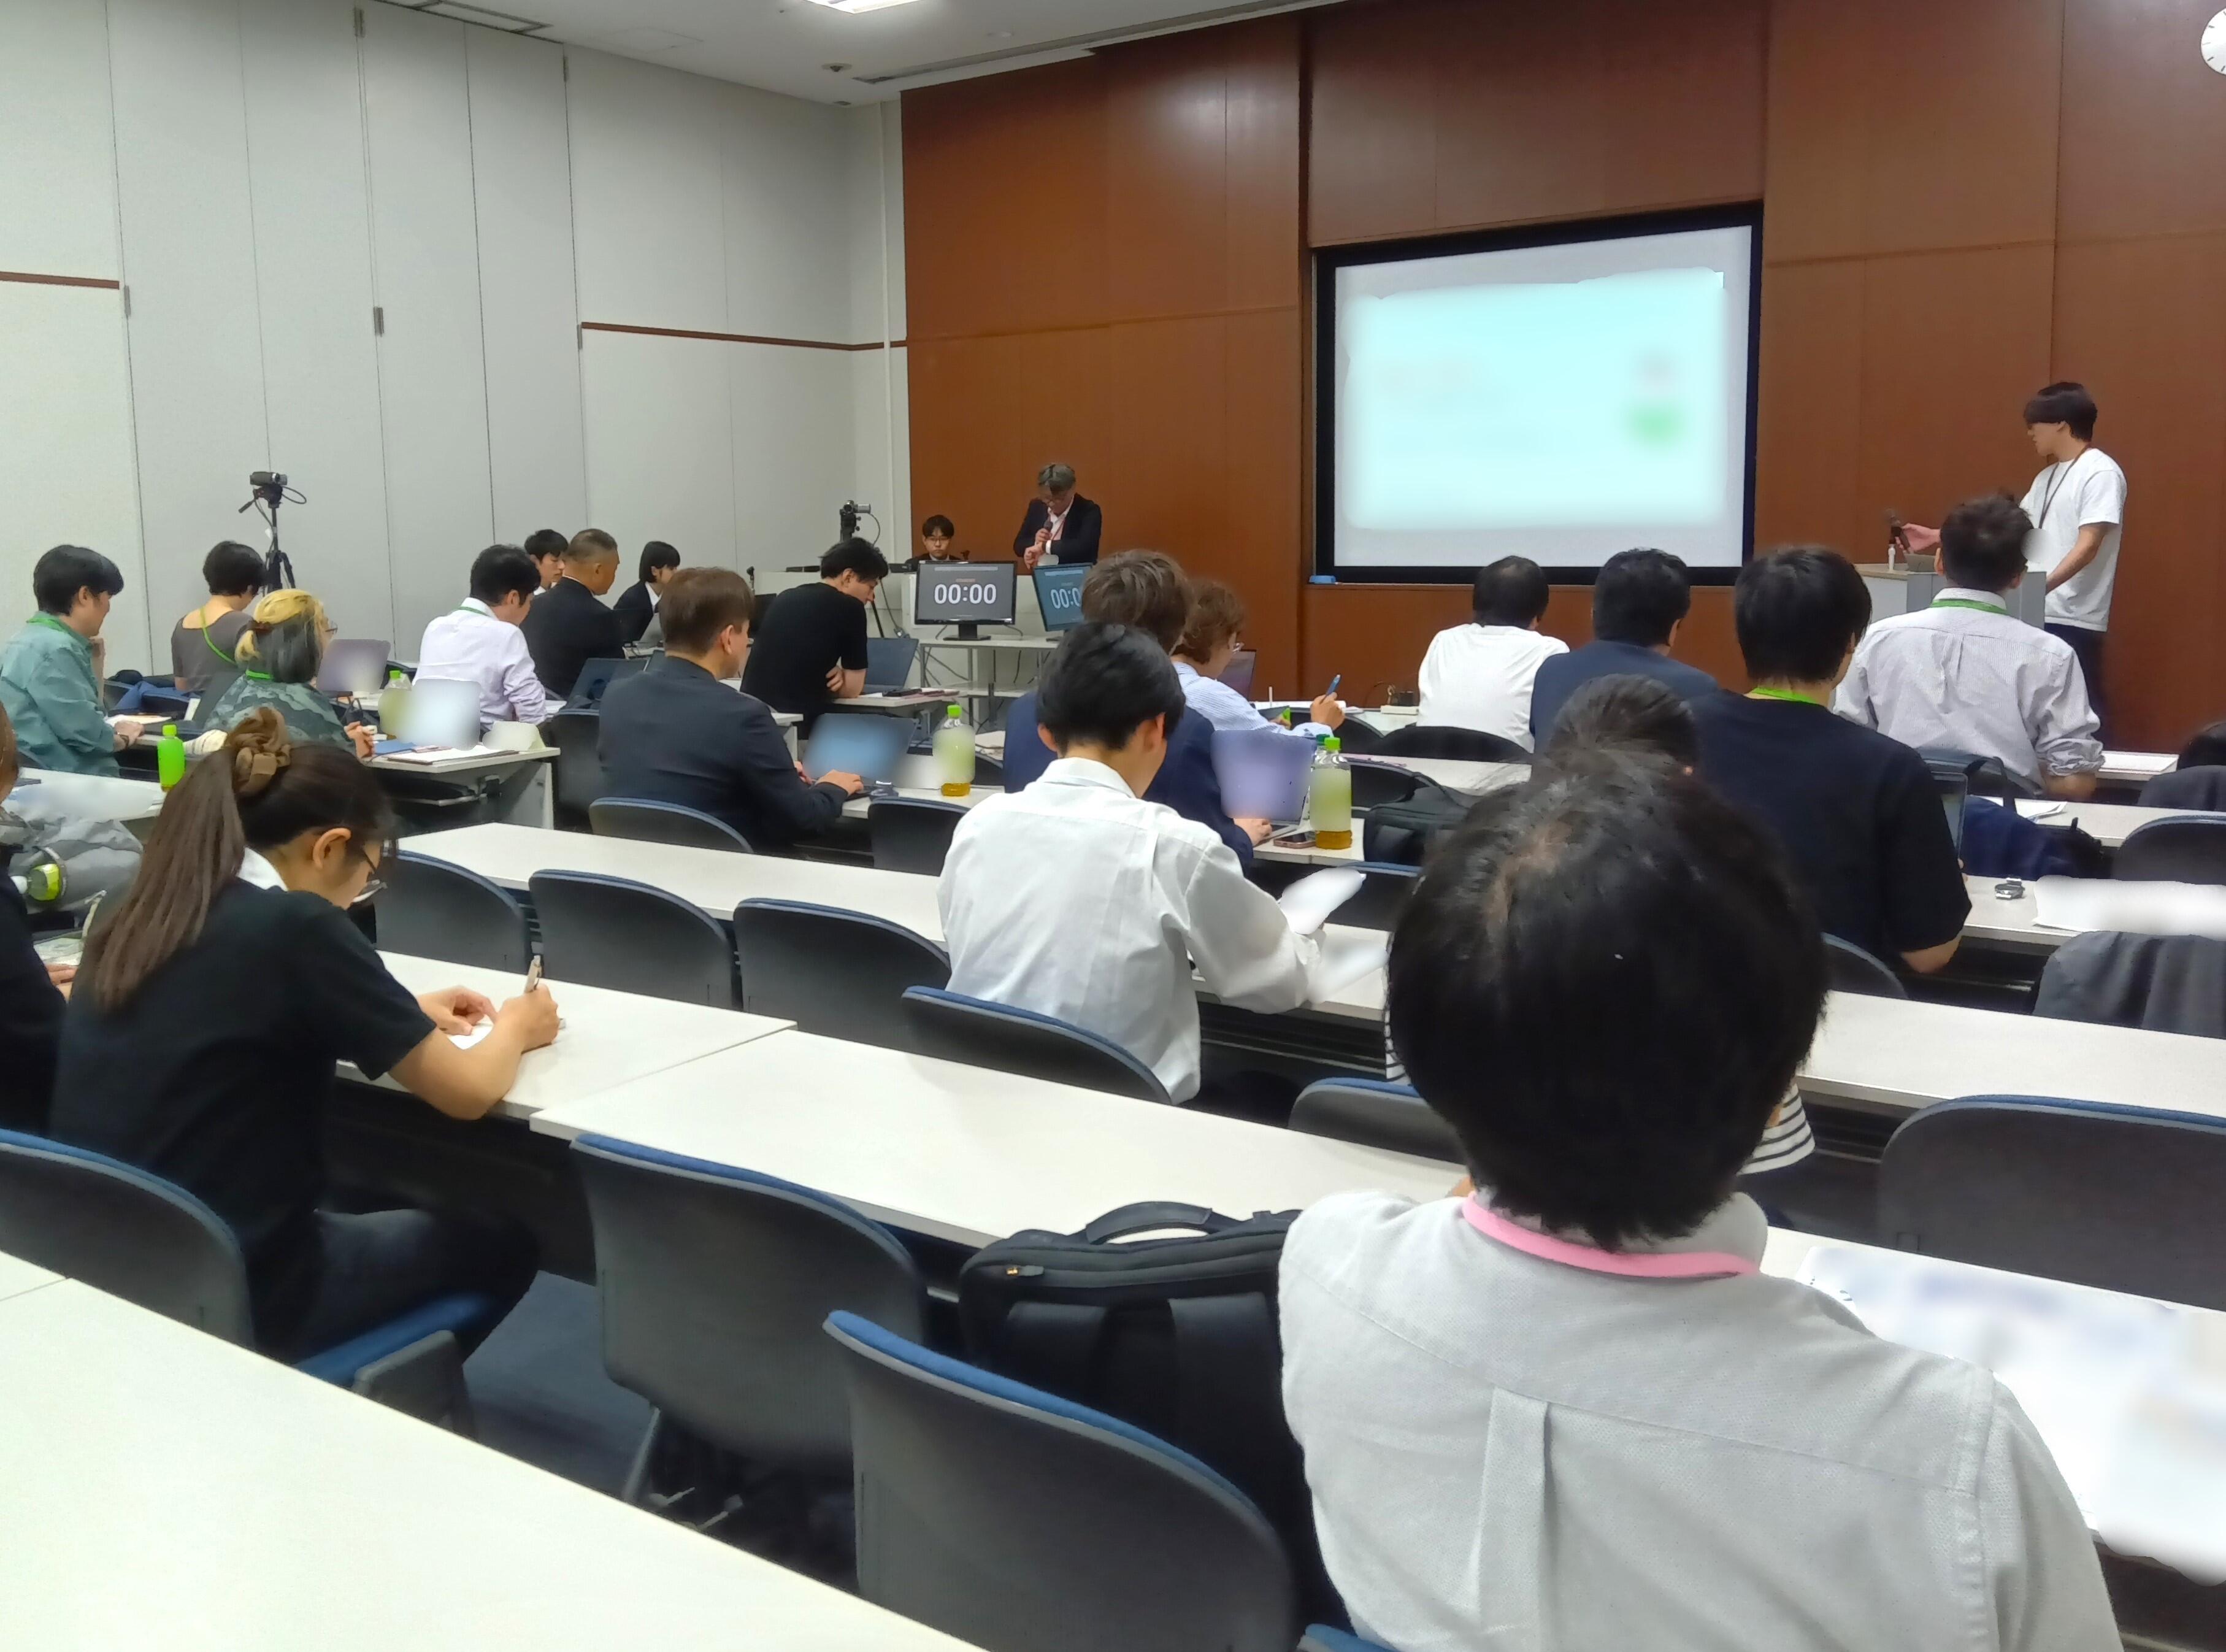
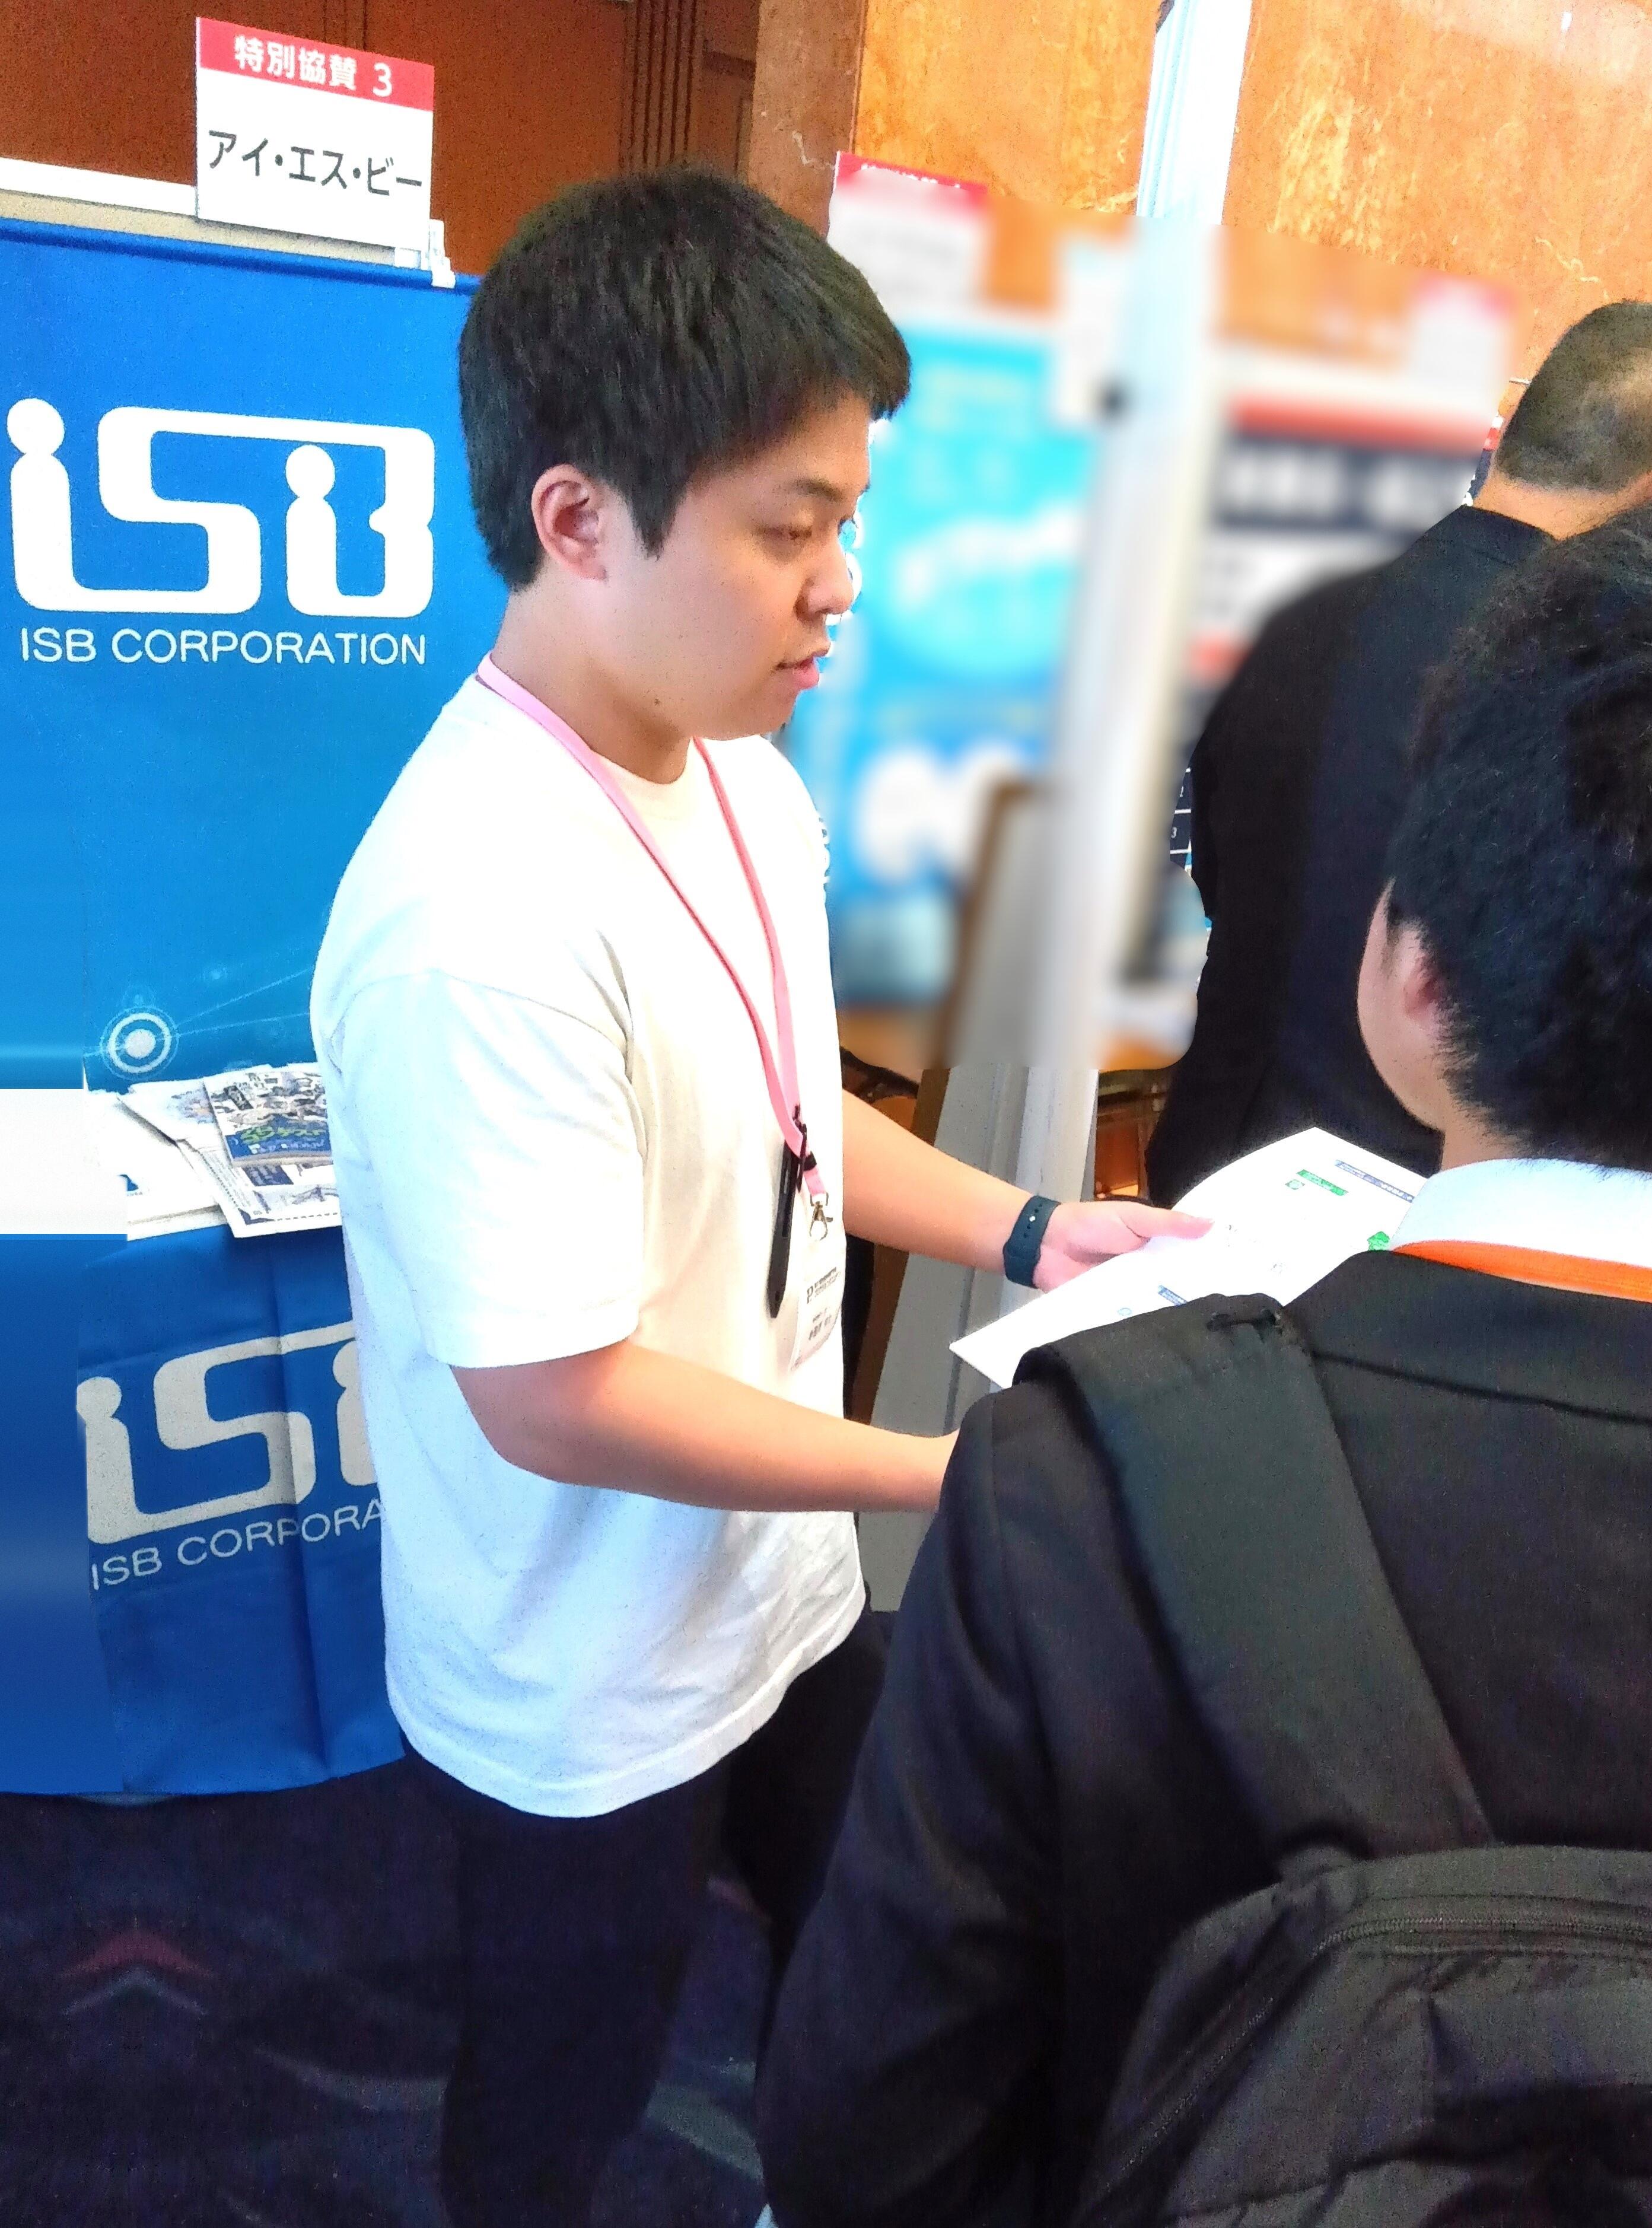
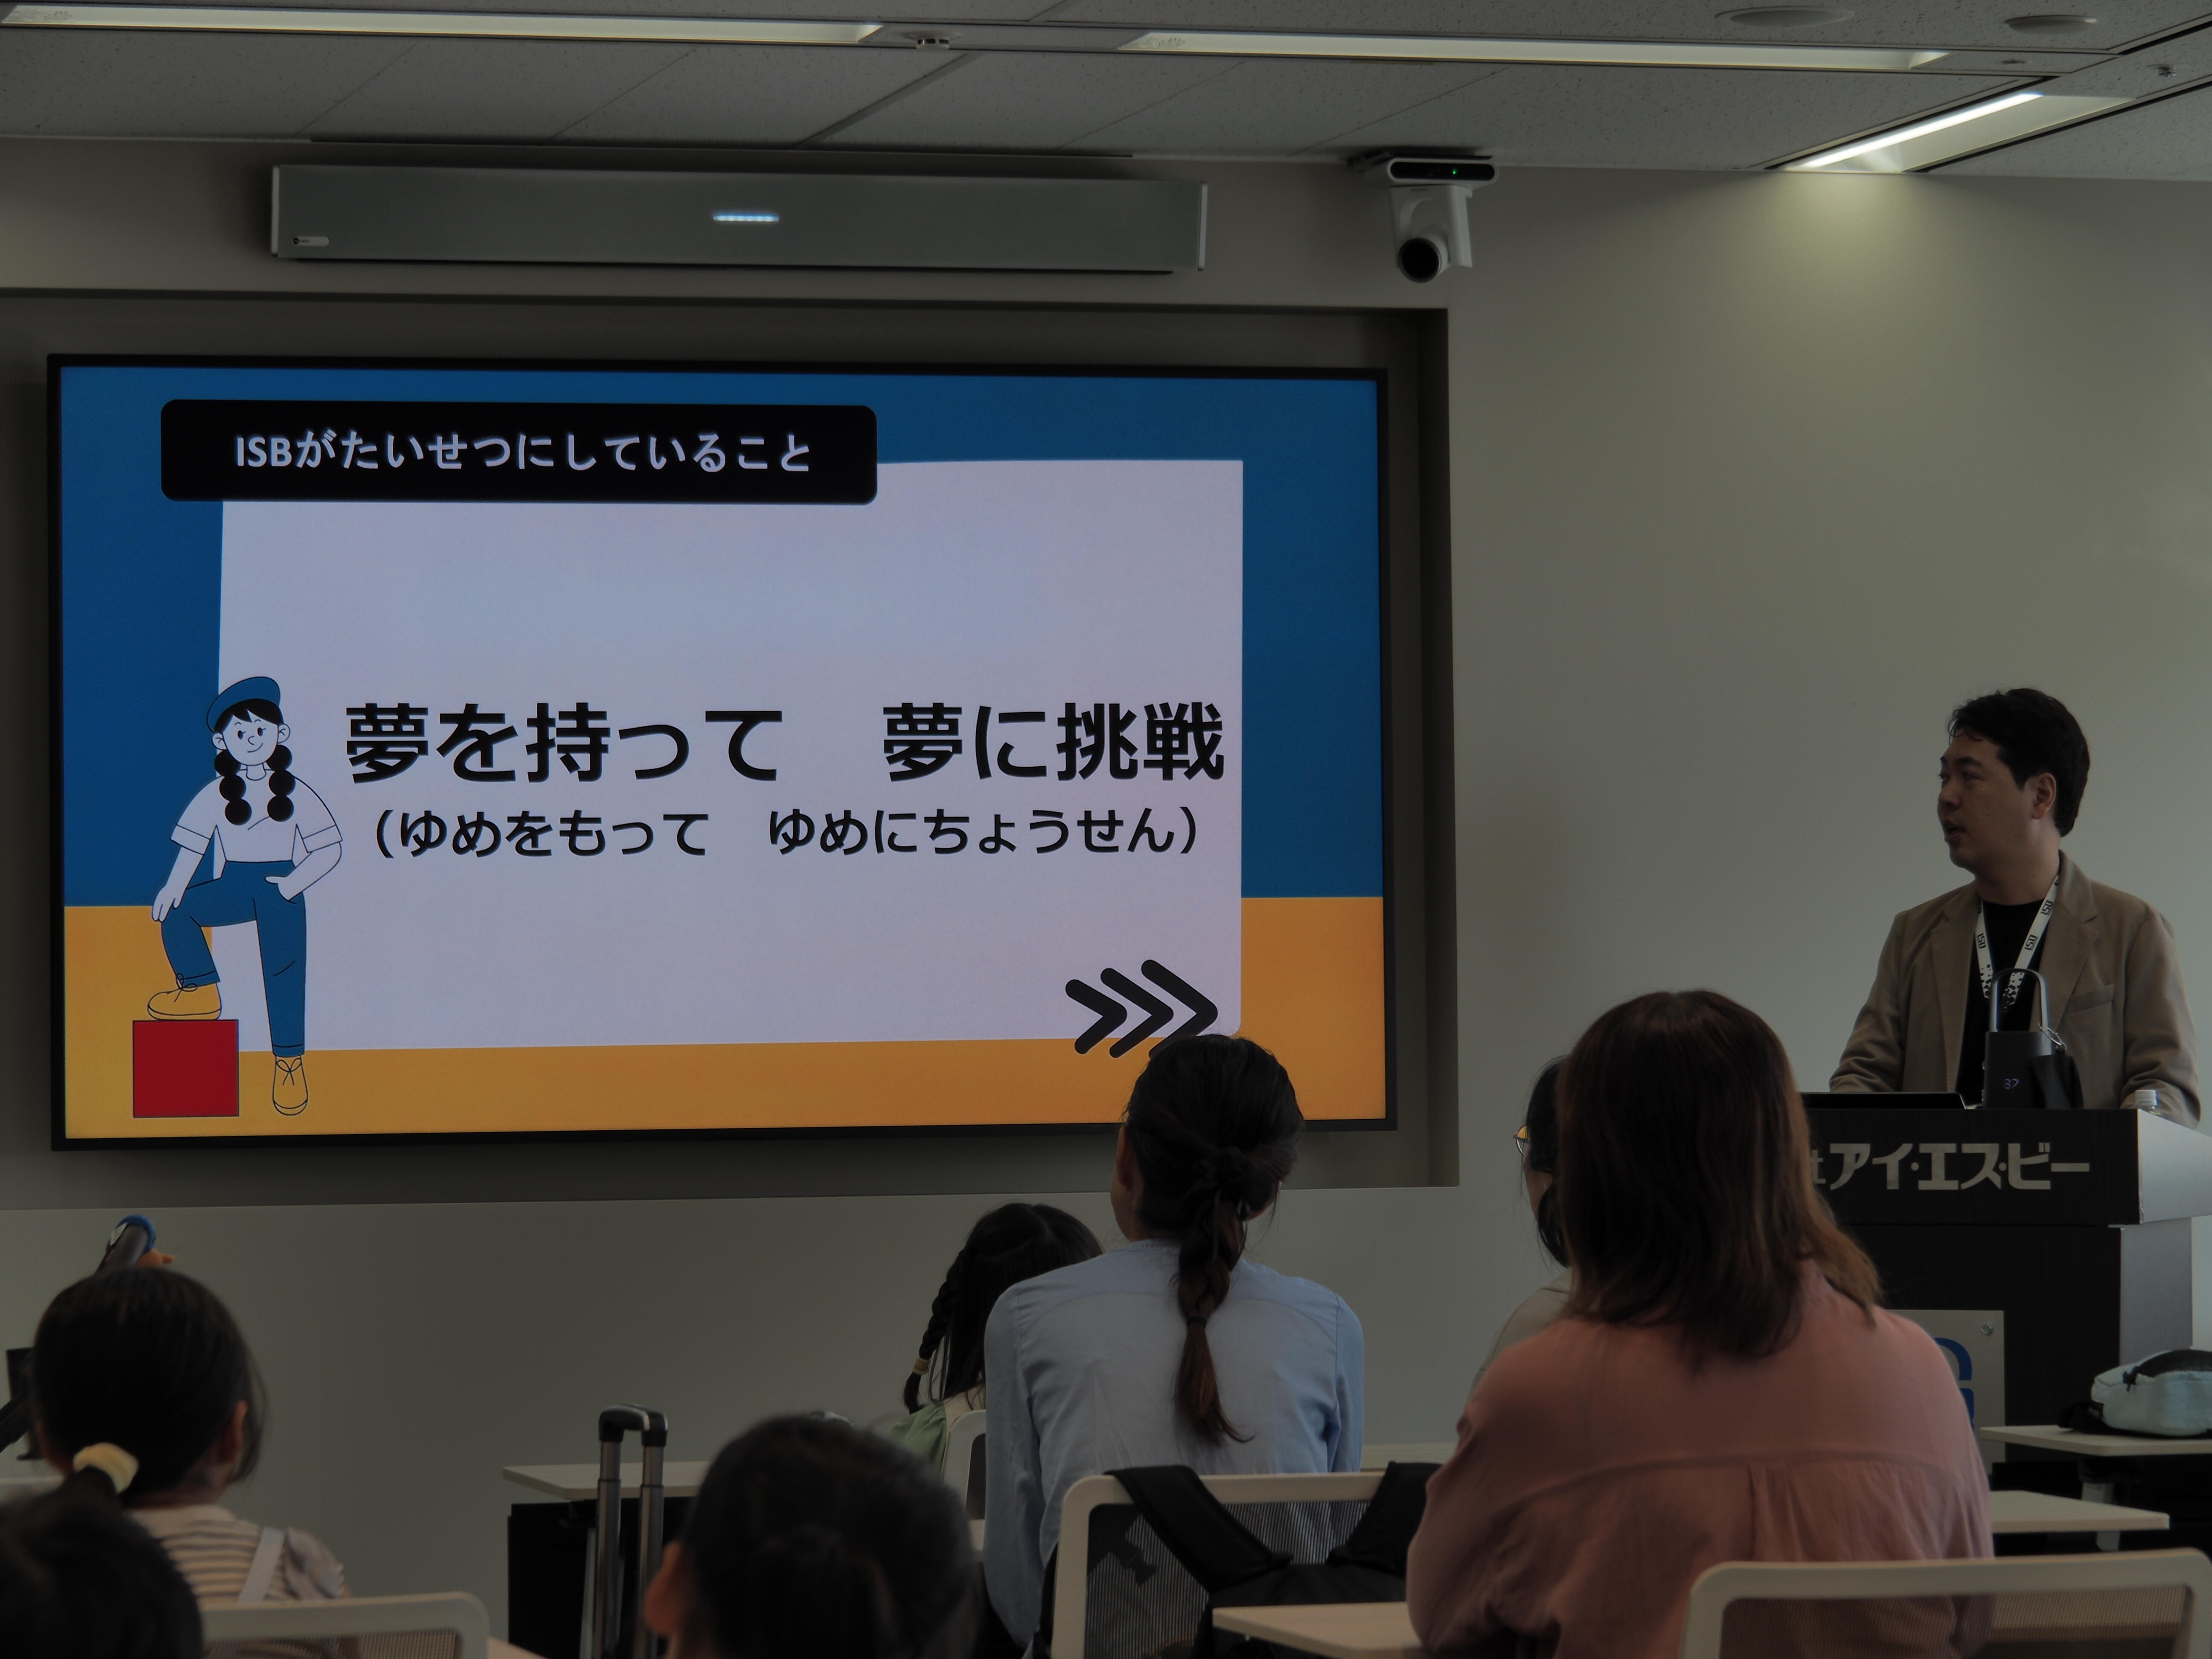
ISBは今後も高専生の豊かな創造性とプログラミングスキルの向上を支援し、次世代のIT社会を牽引する人材の育成と、持続的な業界の発展に貢献してまいります。
なお、個人の写真についてはご本人および大会の許可を得て掲載しています。
■ 関連リンク
第37回全国高等専門学校プログラミングコンテスト
https://www.procon.gr.jp/
地域・社会への貢献
https://www.isb.co.jp/sustainability/social/
タグ
ニュース&イベント情報内検索
search
ご質問、提案のご依頼など お気軽にお問い合わせください
お役立ち資料の ダウンロードはこちらから

株式会社アイ・エス・ビー ISB CORPORATION
© ISB CORPORATION. ALL RIGHTS RESERVED.
Your Vision, Our Innovation


Prompts
Click prompts to add them under the company line, click again to take one out, then copy the result into your AI chat. Shared by Asian Century Stocks and Uncovered Thai Stocks. Thank you.
ISB Corporation (ticker 9702), listed in Japan.
Copied
ETFs Holding ISB Corporation
Exchange-traded funds whose newest published daily portfolio holds one of the company's listings, largest weight first.
| ETF | Weight in ETF | Shares | Market value | As of |
|---|---|---|---|---|
| ORR | 0.19% | 45,102 | $ 710K | Nov 18, 2026 |
| DFIS | 0.00% | 9,700 | $ 152.021K | Nov 12, 2026 |
| DFIC | 0.00% | 12,300 | $ 192.769K | Nov 12, 2026 |
| DFSI | 0.00% | 900 | $ 14.105K | Nov 12, 2026 |
| DFAX | 0.00% | 6,300 | $ 98.735K | Nov 12, 2026 |
| DFAI | 0.00% | 6,200 | $ 97.168K | Nov 12, 2026 |
| AVDS | 0.00% | 100 | $ 1,584.98 | Nov 16, 2026 |