9697
Fiscal year ends March Quarters are offset from the calendar — Q1 is Apr–Jun

Capcom Co., Ltd. is a digital content company that develops and sells home console and mobile video games. Its business segments include digital content, amusement facilities, and amusement equipment. The company operates game arcades and retail stores, and develops, manufactures, and sells arcade machines to facility operators. It also engages in character licensing and related business activities. Key subsidiaries involved in development include K2, Sword Kainz Studio, and Minimum Studios Co., Ltd., while sales are handled by entities such as CAPCOM U.S.A., INC., CE EUROPE LTD., CAPCOM TAIWAN CO., LTD., CAPCOM ENTERTAINMENT FRANCE SAS, CAPCOM ENTERTAINMENT GERMANY GmbH, and CAPCOM SINGAPORE PTE. LTD. Equipment manufacturing involves subsidiaries such as Enterize, Adellion, and Leostar. The company serves global markets through its international sales subsidiaries.

Summarised from the annual report, fiscal year ended Mar 2026

Industry Electronic Gaming & Multimedia Homepage capcom.co.jp
Sector Communication Services IR page capcom.co.jp
Tags
video game development, mobile gaming, arcade machines, amusement facilities, character licensing, console games, K2, Sword Kainz Studio, Minimum Studios Co. Ltd., CAPCOM U.S.A. INC., CE EUROPE LTD., CAPCOM TAIWAN CO. LTD., CAPCOM ENTERTAINMENT FRANCE SAS, CAPCOM ENTERTAINMENT GERMANY GmbH, CAPCOM SINGAPORE PTE. LTD., Enterize, Adellion, Leostar, CAPCOM PICTURES INC.
Press page capcom.co.jp/ir/news

Metrics

Valuation  
Market cap ¥ 2.322T
Market cap (USD) $ 14.515B
P/E 25.98
PEG 1.84
P/BV 7.76
P/S 9.88
P/OCF 36.50
P/FCF 43.70
Dividend yield 1.0%
Turnover / mcap —
Returns  
ROE 22.1%
ROI 17.9%
ROIC 18.2%
Profit margin 27.9%
Growth  
Revenue growing Yes
Profits growing Yes
Revenue up 3y Yes
Revenue up 5y Yes
Earnings growth 3y (net profit CAGR) 14.1%
Quality  
Profitable Yes
Margin expanding No
Buying back stock No
Diluting (TTM) No
Debt/Equity —
Podcast bulls (TTM) Sign up
Podcast bears (TTM) Sign up
Podcast sentiment (TTM) Sign up
Podcast sentiment % (TTM) Sign up
News sentiment (TTM) 47
Quality score 26.3%
Insiders  
Buys, 1w Sign up
Buys, 1m Sign up
Buys, 1y Sign up
Sells, 1w Sign up
Sells, 1m Sign up
Sells, 1y Sign up

Sign up to see this company's insider trades

Figure FY 2026 FY 2025 FY 2024 FY 2023 FY 2022 FY 2021 FY 2020 FY 2019 FY 2018 FY 2017 FY 2016 FY 2015 FY 2014 FY 2013
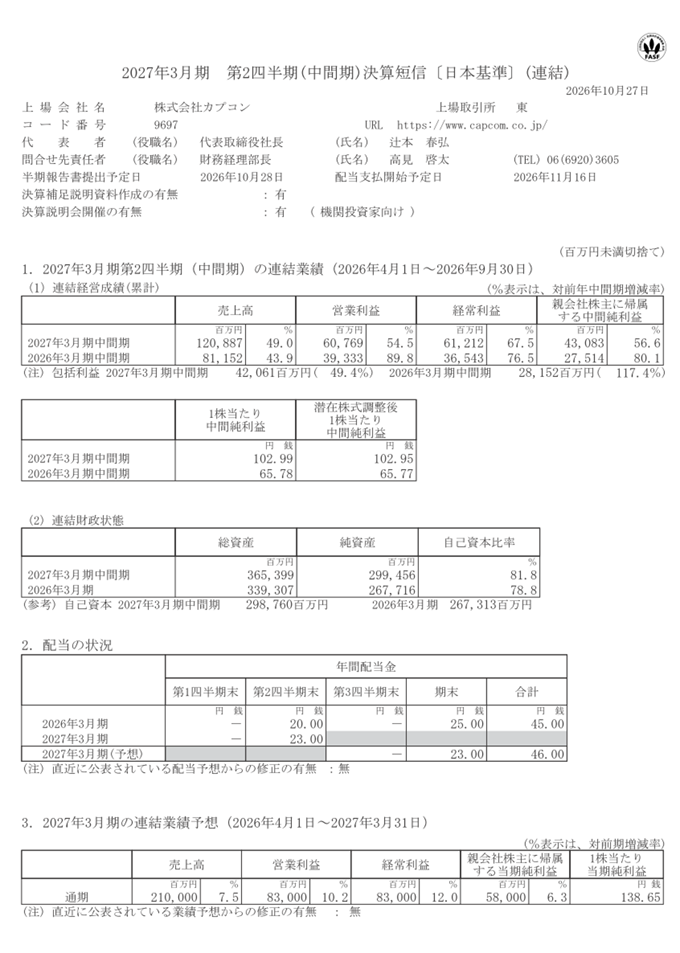
Revenue 195.365B 169.604B 152.41B 125.93B 110.054B 95.308B 81.591B 100.031B 94.515B 87.17B 77.021B 64.277B 102.2B 94.075B
Net profit 54.587B 48.453B 43.374B 36.737B 32.553B 24.923B 15.949B 12.551B 10.937B 8.879B 7.745B 6.616B 3.444B 2.973B
Free cash flow 17.082B 61.341B 31.786B 14.374B 42.88B 11.503B 19.941B 17.642B 31.804B -127M -1.756B — — —

Figure FY 2026 FY 2025 FY 2024 FY 2023 FY 2022 FY 2021 FY 2020 FY 2019 FY 2018 FY 2017 FY 2016 FY 2015 FY 2014 FY 2013
Share price 3.35K 3.661K 2.799K 4.731K 2.968K 3.593K 3.395K 2.483K 2.297K 2.168K 1.373K 1.195K 978.37 1.476K
Price performance 12m -0.08 0.31 -0.41 0.59 -0.17 0.06 0.37 0.08 0.06 0.58 0.15 0.22 -0.34 —

Filed figures

Figure Mar 2017 Mar 2018 Mar 2019 Mar 2020 Mar 2021 Mar 2022 Mar 2023 Mar 2024 Mar 2025 Mar 2026
Balance sheet detail
Trade receivables (JPY) 20.2B 12.9B 14B 16B 25.1B 7.93B 25.1B 25.4B 33.3B 33.3B
↳ YoY growth +104.2% -35.9% +8.0% +14.2% +57.3% -68.4% +216.4% +1.1% +31.4% -0.2%
↳ 5y CAGR +20.5% -17.0% +14.2% +12.7% +15.9% +5.8%
Borrowings, current (JPY) 9.32B 1.47B 1.58B 4.13B 727M 626M 7.22B 4.22B 3.59B —
Borrowings, non-current (JPY) 6.79B 8.32B 6.74B 2.61B 4.88B 4.25B 626M 3B 3B —
Lease liabilities (JPY) 901M 721M 775M 1.19B 1.22B 1.22B 3.91B 4.94B 5.33B 5.1B
Cash and deposits (JPY) 24.5B 46.5B 53B 65.7B 71.2B 107B 102B 125B 167B 148B
Intangible assets (JPY) 2.84B 725M 432M 351M 1.23B 1.75B 1.63B 1.44B 1.44B 1.6B
Net debt (borrowings + leases - cash) (JPY) -7.53B -36B -43.9B -57.7B -64.4B -101B -90.4B -113B -155B —
Cash flow detail
Operating cash flow (JPY) 3.2B 34.7B 19.8B 22.3B 14.6B 46.9B 21.8B 36.9B 67.6B 31.4B
Purchases of property, plant and equipment (JPY) -3.07B -2.77B -2.09B -2.27B -2.31B -2.95B -7.1B -4.84B -5.85B -13.6B
Purchases of intangible assets (JPY) -253M -150M -112M -65M -817M -1.12B -312M -297M -431M -705M
Change in receivables (cash effect) (JPY) -10.4B 7.06B -858M -2.12B -9.03B 17.2B -17.2B -71M -7.98B 222M
Change in inventories (cash effect) (JPY) 158M 1.59B 1.62B -256M -997M 1.38B -500M -825M -1.07B -1.48B
Change in payables (cash effect) (JPY) 2.28B -3.69B 1.67B 749M -2.23B -180M 1.87B -1.44B 1.3B 729M
Dividends paid (cash effect) (JPY) -2.79B -2.74B -3.55B -4.27B -5.33B -8.75B -10.9B -14.3B -16.8B -17.9B
Share buybacks (cash effect) (JPY) -3.3B -5M -6B -1M -3M -2M -13.6B -1M -2M -1M
Interest paid (cash effect) (JPY) -140M -101M -81M -75M -72M -49M -41M -59M -77M -66M
Income taxes paid (cash effect) (JPY) -6.51B -1.55B -5.94B -6.52B -8.16B -11.2B -10.7B -20.1B -8.58B -22.1B
Operating cash flow before change in receivables (JPY) 13.6B 27.7B 20.7B 24.4B 23.7B 29.7B 38.9B 37B 75.6B 31.2B
Free cash flow (OCF - PPE - intangibles) (JPY) -127M 31.8B 17.6B 19.9B 11.5B 42.9B 14.4B 31.8B 61.3B 17.1B
Income detail
Research and development expense (JPY) 695M 1.1B 27B 25.8B 25.4B 29.9B 37.7B 43B 49.5B 54.8B
↳ 5y CAGR +88.3% +112.1% +102.7% +9.7% +13.9% +16.7%
Total comprehensive income (JPY) 8.68B 10.4B 12.9B 15.3B 26.4B 34.4B 39.2B 48.2B 47.8B 59B
Comprehensive income to owners (JPY) 8.68B 10.4B 12.9B 15.3B 26.4B 34.4B 39.2B 48.2B 47.9B 59B
Segments
Amusement Equipments · Segment revenue (JPY) 16.9B 7.8B 3.42B 6.53B 7.09B 5.75B 7.8B 9.02B 15.6B 17.8B
↳ YoY growth +26.3% -53.7% -56.1% +90.9% +8.5% -18.9% +35.7% +15.6% +73.1% +13.9%
Amusement Equipments · Segment operating income (JPY) 5.11B -764M -2.67B 2.09B 2.41B 2.35B 3.43B 4.12B 6.7B 10B
Arcade Operations · Segment revenue (JPY) 9.53B 10.2B 11.1B 12.1B 9.87B 12.4B 15.6B 19.3B 22.8B 25.7B
↳ YoY growth +5.2% +7.4% +8.0% +9.5% -18.4% +25.7% +25.8% +23.9% +17.6% +12.8%
Arcade Operations · Segment operating income (JPY) 752M 879M 1.1B 1.21B 149M 652M 1.23B 1.87B 2.43B 3.2B
Degital Contents · Segment revenue (JPY) 58.7B 74.1B 83B 59.9B 75.3B 87.5B 98.2B 120B 125B 144B
↳ YoY growth +11.7% +26.3% +11.9% -27.8% +25.6% +16.2% +12.1% +22.1% +4.4% +15.3%
Degital Contents · Segment operating income (JPY) 11.1B 19.1B 23.3B 24.2B 37B 45.4B 53.5B 59.8B 65.2B 70.6B
Reported Jun 12, 2017 Jun 12, 2018 Jun 18, 2019 Jun 18, 2020 Jun 23, 2021 Jun 24, 2022 Jun 21, 2023 Jun 21, 2024 Jun 23, 2025 Jun 16, 2026

Sign up to see institutional holdings

Sign Up

Podcast Mentions

Sign up to see podcast mentions and sentiment

Sign Up

CAPCOM

企業情報|投資家情報(IR)

検索検索

企業情報全体

企業情報全体 プレスリリース

検索

  1. ホーム

  2. プレスリリース

  3. 映画『ストリートファイター/ザ・ムービー』が、全米週間興行収入ランキング1位を獲得!~ 映画化を通じ…

capcom


PDF-

  • 2026年11月2日
  • 報道関係者各位
  • 大阪市中央区内平野町三丁目1番3号
    株式会社カプコン
    代表取締役社長 辻本 春弘
    (コード番号:9697 東証プライム)

映画『ストリートファイター/ザ・ムービー』が、
全米週間興行収入ランキング1位を獲得!
~ 映画化を通じ、IPのグローバルな認知拡大と価値向上に寄与 ~

株式会社カプコンは、2026年10月16日に公開した映画『ストリートファイター/ザ・ムービー』が、全米の週間興行収入において約3,834万ドルを記録し、週間ランキング第1位※を獲得したことをお知らせします。あわせて、全世界での週間興行収入は約6,354万ドルを記録しました。

※ 2026年10月16日~10月22日までのBox Office Mojoの速報値を引用

本作は、Legendary Entertainment社(以下Legendary社)との共同出資によるアクション映画です。主人公であるリュウとケンが、世界最強を決める格闘大会「ワールドウォリアートーナメント」に挑むうちに裏に潜む陰謀に触れ、強大な敵に立ち向かう物語となっています。当社のIPとして世界的人気を誇る「ストリートファイター」の世界観を実写映画としてお楽しみいただける作品です。

公開にあわせて、全世界プロモーションツアーや、日米におけるプレミア上映、ゲームタイトルとの連携や各種コラボレーション施策を展開したことで、ゲームファンにとどまらない幅広い層との接点を創出しました。その結果、本作は国内外で支持を獲得しました。

今後も当社は、ワンコンテンツ・マルチユース戦略のもと、保有する豊富なIPの多面展開を推進し、持続的な成長および企業価値向上に努めてまいります。

ストリートファイター/ザ・ムービー』キービジュアル 『ストリートファイター/ザ・ムービー』 キービジュアル 全世界プロモーションツアー「ストリートファイター・ワールドウォリアー・ツアー」東京・新宿開催 全世界プロモーションツアー 「ストリートファイター・ワールドウォリアー・ツアー」東京・新宿開催

【映画『ストリートファイター/ザ・ムービー』概要 】

タイトル名 ストリートファイター/ザ・ムービー
公開日 2026年10月16日 全世界同時公開
ジャンル アクション
キャスト ケン役:ノア・センティネオ リュウ役:アンドリュー・小路 春麗役:カリーナ・リャン ほか
配給 東和ピクチャーズ・東宝

【Legendary社について】

映画(Legendary Pictures)、テレビおよびデジタルメディア(Legendary Television and Digital Media)、コミック(Legendary Comics)などの部門を擁し、業界を牽引する制作会社です。これまでにLegendary Picturesが関与した作品の累計興行収入は、ゲームを原作とした複数の実写映画を含め、全世界で約210億ドルに達します。

【「ストリートファイター」シリーズについて】

当シリーズは、1987年に業務用ゲーム機として第1作目を発売、1991年に投入した『ストリートファイターII』では、革新的な対戦システムが話題を呼び大ヒットを記録しました。以降、登場から30年以上を経た現在まで、シリーズ累計販売本数は6,000万本※を超え世界中でロングセラーを記録しています。また近年では、eスポーツにおける対戦格闘ジャンルのけん引役としても存在感を高めています。

※2026年9月30日時点

本件に関するお問い合わせ先

報道関係者・投資家様向けお問い合わせ先

財経・IT・広報統括 広報IR室
TEL : 06-6920-3623 / FAX : 06-6920-5108

マスコミ関係者向けお問い合わせ先

販売戦略部 クロスメディアマーケティングチーム
TEL: 03-3340-0750/FAX: 03-3340-0721

ユーザー様向けお問い合わせ先

お客様相談室 家庭用ゲームサポート
TEL: 06-6946-3099

関連ページ

シェア

シェア

### More CAPCOM

もっとカプコンを知る

もっとカプコンを知る

CAPCOM

ⒸCAPCOM

Prompts

Capcom Co., Ltd. (ticker 9697), listed in Japan.

ETFs Holding Capcom Co., Ltd.

ETF Weight in ETF Shares Market value As of
NERD 4.07% 21,300 $ 600.91K Nov 17, 2026
JSTC 0.18% 18,581 $ 532.366K Nov 17, 2026
DIHP 0.16% 381,500 $ 10.512M Nov 12, 2026
DFSI 0.04% 18,700 $ 515.273K Nov 12, 2026
DFAI 0.04% 262,076 $ 7.221M Nov 12, 2026
DFIC 0.03% 181,600 $ 5.004M Nov 12, 2026
AVSD 0.03% 4,000 $ 114.007K Nov 16, 2026
DXIV 0.03% 2,600 $ 71.642K Nov 12, 2026
AVDE 0.02% 138,900 $ 3.959M Nov 16, 2026
DFAX 0.02% 85,500 $ 2.356M Nov 12, 2026