自己株券買付状況報告書(法24条の6第1項に基づくもの)
Bull 0
Bear 0
Routine
|
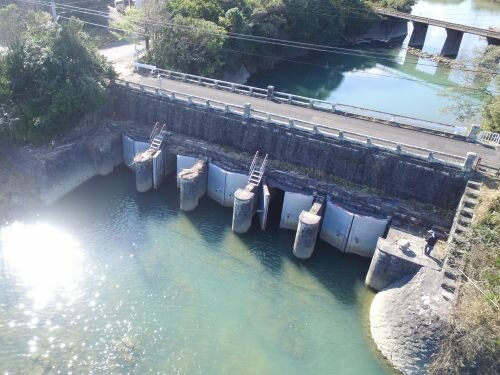
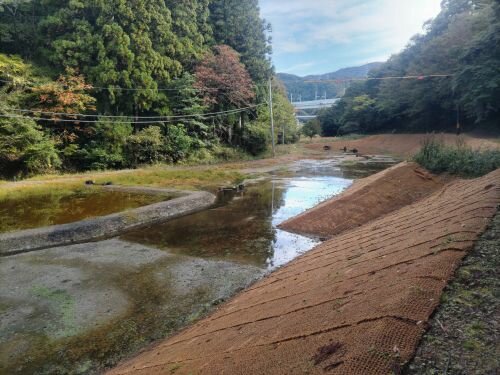
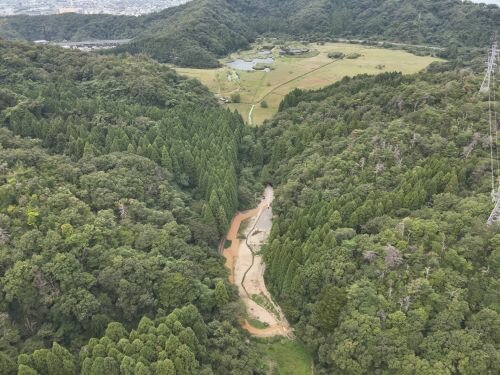
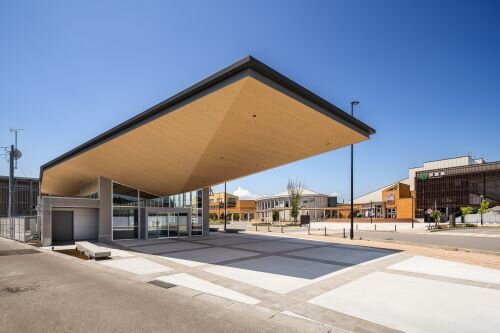
CTI Engineering Co., Ltd. is a construction consulting firm that provides planning, investigation, design, and operational maintenance services for public and private infrastructure projects. The company operates through two main segments: domestic construction consulting and overseas construction consulting. Domestic activities include comprehensive consulting for rivers, dams, roads, and environmental projects, alongside specialized services in land readjustment, geological surveys, architectural design, and environmental testing. Key subsidiaries handling these domestic operations include Hiroken Consultants, Nippon City Planning, Chiken Sogo Consultants, Nisokken, and Environmental General Research. The overseas segment covers project development, master planning, and construction management globally, supported by subsidiaries such as CTI Engineering International, Waterman Group Plc, Waterman Group (Aus) Pty Limited, and Waterman Aspen Limited, which also provide building-related services and technical staffing. Summarised from the annual report, fiscal year ended Dec 2025 |
Industry Engineering & Construction | Homepage ctie.co.jp |
| Sector Industrials | IR page ctie.co.jp | |
|
Tags
construction consulting, infrastructure planning, environmental engineering, geological surveys, architectural design, land readjustment, project management, technical staffing, Hiroken Consultants, Nippon City Planning, Chiken Sogo Consultants, Nisokken, Environmental General Research, CTI Engineering International, Waterman Group Plc, Waterman Group (Aus) Pty Limited, Waterman Aspen Limited
|
Press page ctie.co.jp/news |
Metrics
| Valuation | |
|---|---|
| Market cap | ¥ 91.892B |
| Market cap (USD) | $ 576.424M |
| P/E | 12.42 |
| PEG | 28.18 |
| P/BV | 1.36 |
| P/S | 0.86 |
| P/OCF | 15.93 |
| P/FCF | 19.96 |
| Dividend yield | 2.3% |
| Turnover / mcap | — |
| Returns | |
|---|---|
| ROE | 9.3% |
| ROI | 8.7% |
| ROIC | 8.9% |
| Profit margin | 5.9% |
| Growth | |
|---|---|
| Revenue growing | Yes |
| Profits growing | No |
| Revenue up 3y | Yes |
| Revenue up 5y | Yes |
| Earnings growth 3y (net profit CAGR) | 0.44% |
| Quality | |
|---|---|
| Profitable | Yes |
| Margin expanding | No |
| Buying back stock | No |
| Diluting (TTM) | No |
| Debt/Equity | — |
| Podcast bulls (TTM) | Sign up |
| Podcast bears (TTM) | Sign up |
| Podcast sentiment (TTM) | Sign up |
| Podcast sentiment % (TTM) | Sign up |
| News sentiment (TTM) | 54 |
| Quality score | 16.7% |
| Insiders | |
|---|---|
| Buys, 1w | Sign up |
| Buys, 1m | Sign up |
| Buys, 1y | Sign up |
| Sells, 1w | Sign up |
| Sells, 1m | Sign up |
| Sells, 1y | Sign up |
Sign up to see this company's insider trades
| Figure | FY 2025 | FY 2024 | FY 2023 | FY 2022 | FY 2021 | FY 2020 | FY 2019 | FY 2018 | FY 2017 | FY 2016 | FY 2015 | FY 2014 | FY 2013 | FY 2012 |
|---|---|---|---|---|---|---|---|---|---|---|---|---|---|---|
| Revenue | 101.038B | 97.678B | 93.057B | 83.485B | 74.409B | 65.19B | 62.649B | 58.443B | 49.301B | 42.033B | 40.22B | 39.524B | 36.435B | 32.515B |
| Net profit | 5.952B | 6.746B | 7.534B | 5.874B | 4.471B | 3.65B | 2.808B | 1.893B | 1.615B | 1.447B | 1.633B | 1.49B | 982M | 550M |
| Free cash flow | 4.604B | 1.56B | 31M | 3.144B | 4.783B | 8.05B | 3.889B | 548M | 1.918B | -649M | 1.255B | — | — | — |
| Figure | FY 2025 | FY 2024 | FY 2023 | FY 2022 | FY 2021 | FY 2020 | FY 2019 | FY 2018 | FY 2017 | FY 2016 | FY 2015 | FY 2014 | FY 2013 | FY 2012 |
|---|---|---|---|---|---|---|---|---|---|---|---|---|---|---|
| Share price | 2.972K | 2.46K | 5.26K | 3.21K | 2.499K | 2.381K | 2.26K | 1.552K | 1.151K | 1.042K | 1.242K | 1.541K | 1.057K | 603.08 |
| Price performance 12m | 0.21 | -0.53 | 0.64 | 0.28 | 0.05 | 0.05 | 0.46 | 0.35 | 0.1 | -0.16 | -0.19 | 0.46 | 0.75 | — |
Filed figures
Lines the statements and their notes report beside the headline figures, read from the filings' XBRL as filed (no restatement applied), with figures computed from one filing's own lines. Cash-flow lines carry their cash direction: an outflow is negative. Each period links to its filing; a figure's period, report date and tag are in its tooltip.
| Figure | Dec 2016 | Dec 2017 | Dec 2018 | Dec 2019 | Dec 2020 | Dec 2021 | Dec 2022 | Dec 2023 | Dec 2024 | Dec 2025 |
|---|---|---|---|---|---|---|---|---|---|---|
| Balance sheet detail | ||||||||||
| Trade receivables (JPY) | — | — | — | — | — | — | 22M | 18M | 14M | 9M |
| ↳ YoY growth | -18.2% | -22.2% | -35.7% | |||||||
| Borrowings, current (JPY) | 700M | 487M | 759M | 1B | 750M | 900M | 1.19B | 1.19B | 1.99B | 1.38B |
| Borrowings, non-current (JPY) | — | 6M | — | — | — | — | 201M | 160M | 119M | 78M |
| Lease liabilities (JPY) | 143M | 115M | 173M | 1.65B | 1.6B | 1.58B | 1.5B | 1.53B | 1.92B | 4B |
| Cash and deposits (JPY) | 11.2B | 6.62B | 6.72B | 9.87B | 16.7B | 20.5B | 22.6B | 19.7B | 15.5B | 16B |
| Intangible assets (JPY) | 489M | 5.7B | 5.33B | 5.26B | 4.85B | 4.97B | 4.66B | 4.74B | 7.25B | 6.97B |
| Net debt (borrowings + leases - cash) (JPY) | -10.4B | -6.01B | -5.79B | -7.22B | -14.3B | -18B | -19.7B | -16.8B | -11.5B | -10.5B |
| Cash flow detail | ||||||||||
| Operating cash flow (JPY) | -201M | 2.83B | 1.87B | 4.8B | 8.69B | 5.34B | 3.8B | 874M | 2.41B | 5.77B |
| Purchases of property, plant and equipment (JPY) | -233M | -775M | -926M | -566M | -433M | -360M | -560M | -843M | -850M | -1.16B |
| Purchases of intangible assets (JPY) | -215M | -141M | -399M | -343M | -204M | -201M | -100M | -127M | -102M | -134M |
| Change in receivables (cash effect) (JPY) | -759M | 610M | -1.28B | 102M | 1.14B | -2.23B | — | -7.03B | -4.82B | -3.63B |
| Dividends paid (cash effect) (JPY) | -282M | -282M | -310M | -353M | -494M | -634M | -844M | -1.41B | -2.07B | -2.08B |
| Share buybacks (cash effect) (JPY) | 0.00 | 0.00 | 0.00 | 0.00 | 0.00 | 0.00 | 0.00 | -1.03B | -2M | -642M |
| Interest paid (cash effect) (JPY) | -3M | -7M | -10M | -52M | -51M | -50M | -54M | -55M | -72M | -103M |
| Income taxes paid (cash effect) (JPY) | -838M | -910M | -952M | -1.71B | -1.56B | -2.33B | -3.13B | -4.55B | -2.36B | -2.33B |
| Operating cash flow before change in receivables (JPY) | 558M | 2.22B | 3.15B | 4.7B | 7.55B | 7.57B | — | 7.9B | 7.23B | 9.4B |
| Free cash flow (OCF - PPE - intangibles) (JPY) | -649M | 1.92B | 548M | 3.89B | 8.05B | 4.78B | 3.14B | -96M | 1.46B | 4.47B |
| Income detail | ||||||||||
| Research and development expense (JPY) | 923M | 1.05B | 1.03B | 995M | 923M | 976M | 1.11B | 1.23B | 1.44B | 1.51B |
| ↳ 5y CAGR | -0.2% | +1.1% | +1.1% | +3.7% | +7.6% | +10.3% | ||||
| Total comprehensive income (JPY) | 1.26B | 2.24B | 1.3B | 3.77B | 3.66B | 6.08B | 6.2B | 9.67B | 8.6B | 7.64B |
| Comprehensive income to owners (JPY) | 1.29B | 2.19B | 1.29B | 3.68B | 3.64B | 6B | 6.13B | 9.63B | 8.56B | 7.57B |
| Provision for credit losses (JPY) | 0.00 | 36M | 115M | 170M | 79M | 48M | 59M | 84M | 73M | 107M |
| Credit cost ratio (credit losses / average receivables) (%) | — | — | — | — | — | — | — | 420.0% | 456.3% | 930.4% |
| Segments | ||||||||||
| Domestic Construction Consultant · Segment revenue (JPY) | 38.8B | 39.7B | 40.9B | 45.5B | 49B | 53.7B | 58.2B | 64.6B | 67B | 69.8B |
| ↳ YoY growth | +2.2% | +3.2% | +11.2% | +7.6% | +9.6% | +8.3% | +11.0% | +3.7% | +4.1% | |
| Domestic Construction Consultant · Segment operating income (JPY) | 2.32B | 2.51B | 2.76B | 3.83B | 5.03B | 6.03B | 6.89B | 8.94B | 8.61B | 8.61B |
| Overseas Construction Consultant · Segment revenue (JPY) | 3.25B | 9.73B | 17.6B | 17.2B | 16.3B | 20.7B | 25.4B | 28.6B | 30.7B | 31.3B |
| ↳ YoY growth | +199.6% | +81.0% | -2.1% | -5.7% | +27.5% | +22.3% | +12.8% | +7.5% | +1.9% | |
| Overseas Construction Consultant · Segment operating income (JPY) | 56M | 134M | 278M | 441M | 45M | 951M | 1.13B | 1.07B | 773M | 543M |
| Reported | Mar 28, 2018 | Mar 28, 2018 | Mar 27, 2019 | Mar 27, 2020 | Mar 26, 2021 | Mar 25, 2022 | Mar 29, 2023 | Mar 26, 2025 | Mar 26, 2025 | Mar 26, 2026 |
Sign up to see institutional holdings
Sign UpPodcast Mentions
Sign up to see podcast mentions and sentiment
Sign UpTimely disclosures published on TDnet, newest first, titles as filed in Japanese. The link opens the disclosure on TDnet. Filings with EDINET (periodic reports, extraordinary reports, offerings, holding and buy-back reports), newest first, titles as filed in Japanese. The link opens the filing on EDINET. Press releases from the company's own website, newest first.
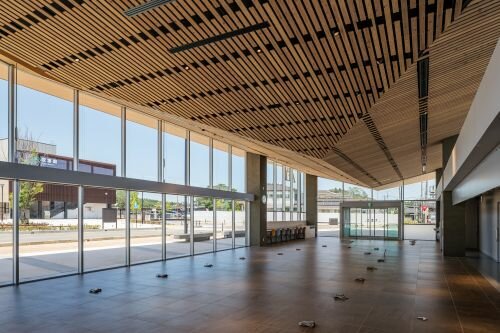
 東北支社が開設50周年を迎えることができましたのは、地域の皆さまをはじめ、行政機関や関係者の皆さまからの長年にわたるご支援とご信頼の賜物であり、心より感謝申し上げます。

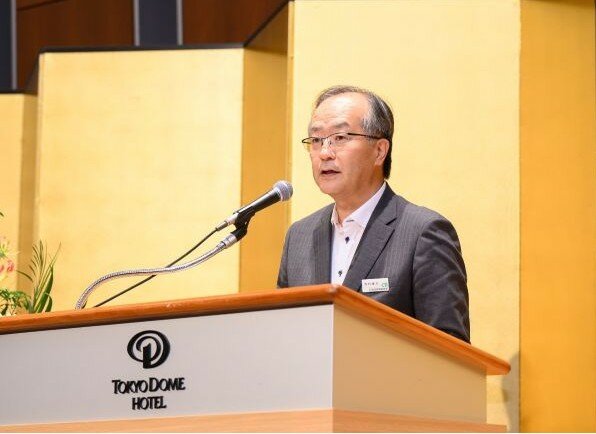
 おかげ様をもちまして、中部支社は50周年を迎えることができました。50周年は、これまでの歩みを振り返る節目であると同時に、これからの中部支社のあり方を考える新たな出発点でもあります。社会や地域を取り巻く環境が大きく変化する中、私たちに求められる役割や責任は、これまで以上に広く深くなると考えます。これからも、地域の声に耳を傾け、新たな技術や発想を積極的に取り入れながら、支社職員一人ひとりが専門性を発揮し、より良い地域の未来をともにつくっていきたいと考えています。次の50年に向けて、中部支社は新たな挑戦を続けてまいります。引き続き、ご支援のほどよろしくお願いします。









Prompts
Click prompts to add them under the company line, click again to take one out, then copy the result into your AI chat. Shared by Asian Century Stocks and Uncovered Thai Stocks. Thank you.
CTI Engineering Co., Ltd. (ticker 9621), listed in Japan.
Copied
ETFs Holding CTI Engineering Co., Ltd.
Exchange-traded funds whose newest published daily portfolio holds one of the company's listings, largest weight first.
| ETF | Weight in ETF | Shares | Market value | As of |
|---|---|---|---|---|
| AVDV | 0.02% | 179,200 | $ 4.072M | Nov 16, 2026 |
| AVDS | 0.02% | 2,600 | $ 59.075K | Nov 16, 2026 |
| DXIV | 0.01% | 1,200 | $ 27.392K | Nov 12, 2026 |
| DFIS | 0.01% | 25,700 | $ 586.648K | Nov 12, 2026 |
| DISV | 0.00% | 9,800 | $ 223.702K | Nov 12, 2026 |
| DFSI | 0.00% | 2,200 | $ 50.219K | Nov 12, 2026 |
| DFIC | 0.00% | 26,600 | $ 607.192K | Nov 12, 2026 |
| DFAX | 0.00% | 14,200 | $ 324.14K | Nov 12, 2026 |
| DFAI | 0.00% | 14,300 | $ 326.423K | Nov 12, 2026 |
| AVDE | 0.00% | 20,400 | $ 463.512K | Nov 16, 2026 |