自己株券買付状況報告書(法24条の6第1項に基づくもの)
Bull 0
Bear 0
Capital return
9532
Fiscal year ends March
Quarters are offset from the calendar — Q1 is Apr–Jun
|
Osaka Gas Co., Ltd. is a diversified energy and utility group operating through three main segments: domestic energy, overseas energy, and life & business solutions. In the domestic energy segment, the company manufactures, supplies, and sells natural gas, electricity, and gas appliances, while also providing gas piping construction and energy services. Key subsidiaries in this segment include Osaka Gas Network, which manages gas transmission infrastructure, and Daigas Energy, which handles commercial gas and electricity sales. The group also operates power generation facilities, including natural gas and biomass plants, and engages in LNG transportation and trading through subsidiaries such as Osaka Gas International Transport and Osaka Gas Energy Supply and Trading. The overseas energy segment focuses on natural gas development, investment, and supply in regions including the United States, Australia, Southeast Asia, India, and Europe, with subsidiaries like Osaka Gas USA Corporation and Osaka Gas Australia Pty Ltd. In the life & business solutions segment, the company provides real estate development and management, facility operations, software development, and information processing services. Additionally, the group manufactures fine materials, carbon products, and activated carbon through subsidiaries such as Osaka Gas Chemical and Jacobi Carbons AB. Summarised from the annual report, fiscal year ended Mar 2026 |
Industry Utilities - Regulated Gas | Homepage osakagas.co.jp |
| Sector Utilities | IR page osakagas.co.jp/company/ir/koukoku/index.html | |
|
Tags
natural gas, electricity generation, lng trading, gas appliances, real estate development, activated carbon, software development, facility management, biomass power, energy services, Osaka Gas Network, Osaka Gas Marketing, Daigas Energy, Daigas Gas and Power Solution, Osaka Gas International Transport, Osaka Gas Energy Supply and Trading Pte.Ltd., Global Base, Izumi North Natural Gas Power Generation, Sodegaura Biomass Power Generation, Nakayama Nagoya Joint Power Generation, Himeji Natural Gas Power Generation, Hirokawa Akagamiyama Wind Power Plant, Hirohata Biomass Power Generation, Osaka Gas USA Corporation, Sabine Energy Inc., Osaka Gas Australia Pty Ltd, Osaka Gas Gorgon Pty Ltd, Osaka Gas Ichthys Pty Ltd, Osaka Gas Ichthys Development Pty Ltd, Osaka Gas Crux Pty Ltd, Osaka Gas Singapore Pte.Ltd., DAIGAS SJ CGD PTE. LTD., Osaka Gas UK Ltd., Osaka Gas Urban Development, Prime Estate, Osaka Gas Facilities, Ogis Soken, Sakura Information System, Osaka Gas Chemical, Jacobi Carbons AB
|
Press page — |
Metrics
| Valuation | |
|---|---|
| Market cap | ¥ 2.173T |
| Market cap (USD) | $ 13.579B |
| P/E | 17.41 |
| PEG | 0.45 |
| P/BV | 1.15 |
| P/S | 1.04 |
| P/OCF | 8.22 |
| P/FCF | 107.48 |
| Dividend yield | 2.1% |
| Turnover / mcap | — |
| Returns | |
|---|---|
| ROE | 8.5% |
| ROI | 6.1% |
| ROIC | 5.3% |
| Profit margin | 7.5% |
| Growth | |
|---|---|
| Revenue growing | No |
| Profits growing | Yes |
| Revenue up 3y | No |
| Revenue up 5y | No |
| Earnings growth 3y (net profit CAGR) | 38.8% |
| Quality | |
|---|---|
| Profitable | Yes |
| Margin expanding | Yes |
| Buying back stock | Yes |
| Diluting (TTM) | No |
| Debt/Equity | — |
| Podcast bulls (TTM) | Sign up |
| Podcast bears (TTM) | Sign up |
| Podcast sentiment (TTM) | Sign up |
| Podcast sentiment % (TTM) | Sign up |
| News sentiment (TTM) | 0 |
| Quality score | 0% |
| Insiders | |
|---|---|
| Buys, 1w | Sign up |
| Buys, 1m | Sign up |
| Buys, 1y | Sign up |
| Sells, 1w | Sign up |
| Sells, 1m | Sign up |
| Sells, 1y | Sign up |
Sign up to see this company's insider trades
| Figure | FY 2026 | FY 2025 | FY 2024 | FY 2023 | FY 2022 | FY 2021 | FY 2020 | FY 2019 | FY 2018 | FY 2017 | FY 2016 | FY 2015 | FY 2014 | FY 2013 |
|---|---|---|---|---|---|---|---|---|---|---|---|---|---|---|
| Revenue | 2.03T | 2.069T | 2.083T | 2.275T | 1.587T | 1.364T | 1.369T | 1.372T | 1.296T | 1.184T | 1.322T | 1.528T | 1.513T | 1.38T |
| Net profit | 152.751B | 134.414B | 132.679B | 57.11B | 128.256B | 80.857B | 41.788B | 33.601B | 37.724B | 61.271B | 84.324B | 76.709B | 41.725B | 52.467B |
| Free cash flow | 89.623B | 61.27B | 125.243B | -160.576B | -42.647B | 37.042B | 56.145B | -36.926B | 89.672B | 56.08B | 164.263B | — | — | — |
| Figure | FY 2026 | FY 2025 | FY 2024 | FY 2023 | FY 2022 | FY 2021 | FY 2020 | FY 2019 | FY 2018 | FY 2017 | FY 2016 | FY 2015 | FY 2014 | FY 2013 |
|---|---|---|---|---|---|---|---|---|---|---|---|---|---|---|
| Share price | 6.38K | 3.383K | 3.392K | 2.18K | 2.092K | 2.157K | 2.036K | 2.184K | 2.1K | 423.08 | 2.162K | 2.514K | 1.955K | 414.06 |
| Price performance 12m | 0.89 | -0 | 0.56 | 0.04 | -0.03 | 0.06 | -0.07 | 0.04 | 3.96 | -0.8 | -0.14 | 0.29 | 3.72 | — |
Filed figures
Lines the statements and their notes report beside the headline figures, read from the filings' XBRL as filed (no restatement applied), with figures computed from one filing's own lines. Cash-flow lines carry their cash direction: an outflow is negative. Each period links to its filing; a figure's period, report date and tag are in its tooltip.
| Figure | Mar 2017 | Mar 2018 | Mar 2019 | Mar 2020 | Mar 2021 | Mar 2022 | Mar 2023 | Mar 2024 | Mar 2025 | Mar 2026 |
|---|---|---|---|---|---|---|---|---|---|---|
| Balance sheet detail | ||||||||||
| Trade receivables (JPY) | 178B | 190B | 219B | 211B | 212B | 209B | 280B | 271B | 318B | 297B |
| ↳ YoY growth | +6.1% | +7.3% | +15.1% | -4.0% | +0.6% | -1.3% | +33.9% | -3.2% | +17.5% | -6.6% |
| ↳ 5y CAGR | +4.8% | +3.3% | +8.0% | +4.3% | +8.6% | +7.0% | ||||
| Borrowings, current (JPY) | 23.1B | 22.2B | 22.8B | 20B | — | — | — | 7.61B | 8.97B | — |
| Borrowings, non-current (JPY) | 463B | 408B | 512B | 654B | 688B | 716B | 812B | 815B | 865B | 794B |
| Bonds payable (JPY) | 195B | 165B | 145B | 290B | 355B | 365B | 425B | 460B | 501B | 491B |
| Cash and deposits (JPY) | 168B | 172B | 116B | 147B | 167B | 131B | 85.1B | 77.7B | 82.8B | 59B |
| Intangible assets (JPY) | 77.5B | 79.7B | 128B | 98.3B | 97.9B | 95.3B | 105B | 109B | 92.4B | 79.1B |
| Net debt (borrowings + leases - cash) (JPY) | 318B | 259B | 419B | 507B | 521B | 584B | 726B | 737B | 782B | 735B |
| Cash flow detail | ||||||||||
| Operating cash flow (JPY) | 149B | 169B | 65.1B | 183B | 220B | 145B | 33.6B | 313B | 284B | 341B |
| Purchases of property, plant and equipment (JPY) | -83.4B | -73.1B | -80.1B | -118B | -170B | -173B | -172B | -175B | -211B | -239B |
| Purchases of intangible assets (JPY) | -9.29B | -5.98B | -21.9B | -9.17B | -13.1B | -14.5B | -22.1B | -12.7B | -11.6B | -12.6B |
| Change in receivables (cash effect) (JPY) | -11.2B | -15.5B | -27.7B | 12.2B | -1.2B | -48.4B | -47.7B | 13.2B | -42.7B | 21.1B |
| Change in inventories (cash effect) (JPY) | 9.17B | -8.14B | -35.1B | 4.01B | 26.1B | -47.7B | -65.4B | 19.6B | 10B | 4.82B |
| Change in payables (cash effect) (JPY) | -3.43B | 10.4B | 6.9B | 664M | 1.2B | 41.6B | -40.8B | 12.1B | 17.3B | -6.71B |
| Dividends paid (cash effect) (JPY) | -20.8B | -20.8B | -20.8B | -20.8B | -20.8B | -22.9B | -24.9B | -26B | -39.5B | -42.2B |
| Share buybacks (cash effect) (JPY) | — | — | — | — | — | — | -38M | -20.1B | -40.1B | -63.5B |
| Interest paid (cash effect) (JPY) | -9.66B | -9.32B | -10.2B | -12.3B | -11.4B | -10.6B | -12.4B | -14.3B | -15.4B | -13.8B |
| Income taxes paid (cash effect) (JPY) | -42.5B | -26.5B | -29B | -23.1B | -23.9B | -39.4B | -17.7B | -45.6B | -23B | -35.6B |
| Operating cash flow before change in receivables (JPY) | 160B | 184B | 92.8B | 171B | 221B | 194B | 81.2B | 299B | 326B | 320B |
| Free cash flow (OCF - PPE - intangibles) (JPY) | 56.1B | 89.7B | -36.9B | 56.1B | 37B | -42.6B | -161B | 125B | 61.3B | 89.6B |
| Income detail | ||||||||||
| Research and development expense (JPY) | 10.4B | 9.71B | 11B | 10.2B | 9.44B | 9.5B | 9.63B | 9.89B | 12.7B | 14.4B |
| ↳ 5y CAGR | -3.6% | -1.7% | -0.2% | -2.0% | +4.5% | +8.8% | ||||
| Total comprehensive income (JPY) | 78B | 60.6B | 28B | 15B | 109B | 209B | 146B | 234B | 191B | 221B |
| Comprehensive income to owners (JPY) | 76.3B | 58.7B | 25.7B | 13.7B | 106B | 202B | 145B | 232B | 190B | 221B |
| Provision for credit losses (JPY) | 91M | 276M | 46M | 574M | 234M | 352M | 478M | 446M | 695M | 451M |
| Credit cost ratio (credit losses / average receivables) (%) | 0.1% | 0.2% | 0.0% | 0.3% | 0.1% | 0.2% | 0.2% | 0.2% | 0.2% | 0.1% |
| Segments | ||||||||||
| Domestic Energy · Segment revenue (JPY) | — | — | — | — | 1.16T | 1.34T | 1.97T | 1.77T | 1.74T | 1.64T |
| ↳ YoY growth | +15.3% | +47.6% | -10.2% | -1.9% | -5.4% | |||||
| Domestic Energy · Segment operating income (JPY) | — | — | — | — | 85.3B | 36.4B | -31.4B | 88.4B | 74.9B | 68.7B |
| Domestic Energy Electricity · Segment revenue (JPY) | 108B | 158B | 184B | 205B | 247B | — | — | — | — | — |
| ↳ YoY growth | +46.7% | +16.8% | +11.1% | +20.7% | ||||||
| Domestic Energy Electricity · Segment operating income (JPY) | 16.1B | 20.6B | 9.35B | 8.43B | 15.7B | — | — | — | — | — |
| Domestic Energy Gas · Segment revenue (JPY) | 911B | 971B | 1.01T | 974B | 916B | — | — | — | — | — |
| ↳ YoY growth | +6.6% | +4.2% | -3.8% | -5.9% | ||||||
| Domestic Energy Gas · Segment operating income (JPY) | 54.9B | 41.7B | 34.8B | 52.6B | 64.3B | — | — | — | — | — |
| Reported | Jun 29, 2018 | Jun 29, 2018 | Jun 24, 2019 | Aug 7, 2020 | Jun 28, 2022 | Jun 28, 2022 | Jun 27, 2024 | Nov 8, 2024 | Nov 7, 2025 | Jun 22, 2026 |
Sign up to see institutional holdings
Sign UpPodcast Mentions
Sign up to see podcast mentions and sentiment
Sign UpTimely disclosures published on TDnet, newest first, titles as filed in Japanese. The link opens the disclosure on TDnet. Filings with EDINET (periodic reports, extraordinary reports, offerings, holding and buy-back reports), newest first, titles as filed in Japanese. The link opens the filing on EDINET. Press releases from the company's own website, newest first.


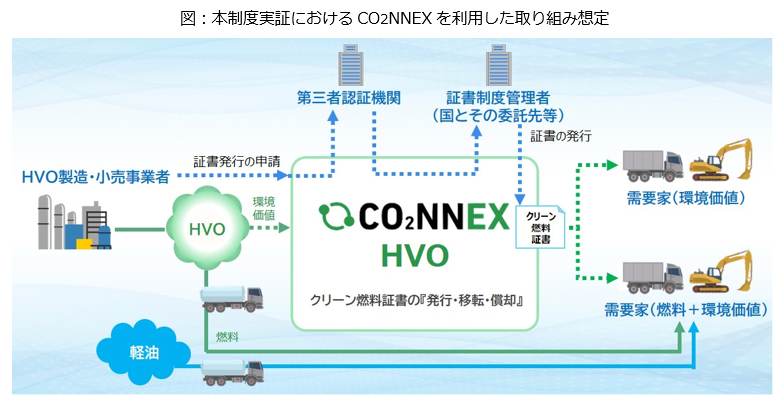


 なお、「CO2NNEX」は三菱重工の日本およびその他の国における登録商標です。


 DaigasグループTOP






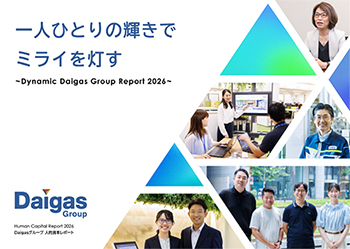 「Daigasグループ人的資本レポート2026 (一人ひとりの輝きでミライを灯す ~Dynamic Daigas Group Report 2026~)」は
 以上 |

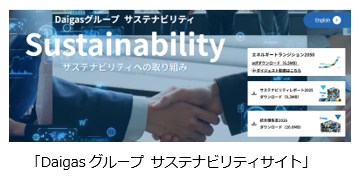
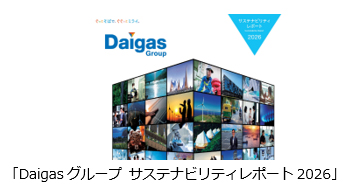 当社グループは今後も事業活動を通じて、お客さま、社会、株主さま、従業員とともに、持続可能な経済成長と社会的課題の解決を目指していきます。またこれらの取り組みは、各媒体の発行やコミュニケーションを通じて、ステークホルダーの皆さまへ報告していきます。 ●サステナビリティサイト
 ●サステナビリティレポート
 サステナビリティサイトおよびサステナビリティレポートの英語版は10月以降に公開予定です。以上
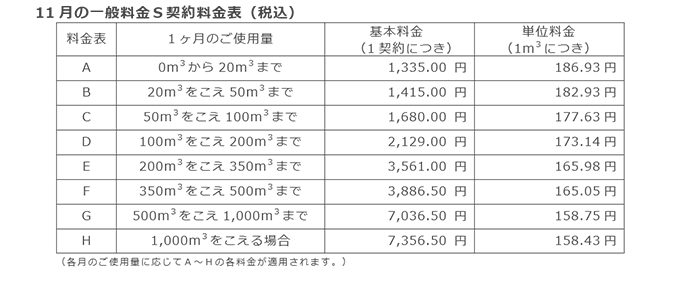
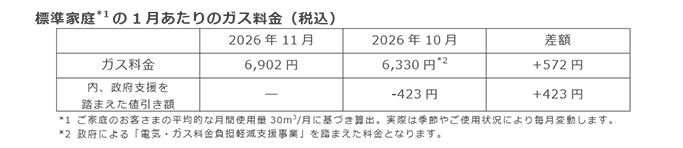

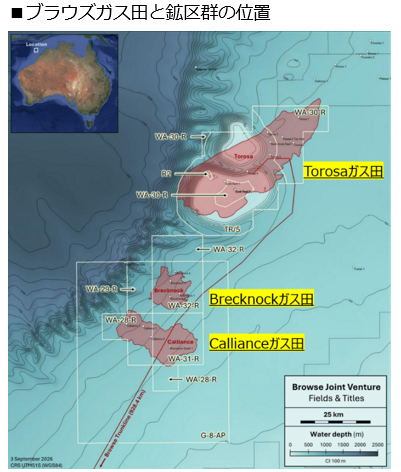
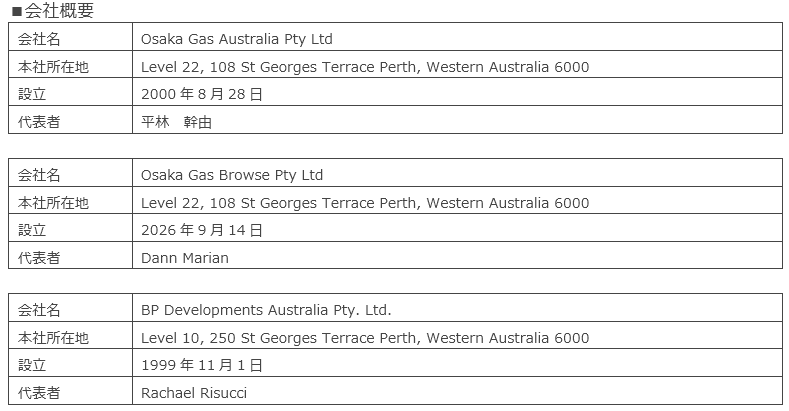
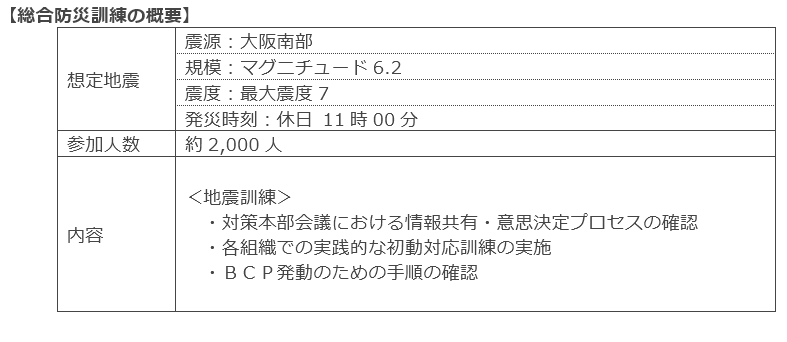
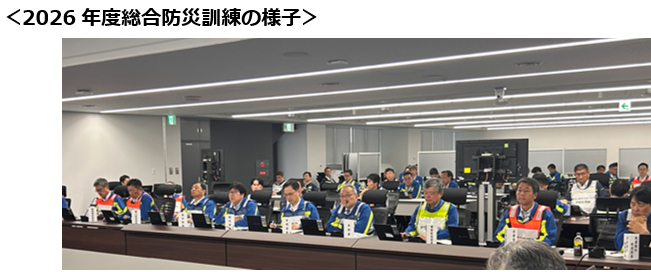





 をご覧ください。
Prompts
Click prompts to add them under the company line, click again to take one out, then copy the result into your AI chat. Shared by Asian Century Stocks and Uncovered Thai Stocks. Thank you.
Osaka Gas Co., Ltd. (ticker 9532), listed in Japan.
Copied
ETFs Holding Osaka Gas Co., Ltd.
Exchange-traded funds whose newest published daily portfolio holds one of the company's listings, largest weight first.